Racial diversity in Missouri is a mixed bag.
There are parts of Missouri where there’s a high level of diversity. But where will you find the most diverse places in Missouri?
To answer that question, we went to the US Census data. Using Saturday Night Science, we measured the Gini coefficient for all 131 cities in Missouri to rank them from most to least diverse.
#1 most diverse in Missouri
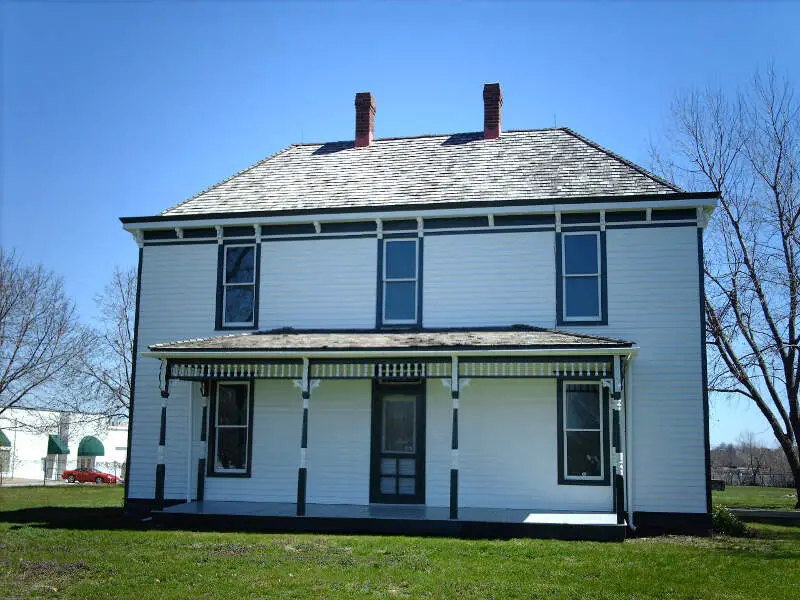
Grandview is a city in Jackson County, Missouri, United States. The population was 24,475 at the 2010 census.
Data | Crime | Cost of living | Movers
#2 most diverse in Missouri
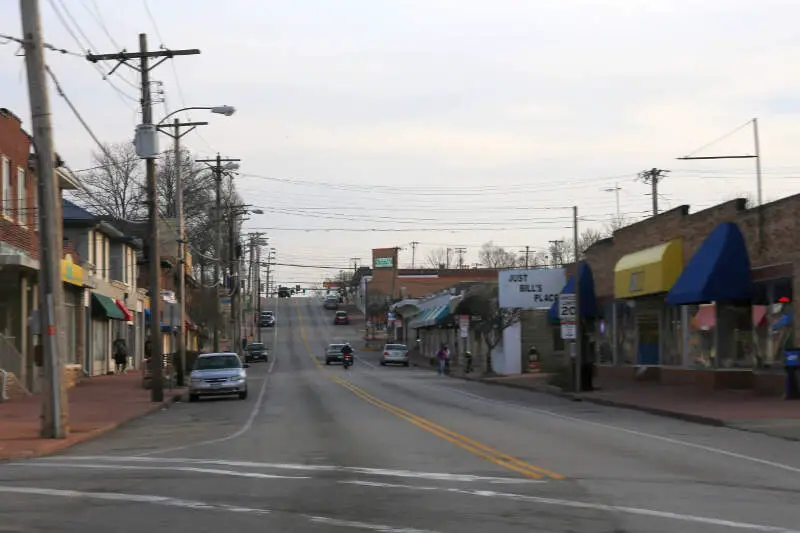
Overland is a city in St. Louis County, Missouri, United States. The population was 16,062 at the 2010 census.
Data | Crime | Cost of living | Movers | Compare
#3 most diverse in Missouri
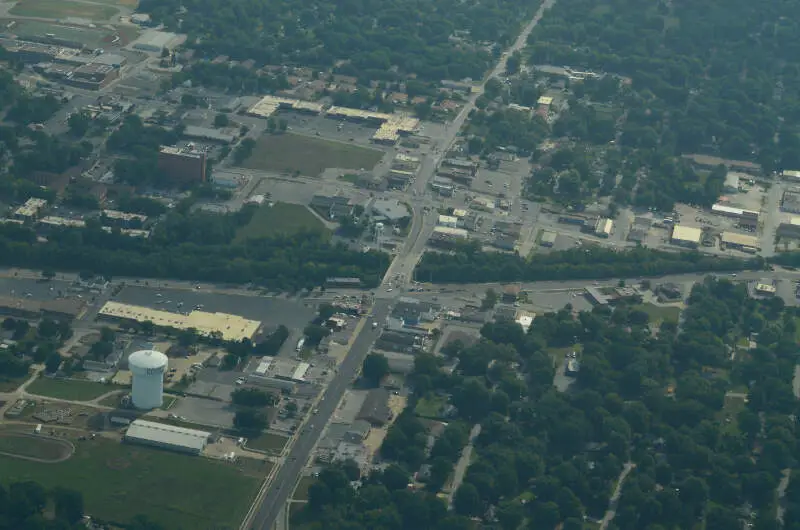
University City is an inner-ring suburb of the city of St. Louis in St. Louis County, in the U.S. state of Missouri. The population was 35,371 in 2010 census.
Data | Crime | Cost of living | Movers
#4 most diverse in Missouri
Raytown is a city in Jackson County, Missouri, United States, and is a suburb of Kansas City. The population was at 29,526 in 2010 census. The mayor of Raytown is Michael McDonough.
Data | Crime | Cost of living | Movers
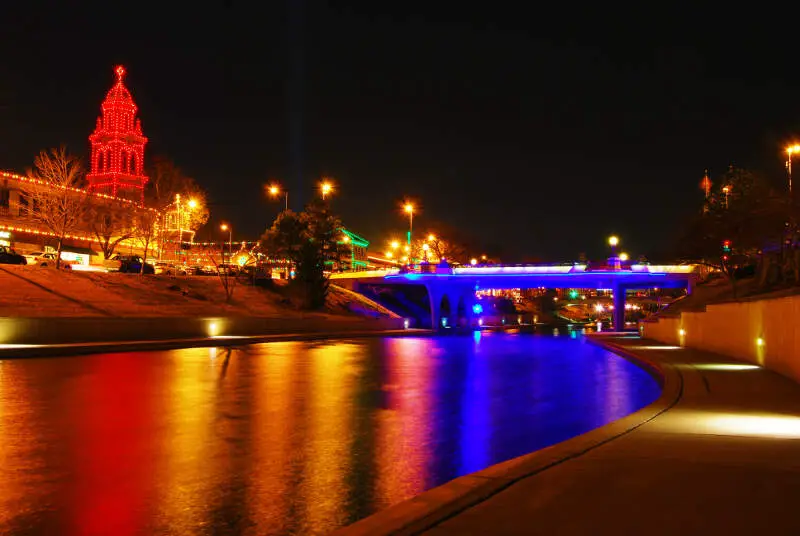
#5 most diverse in Missouri
Kansas City is the largest city in Missouri, United States. According to the U.S. Census Bureau, the city had an estimated population of 481,420 in 2016, making it the 37th largest city by population in the United States. It is the central city of the Kansas City metropolitan area, which straddles the Kansas-Missouri border. Kansas City was founded in the 1830s as a Missouri River port at its confluence with the Kansas River coming in from the west. On June 1, 1850 the town of Kansas was incorporated; shortly after came the establishment of the Kansas Territory. Confusion between the two ensued and the name Kansas City was assigned to distinguish them soon thereafter.
Data | Crime | Cost of living | Movers | Compare

#5 most diverse in Missouri
Data | Crime | Cost of living | Movers
#7 most diverse in Missouri
Olivette is an inner-ring suburb of St. Louis, located in St. Louis County, Missouri, United States. The population was 7,737 at the 2010 census.
Data | Crime | Cost of living | Movers

#8 most diverse in Missouri
Data | Crime | Cost of living | Movers
#9 most diverse in Missouri
Data | Crime | Cost of living | Movers
#10 most diverse in Missouri
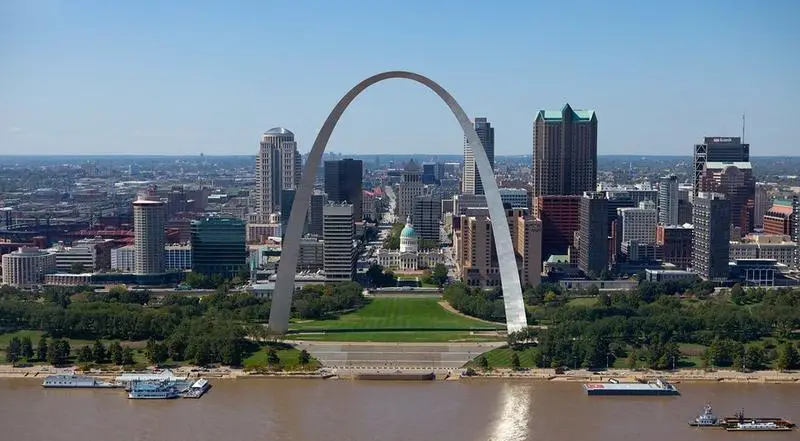
St. Louis is an independent city and major U.S. port in the state of Missouri, built along the western bank of the Mississippi River, on the border with Illinois. The city had an estimated 2016 population of 311,404, and is the cultural and economic center of the Greater St. Louis area, making it the largest metropolitan area in Missouri and the 19th-largest in the United States.
Data | Crime | Cost of living | Movers | Compare
The receipts
Compare the top ten
Pick a metric. The bars rescale. The red line is Missouri’s statewide median.
On the map
Where diversity lives in Missouri
Saturday Night Science
Methodology: How we determined the most diverse cities in Missouri for 2026
We still believe in the accuracy of data — especially from the Census — and Saturday Night Science. So that’s where we went to get the race breakdown across Missouri.
That leads us to the Census’s most recently available data, the 2020-2024 American Community Survey data from the US Census.
Specifically, we looked at table B03002: HISPANIC OR LATINO ORIGIN BY RACE. Here are the category names as defined by the Census:
- White alone*
- Black or African American alone*
- American Indian and Alaska Native alone*
- Asian alone*
- Native Hawaiian and Other Pacific Islander alone*
- Some other race alone*
- Two or more races*
- Hispanic or Latino
We limited our analysis to non-CDPs with a population greater than 5,000 people. That left us with 131 cities.
We then calculated the HHI for each city by finding the racial breakdown of a city in percent terms, squaring them, and then adding the squares together. This left us with scores ranging from 3,309 (Grandview) to 8,948 (Savannah).
Finally, we ranked each city based on the HHI, with a lower score being more diverse than a high score. Grandview took the distinction of being the most diverse, while Savannah was the least diverse city.
We updated this article for 2026. This report is our eleventh time ranking the most diverse places in Missouri.
The full plate
Race By City In Missouri For 2026
Click any column to sort. Search by city name.
| Rank | City | Population | HHI | % White | % Black | % Hispanic | % Asian |
|---|---|---|---|---|---|---|---|
| 1 | Grandview | 26,527 | 3,309 | 45.0% | 32.3% | 14.3% | 2.0% |
| 2 | Overland | 15,695 | 3,398 | 49.0% | 27.0% | 15.3% | 1.9% |
| 3 | University City | 34,685 | 3,605 | 50.4% | 30.9% | 5.0% | 7.9% |
| 4 | Raytown | 29,445 | 3,654 | 46.5% | 36.8% | 10.6% | 0.4% |
| 5 | Kansas City | 510,612 | 3,740 | 54.0% | 25.2% | 12.5% | 2.8% |
| 5 | Hazelwood | 25,114 | 3,741 | 44.7% | 40.5% | 3.9% | 1.6% |
| 7 | Olivette | 8,645 | 3,757 | 55.1% | 16.1% | 1.6% | 20.3% |
| 8 | Maryland Heights | 27,880 | 3,773 | 56.2% | 13.3% | 5.6% | 19.6% |
| 9 | St. John | 6,527 | 3,780 | 48.1% | 36.2% | 12.1% | 0.4% |
| 10 | St. Louis | 288,512 | 3,805 | 44.4% | 42.1% | 5.3% | 3.5% |
| 11 | St. Ann | 12,811 | 3,836 | 55.1% | 24.5% | 12.9% | 2.1% |
| 12 | Bridgeton | 11,369 | 3,891 | 55.8% | 23.7% | 13.8% | 2.7% |
| 13 | Florissant | 51,773 | 4,046 | 45.4% | 43.9% | 2.4% | 0.9% |
| 14 | St. Robert | 5,356 | 4,594 | 65.9% | 10.4% | 6.8% | 6.0% |
| 15 | Clayton | 17,380 | 4,747 | 66.6% | 8.7% | 3.7% | 13.3% |
| 16 | Carthage | 15,574 | 4,767 | 59.7% | 1.4% | 34.5% | 0.1% |
| 17 | Monett | 9,873 | 4,840 | 63.6% | 0.4% | 27.5% | 0.5% |
| 18 | Marshall | 13,739 | 4,901 | 66.9% | 4.7% | 19.2% | 0.6% |
| 19 | Independence | 121,740 | 5,012 | 68.5% | 10.6% | 13.3% | 1.2% |
| 19 | Creve Coeur | 18,643 | 5,012 | 68.8% | 8.5% | 2.4% | 13.0% |
| 21 | Caruthersville | 5,326 | 5,120 | 66.1% | 26.9% | 3.4% | 0.4% |
| 22 | Neosho | 13,224 | 5,169 | 69.7% | 0.9% | 13.9% | 0.3% |
| 23 | Sikeston | 16,320 | 5,172 | 68.2% | 21.3% | 2.3% | 0.2% |
| 24 | Manchester | 18,160 | 5,315 | 71.2% | 3.6% | 5.0% | 12.4% |
| 25 | Maplewood | 8,156 | 5,343 | 71.4% | 10.2% | 2.2% | 5.7% |
| 26 | Columbia | 128,548 | 5,367 | 71.7% | 12.1% | 4.4% | 6.3% |
| 27 | Ferguson | 18,213 | 5,397 | 25.8% | 68.7% | 1.3% | 0.1% |
| 28 | Jefferson City | 42,488 | 5,401 | 71.4% | 16.0% | 4.0% | 2.4% |
| 29 | Chesterfield | 49,574 | 5,644 | 73.6% | 3.8% | 3.3% | 13.2% |
| 30 | Waynesville | 5,442 | 5,645 | 73.7% | 4.8% | 12.5% | 2.9% |
| 31 | Gladstone | 27,207 | 5,673 | 74.1% | 7.0% | 9.9% | 1.7% |
| 32 | Sedalia | 22,003 | 5,729 | 73.8% | 4.0% | 15.1% | 1.0% |
| 33 | Ballwin | 31,279 | 5,792 | 75.0% | 2.8% | 4.1% | 8.9% |
| 34 | Cape Girardeau | 40,344 | 5,875 | 75.2% | 13.2% | 3.7% | 2.6% |
| 35 | Belton | 25,008 | 6,015 | 76.5% | 8.2% | 7.7% | 1.1% |
| 36 | Raymore | 24,526 | 6,046 | 76.7% | 8.8% | 6.9% | 1.1% |
| 37 | Bonne Terre | 6,683 | 6,053 | 76.5% | 11.1% | 2.5% | 1.6% |
| 38 | Kennett | 10,196 | 6,097 | 76.7% | 11.1% | 1.9% | 0.8% |
| 39 | Lee’s Summit | 103,656 | 6,104 | 77.1% | 9.6% | 6.1% | 1.9% |
| 40 | St. Joseph | 71,236 | 6,127 | 77.3% | 6.5% | 8.4% | 1.2% |
| 41 | St. Charles | 71,508 | 6,165 | 77.7% | 7.2% | 6.5% | 3.8% |
| 42 | Herculaneum | 5,071 | 6,171 | 77.4% | 7.2% | 3.9% | 0.3% |
| 43 | Brentwood | 8,144 | 6,235 | 77.9% | 2.9% | 1.4% | 7.1% |
| 44 | Shrewsbury | 6,316 | 6,242 | 78.2% | 9.6% | 2.3% | 4.3% |
| 45 | Parkville | 8,366 | 6,247 | 78.1% | 4.3% | 10.2% | 2.5% |
| 46 | Blue Springs | 59,965 | 6,248 | 78.2% | 8.0% | 6.2% | 1.7% |
| 47 | Poplar Bluff | 16,254 | 6,306 | 78.5% | 9.1% | 2.4% | 0.9% |
| 48 | Rolla | 20,287 | 6,332 | 78.9% | 4.9% | 4.6% | 7.3% |
| 49 | Warrensburg | 19,582 | 6,348 | 79.0% | 6.4% | 5.6% | 3.0% |
| 50 | Berkeley | 8,123 | 6,388 | 8.3% | 79.0% | 7.5% | 0.3% |
| 51 | O’Fallon | 93,801 | 6,419 | 79.5% | 5.2% | 5.5% | 4.8% |
| 52 | Peculiar | 5,958 | 6,460 | 79.5% | 4.5% | 8.0% | 0.0% |
| 53 | Wright City | 5,240 | 6,475 | 79.0% | 0.7% | 13.9% | 0.0% |
| 54 | Pacific | 7,475 | 6,517 | 79.7% | 6.7% | 2.3% | 0.1% |
| 55 | Branson | 12,817 | 6,527 | 80.1% | 5.4% | 6.8% | 2.9% |
| 56 | Town and Country | 11,607 | 6,598 | 80.5% | 2.4% | 2.9% | 8.9% |
| 57 | Grain Valley | 16,271 | 6,603 | 80.4% | 4.9% | 9.6% | 0.5% |
| 58 | Cottleville | 5,937 | 6,606 | 80.6% | 7.1% | 3.5% | 1.3% |
| 59 | Joplin | 52,593 | 6,689 | 81.2% | 2.9% | 6.3% | 2.2% |
| 60 | Webster Groves | 23,712 | 6,697 | 81.1% | 5.2% | 3.3% | 1.8% |
| 61 | Ellisville | 10,002 | 6,710 | 81.2% | 0.7% | 8.1% | 3.9% |
| 62 | Excelsior Springs | 10,484 | 6,726 | 81.2% | 3.3% | 8.9% | 0.1% |
| 63 | Richmond Heights | 9,153 | 6,737 | 81.5% | 7.3% | 3.3% | 3.8% |
| 64 | Springfield | 169,954 | 6,743 | 81.6% | 4.5% | 5.8% | 1.9% |
| 65 | Kirkwood | 29,363 | 6,751 | 81.5% | 4.4% | 2.7% | 2.0% |
| 66 | Valley Park | 6,795 | 6,814 | 82.0% | 7.7% | 4.4% | 2.0% |
| 67 | Wildwood | 35,133 | 6,930 | 82.7% | 0.6% | 4.4% | 6.6% |
| 68 | Moberly | 13,526 | 6,938 | 82.6% | 8.3% | 2.6% | 0.3% |
| 69 | Kirksville | 17,563 | 6,951 | 82.9% | 6.4% | 3.7% | 2.9% |
| 70 | Boonville | 7,689 | 6,991 | 82.9% | 9.2% | 2.9% | 0.2% |
| 71 | Mexico | 11,477 | 7,074 | 83.6% | 6.9% | 2.0% | 0.8% |
| 72 | Liberty | 30,689 | 7,075 | 83.7% | 4.6% | 5.0% | 1.2% |
| 73 | Webb City | 13,221 | 7,103 | 83.7% | 2.4% | 3.7% | 1.7% |
| 74 | Fulton | 12,617 | 7,135 | 83.9% | 8.2% | 1.9% | 0.3% |
| 75 | Wentzville | 47,061 | 7,165 | 84.2% | 6.6% | 3.3% | 1.6% |
| 76 | Marshfield | 7,696 | 7,186 | 84.0% | 4.2% | 1.1% | 0.0% |
| 77 | Bellefontaine Neighbors | 10,498 | 7,220 | 11.0% | 84.1% | 0.3% | 0.0% |
| 78 | Lake St. Louis | 18,066 | 7,238 | 84.7% | 5.5% | 2.5% | 1.9% |
| 79 | Greenwood | 6,013 | 7,259 | 84.8% | 3.9% | 5.0% | 0.3% |
| 80 | St. Peters | 59,092 | 7,285 | 85.0% | 4.6% | 2.9% | 2.6% |
| 81 | Dardenne Prairie | 13,503 | 7,299 | 85.1% | 3.4% | 3.3% | 5.6% |
| 82 | Ozark | 22,417 | 7,362 | 85.4% | 1.5% | 6.0% | 0.8% |
| 83 | Ste. Genevieve | 5,010 | 7,364 | 85.3% | 3.9% | 2.4% | 0.1% |
| 84 | Macon | 5,466 | 7,371 | 85.5% | 3.9% | 3.3% | 0.8% |
| 85 | De Soto | 6,470 | 7,385 | 84.9% | 0.2% | 1.1% | 0.0% |
| 86 | Ladue | 8,940 | 7,397 | 85.6% | 1.3% | 1.6% | 6.7% |
| 87 | Eureka | 13,081 | 7,398 | 85.6% | 0.8% | 3.0% | 2.2% |
| 88 | Cameron | 8,519 | 7,452 | 85.9% | 7.2% | 3.2% | 0.2% |
| 89 | Festus | 13,201 | 7,473 | 86.1% | 3.2% | 3.7% | 0.4% |
| 90 | Union | 12,781 | 7,551 | 86.5% | 2.2% | 2.5% | 1.3% |
| 91 | Pleasant Hill | 8,847 | 7,644 | 87.1% | 0.3% | 6.6% | 0.6% |
| 92 | Chillicothe | 8,923 | 7,648 | 87.2% | 4.9% | 2.6% | 0.3% |
| 93 | Hannibal | 16,771 | 7,673 | 87.3% | 5.7% | 2.7% | 1.1% |
| 94 | Jackson | 15,659 | 7,725 | 87.7% | 2.6% | 4.0% | 1.3% |
| 95 | Republic | 19,829 | 7,767 | 87.8% | 0.8% | 5.4% | 0.7% |
| 96 | Sullivan | 6,310 | 7,787 | 87.7% | 1.5% | 0.8% | 0.0% |
| 97 | Arnold | 20,956 | 7,808 | 88.0% | 0.2% | 2.6% | 1.8% |
| 98 | Nevada | 7,925 | 7,809 | 88.1% | 2.2% | 5.0% | 1.2% |
| 99 | Maryville | 10,428 | 7,839 | 88.3% | 3.5% | 3.6% | 2.8% |
| 100 | Troy | 13,947 | 7,860 | 88.4% | 2.6% | 4.8% | 0.5% |
Source: U.S. Census ACS 2020-2024. 131 cities with more than 5,000 residents.
Summary
Summary: Diversity Across Missouri
If you’re looking for a scientific breakdown of diversity across Missouri, this is an accurate list.
The most diverse cities in Missouri are Grandview, Overland, University City, Raytown, Kansas City, Hazelwood, Olivette, Maryland Heights, St. John, and St. Louis. Not sold on Missouri? Take the two-minute Find Your Place quiz and see which state actually fits you.
Questions and answers
Most Diverse Cities In Missouri FAQs
What is the most diverse city in Missouri?
Grandview is the most diverse city in Missouri for 2026, posting the lowest diversity index (3,309) of the 131 places we measured. Overland and University City are next.
What are the 10 most diverse cities in Missouri?
The ten most diverse cities in Missouri are Grandview, Overland, University City, Raytown, Kansas City, Hazelwood, Olivette, Maryland Heights, St. John, and St. Louis. We ranked all 131 places with more than 5,000 residents by their racial-diversity HHI.
How do you measure diversity?
We use a Herfindahl-Hirschman Index (HHI) across each city’s White, Black, Hispanic, and Asian population shares from the Census American Community Survey. A lower score means the mix is more even, so the lowest HHI wins.
What is the least diverse city in Missouri?
Savannah is the least diverse city in Missouri, with a diversity index of 8,948. That means one group makes up most of its population.
Where does this data come from?
All population shares come from the Census Bureau’s American Community Survey (2020-2024). Diversity scores in Missouri range from 3,309 in Grandview to 8,948 in Savannah.