To live in Georgia’smost expensive places, you’re going to need a couple of things.
You’ll need a job that pays $77,516/year. To get that heavy piggy bank, you’re going to want to get a job at one of Georgia’s highest-paying companies like Home Depot, Coca-Cola, and Alfac.
To produce the list of places that will break the bank in Georgia, we compared the latest cost of living data from the American Community Survey. We also considered home prices to income and rent to income for the 131 places with at least 5,000 people.
Grab a slice of peach pie, find a sunny spot on the beach in Savannah, and keep reading.
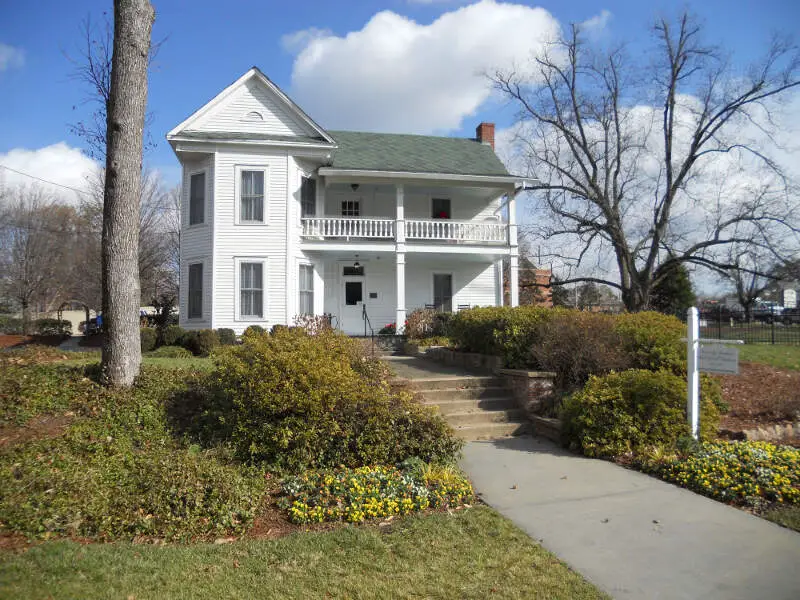
$139,397 median income · $279,470 median home · #72 home prices in Georgia
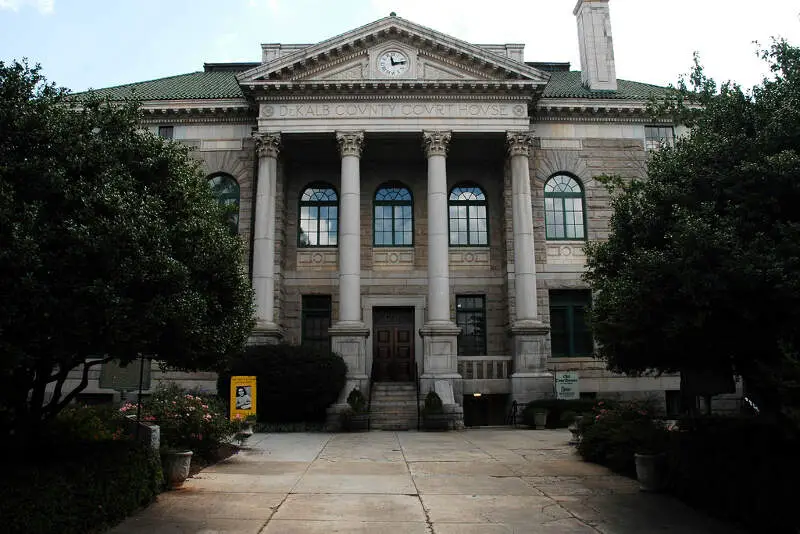
Decatur is a city in, and the county seat of, DeKalb County, Georgia, United States and is part of the Atlanta metropolitan area. With a population of 20,148 in the 2013 census, the municipality is sometimes assumed to be larger since multiple zip codes in unincorporated DeKalb County bear the Decatur name. The city is served by three MARTA rail stations. The city is located approximately 5 miles northeast of downtown Atlanta and shares its western border with Atlanta.
Data | Crime | Cost of living | Movers
$117,663 median income · $741,429 median home · #2 home prices in Georgia
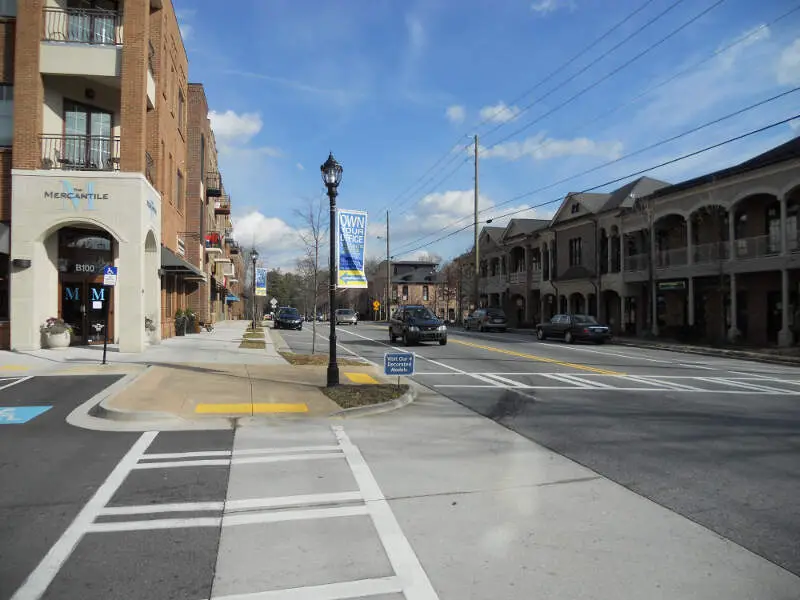
Brookhaven is a city in the northeastern suburbs of Atlanta and is located in western DeKalb County, Georgia, United States, directly northeast of Atlanta. On July 31, 2012, Brookhaven was approved in a referendum to become DeKalb County’s 11th city. Incorporation officially took place on December 17, 2012, on which date municipal operations commenced. With a population of around 49,000, it is the largest city in DeKalb County. The new city stretches over 12 square miles.
Data | Crime | Cost of living | Movers
$171,295 median income · $941,274 median home · #1 home prices in Georgia
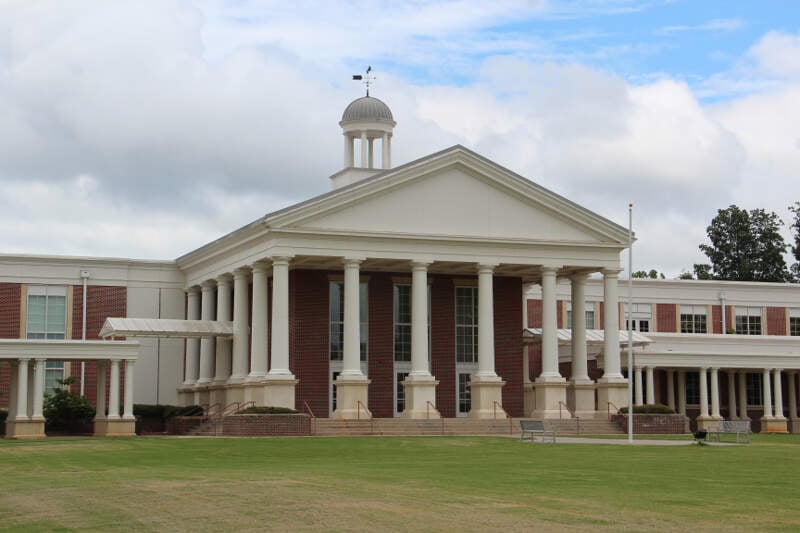
Milton is a city and suburb in Fulton County, Georgia, United States. Incorporated on December 1, 2006, it was created out of the entire unincorporated northernmost part of northern Fulton County. It is an affluent community, with an average household income within the ZIP code 30004 of $99,412. As of the 2010 census, Milton’s population was 32,661, with an estimated population of 36,662 in 2014.
Data | Crime | Cost of living | Movers
$147,612 median income · $726,349 median home · #3 home prices in Georgia
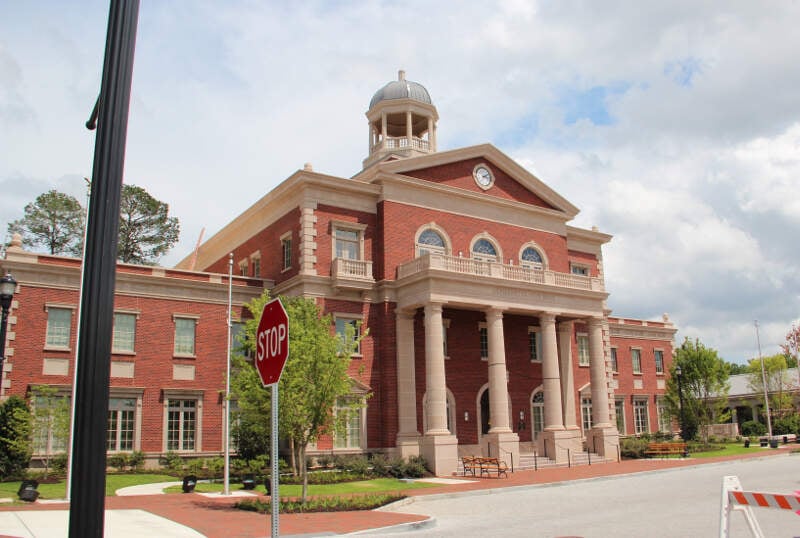
Alpharetta is a city located in north Fulton County, Georgia, United States and is a suburb of Atlanta. As of the 2010 census, Alpharetta’s population was 57,551. The estimated population in 2014 was 63,038.
Data | Crime | Cost of living | Movers
$121,903 median income · $675,944 median home · #6 home prices in Georgia
Dunwoody is a city located in DeKalb County, Georgia, United States. It is a northern suburb of Atlanta. Dunwoody was incorporated as a city on December 1, 2008. As of 2015, the city has a population of 48,733, up from 46,267 in the 2010 Census.
Data | Crime | Cost of living | Movers

$104,340 median income · $691,063 median home · #5 home prices in Georgia
Sandy Springs is a city in northern Fulton County, Georgia, United States, and part of the Atlanta metropolitan area. As of the 2010 census, Sandy Springs had a population of 93,853, and as of 2014 the estimated population was 101,908.
Data | Crime | Cost of living | Movers

$160,093 median income · $703,497 median home · #4 home prices in Georgia
Johns Creek is a city located in Fulton County in the U.S. state of Georgia. According to the 2010 U.S. Census, the population was 76,728. The city is a northeastern suburb of Atlanta. In 2017 Johns Creek ranked third on the USA TODAY list of “50 best cities to live in.”
Data | Crime | Cost of living | Movers

$128,654 median income · $658,156 median home · #7 home prices in Georgia
Roswell is a city in north Fulton County, Georgia, United States. At the 2010 census it had a population of 88,346, and in 2014 the estimated population was 94,089, making it Georgia’s seventh largest city.
Data | Crime | Cost of living | Movers
$77,516 median income · $382,573 median home · #35 home prices in Georgia
The city of Dahlonega is the county seat of Lumpkin County, Georgia, United States. As of the 2010 census, the city had a population of 5,242.
Data | Crime | Cost of living | Movers
$113,987 median income · $573,532 median home · #10 home prices in Georgia
Peachtree City is the largest city in Fayette County, Georgia, United States. As of the 2010 census it had a population of 34,364. Peachtree City is located in South Metro Atlanta.
Data | Crime | Cost of living | Movers
The receipts
Compare the top ten
Pick a metric. The bars rescale. The red line is Georgia’s statewide median.
Georgia statewide median: $332,063
Georgia statewide median: $77,353
On the map
Mapping the most expensive places in Georgia
Saturday Night Science
Methodology: How We Determined The Most Expensive Places To Live In The Peach State For 2026
The two most important things to think about when it comes to being able to afford a city in Georgia are how much money you make and how much you have to spend to live there.
You need to understand your costs in the context of how much money you make.
For example, if the median household earns $100,000 and spends $40,000 on housing, it’s actually cheaper to live there than a place with a median income of $50,000 and housing costs of $21,000. You might spend more on housing, but you have more money overall to play with.
With that example in mind, we derived several statistics from the latest Census American Community Survey 2020-2024 around incomes and costs. They are:
- Overall Cost Of Living Index
- Median Home Price / Median Income (lower is better)
- Median Income / Median Rent (Higher is better)
- Median Home Price
You can then compare these metrics in each of the places in Georgia to figure out which is the most expensive.
You are left with a “Cost of Living Index” by taking the average rank of each of these metrics for each city.
So we used that cost of living index to rank all of the 131 places in Georgia that have more than 5,000 people.
The place with the highest cost of living in Georgia according to the data is Decatur. We updated this article for 2026. This article is our eleventh time ranking the most expensive places to live in Georgia. The median Georgia home is 33 years old — old enough that it pays to compare home warranty plans before something expensive breaks.
The full plate
Most Expensive Cities In Georgia
Click any column to sort. Search by city name.
| Rank | City | Cost Of Living | Population | Median Income | Average Home Price | Home/Income Ratio |
|---|---|---|---|---|---|---|
| 1 | Decatur | 148 | 24,518 | $139,397 | $279,470 | 2.0x |
| 2 | Brookhaven | 144 | 57,855 | $117,663 | $741,429 | 6.3x |
| 3 | Milton | 143 | 41,546 | $171,295 | $941,274 | 5.5x |
| 4 | Alpharetta | 137 | 66,855 | $147,612 | $726,349 | 4.9x |
| 5 | Dunwoody | 136 | 51,758 | $121,903 | $675,944 | 5.5x |
| 6 | Sandy Springs | 135 | 107,087 | $104,340 | $691,063 | 6.6x |
| 7 | Johns Creek | 132 | 81,988 | $160,093 | $703,497 | 4.4x |
| 8 | Roswell | 129 | 92,621 | $128,654 | $658,156 | 5.1x |
| 9 | Dahlonega | 127 | 7,299 | $77,516 | $382,573 | 4.9x |
| 10 | Peachtree City | 126 | 39,576 | $113,987 | $573,532 | 5.0x |
| 11 | Peachtree Corners | 124 | 42,373 | $82,139 | $556,225 | 6.8x |
| 12 | Suwanee | 124 | 22,349 | $103,260 | $607,322 | 5.9x |
| 13 | Atlanta | 119 | 505,268 | $85,652 | $385,599 | 4.5x |
| 14 | Braselton | 119 | 15,178 | $120,984 | $447,114 | 3.7x |
| 15 | Marietta | 118 | 62,263 | $72,725 | $471,588 | 6.5x |
| 16 | Smyrna | 118 | 56,633 | $100,061 | $447,948 | 4.5x |
| 17 | Chamblee | 117 | 30,895 | $84,452 | $479,015 | 5.7x |
| 18 | Flowery Branch | 115 | 10,925 | $103,942 | $425,109 | 4.1x |
| 19 | Holly Springs | 114 | 18,627 | $113,992 | $433,920 | 3.8x |
| 20 | Tyrone | 114 | 7,896 | $135,691 | $526,789 | 3.9x |
| 21 | Sugar Hill | 112 | 26,128 | $107,389 | $461,262 | 4.3x |
| 22 | Senoia | 112 | 5,589 | $124,964 | $507,728 | 4.1x |
| 23 | Woodstock | 111 | 37,381 | $103,496 | $460,207 | 4.4x |
| 24 | Duluth | 111 | 32,426 | $95,331 | $448,806 | 4.7x |
| 25 | Richmond Hill | 111 | 18,181 | $92,824 | $420,904 | 4.5x |
| 26 | Canton | 110 | 35,741 | $80,091 | $514,412 | 6.4x |
| 27 | Doraville | 110 | 11,134 | $67,235 | $366,889 | 5.5x |
| 28 | Pooler | 109 | 28,466 | $91,766 | $351,155 | 3.8x |
| 29 | St. Marys | 109 | 19,166 | $74,288 | $309,204 | 4.2x |
| 30 | Norcross | 109 | 18,007 | $75,266 | $327,599 | 4.4x |
| 31 | Newnan | 108 | 44,235 | $82,292 | $363,872 | 4.4x |
| 32 | Buford | 108 | 17,997 | $69,471 | $469,651 | 6.8x |
| 33 | Fayetteville | 107 | 19,719 | $82,188 | $455,206 | 5.5x |
| 34 | Kennesaw | 106 | 34,605 | $83,356 | $403,299 | 4.8x |
| 35 | Loganville | 106 | 15,527 | $83,605 | $392,226 | 4.7x |
| 36 | Jefferson | 106 | 14,990 | $109,828 | $416,353 | 3.8x |
| 37 | Port Wentworth | 106 | 12,892 | $79,731 | $290,499 | 3.6x |
| 38 | Cartersville | 105 | 24,074 | $84,437 | $323,100 | 3.8x |
| 39 | Snellville | 105 | 21,620 | $89,896 | $355,608 | 4.0x |
| 40 | Cumming | 105 | 8,469 | $85,868 | $603,209 | 7.0x |
| 41 | Lilburn | 104 | 15,390 | $63,581 | $397,448 | 6.3x |
| 42 | Gainesville | 103 | 45,032 | $66,974 | $373,267 | 5.6x |
| 43 | Acworth | 103 | 22,473 | $83,539 | $409,265 | 4.9x |
| 44 | Kingsland | 103 | 19,627 | $77,944 | $297,403 | 3.8x |
| 45 | Powder Springs | 102 | 18,009 | $105,070 | $363,229 | 3.5x |
| 46 | College Park | 102 | 14,712 | $51,635 | $277,094 | 5.4x |
| 47 | Stockbridge | 101 | 35,737 | $70,136 | $289,839 | 4.1x |
| 48 | Thomasville | 101 | 18,666 | $49,673 | $232,158 | 4.7x |
| 49 | Dacula | 101 | 7,444 | $100,821 | $448,400 | 4.4x |
| 50 | Savannah | 100 | 147,898 | $57,137 | $326,509 | 5.7x |
| 51 | Douglasville | 100 | 37,536 | $79,107 | $301,700 | 3.8x |
| 52 | McDonough | 100 | 30,947 | $75,343 | $334,349 | 4.4x |
| 53 | Villa Rica | 100 | 18,551 | $87,803 | $311,754 | 3.6x |
| 54 | Dallas | 100 | 14,714 | $75,545 | $354,268 | 4.7x |
| 55 | Locust Grove | 100 | 10,532 | $75,083 | $324,432 | 4.3x |
| 56 | Austell | 100 | 8,447 | $72,938 | $292,181 | 4.0x |
| 57 | Lawrenceville | 99 | 30,954 | $61,561 | $382,152 | 6.2x |
| 58 | Grovetown | 99 | 17,014 | $85,660 | $304,550 | 3.6x |
| 59 | Covington | 99 | 14,584 | $58,810 | $292,187 | 5.0x |
| 60 | Lovejoy | 99 | 11,508 | $71,612 | $279,096 | 3.9x |
| 61 | Hampton | 99 | 8,687 | $75,052 | $307,291 | 4.1x |
| 62 | Hapeville | 99 | 6,630 | $95,714 | $265,299 | 2.8x |
| 63 | East Point | 98 | 38,335 | $68,598 | $231,600 | 3.4x |
| 64 | Fairburn | 98 | 16,831 | $91,897 | $321,971 | 3.5x |
| 65 | Clarkston | 98 | 14,557 | $48,564 | $267,836 | 5.5x |
| 66 | Commerce | 98 | 8,013 | $60,961 | $334,904 | 5.5x |
| 67 | Bremen | 98 | 7,488 | $93,780 | $290,337 | 3.1x |
| 68 | Hiram | 98 | 5,231 | $85,119 | $312,225 | 3.7x |
| 69 | Union City | 97 | 27,728 | $49,549 | $231,233 | 4.7x |
| 70 | Carrollton | 97 | 27,392 | $54,379 | $285,669 | 5.3x |
| 71 | Winder | 97 | 19,437 | $63,779 | $338,264 | 5.3x |
| 72 | Conyers | 97 | 18,512 | $63,140 | $297,597 | 4.7x |
| 73 | Calhoun | 97 | 18,183 | $58,750 | $273,432 | 4.7x |
| 74 | Oakwood | 97 | 5,862 | $67,917 | $322,538 | 4.7x |
| 75 | Columbus | 96 | 203,711 | $58,073 | $173,152 | 3.0x |
| 76 | Garden City | 96 | 10,426 | $47,814 | $272,348 | 5.7x |
| 77 | Auburn | 96 | 8,711 | $77,034 | $365,247 | 4.7x |
| 78 | Warner Robins | 94 | 82,990 | $66,970 | $212,129 | 3.2x |
| 79 | Perry | 94 | 23,001 | $76,909 | $273,009 | 3.5x |
| 80 | Monroe | 94 | 15,648 | $44,656 | $371,278 | 8.3x |
| 81 | Centerville | 94 | 8,505 | $68,922 | $227,613 | 3.3x |
| 82 | Stone Mountain | 94 | 6,623 | $46,973 | $268,439 | 5.7x |
| 83 | Barnesville | 94 | 6,121 | $57,411 | $258,106 | 4.5x |
| 84 | Byron | 94 | 5,971 | $85,596 | $263,141 | 3.1x |
| 85 | Jackson | 94 | 5,741 | $46,191 | $283,113 | 6.1x |
| 86 | Social Circle | 94 | 5,217 | $88,591 | $361,857 | 4.1x |
| 87 | Valdosta | 93 | 55,252 | $45,925 | $210,105 | 4.6x |
| 88 | Rome | 93 | 38,189 | $54,435 | $229,355 | 4.2x |
| 89 | Hinesville | 93 | 35,679 | $60,028 | $237,454 | 4.0x |
| 90 | Dalton | 93 | 34,538 | $63,577 | $242,582 | 3.8x |
| 91 | LaGrange | 93 | 32,078 | $43,708 | $236,813 | 5.4x |
| 92 | Riverdale | 93 | 14,792 | $63,455 | $214,168 | 3.4x |
| 93 | Bainbridge | 93 | 14,404 | $45,422 | $172,159 | 3.8x |
| 94 | Temple | 93 | 5,901 | $91,180 | $284,500 | 3.1x |
| 95 | Milledgeville | 92 | 16,748 | $41,616 | $244,327 | 5.9x |
| 96 | Cairo | 92 | 10,055 | $40,920 | $178,784 | 4.4x |
| 97 | Glennville | 92 | 5,179 | $52,844 | $203,965 | 3.9x |
| 98 | Morrow | 91 | 6,364 | $73,693 | $216,943 | 2.9x |
| 99 | Rockmart | 91 | 5,204 | $56,828 | $254,776 | 4.5x |
| 100 | Statesboro | 90 | 34,149 | $44,737 | $276,367 | 6.2x |
Source: U.S. Census ACS 2020-2024, Zillow research. 131 places with more than 5,000 residents.
Summary
Summary: Taking A Chunk Out Of Your Paycheck In Georgia For 2026
Well, there you have it, the places in Georgia that have the highest cost of living, with Decatur ranking as the most expensive city in the Peach State.
The most expensive cities in Georgia are Decatur, Brookhaven, Milton, Alpharetta, Dunwoody, Sandy Springs, Johns Creek, Roswell, Dahlonega, and Peachtree City. Not sold on Georgia? Take the two-minute Find Your Place quiz and see which state actually fits you.
Questions and answers
Most Expensive Places In Georgia FAQs
What is the most expensive place to live in Georgia?
Decatur is the most expensive place to live in Georgia for 2026. The median home there runs $279,470, and it posts the highest cost of living of the 131 places we scored.
What are the 10 most expensive cities in Georgia?
The ten most expensive cities in Georgia are Decatur, Brookhaven, Milton, Alpharetta, Dunwoody, Sandy Springs, Johns Creek, Roswell, Dahlonega, and Peachtree City. We ranked all 131 places with more than 5,000 residents on home prices, incomes, and an overall cost of living index.
How expensive are homes in Decatur?
The median home value in Decatur is $279,470, versus $332,063 across Georgia as a whole. Across the ten most expensive cities, the median home runs $683,504.
What salary do you need to live in the most expensive parts of Georgia?
The median household income in the ten most expensive Georgia cities starts at $77,516, and in Decatur it is $139,397. If your paycheck is closer to the statewide median of $77,353, these places will squeeze your budget.
What is the cheapest place to live in Georgia?
Fort Valley is the cheapest of the 131 Georgia places we ranked on cost of living. It sits at the very bottom of the same index that put Decatur on top.


