
Most Hispanic/Latino cities in Illinois research summary. We used Saturday Night Science to analyze Illinois’s most recent Census data to determine the most Hispanic/Latino cities based on the percentage of Hispanic/Latino residents. Here are the results of our analysis:
-
The most Hispanic/Latino city in Illinois is Cicero, based on the most recent Census data.
-
Cicero is 88.85% Hispanic/Latino.
-
The least Hispanic/Latino city in Illinois is Salem.
-
Salem is 0.25% Hispanic/Latino.
-
Illinois is 18.5% Hispanic/Latino.
-
Illinois is the 10th most Hispanic/Latino state in the United States.
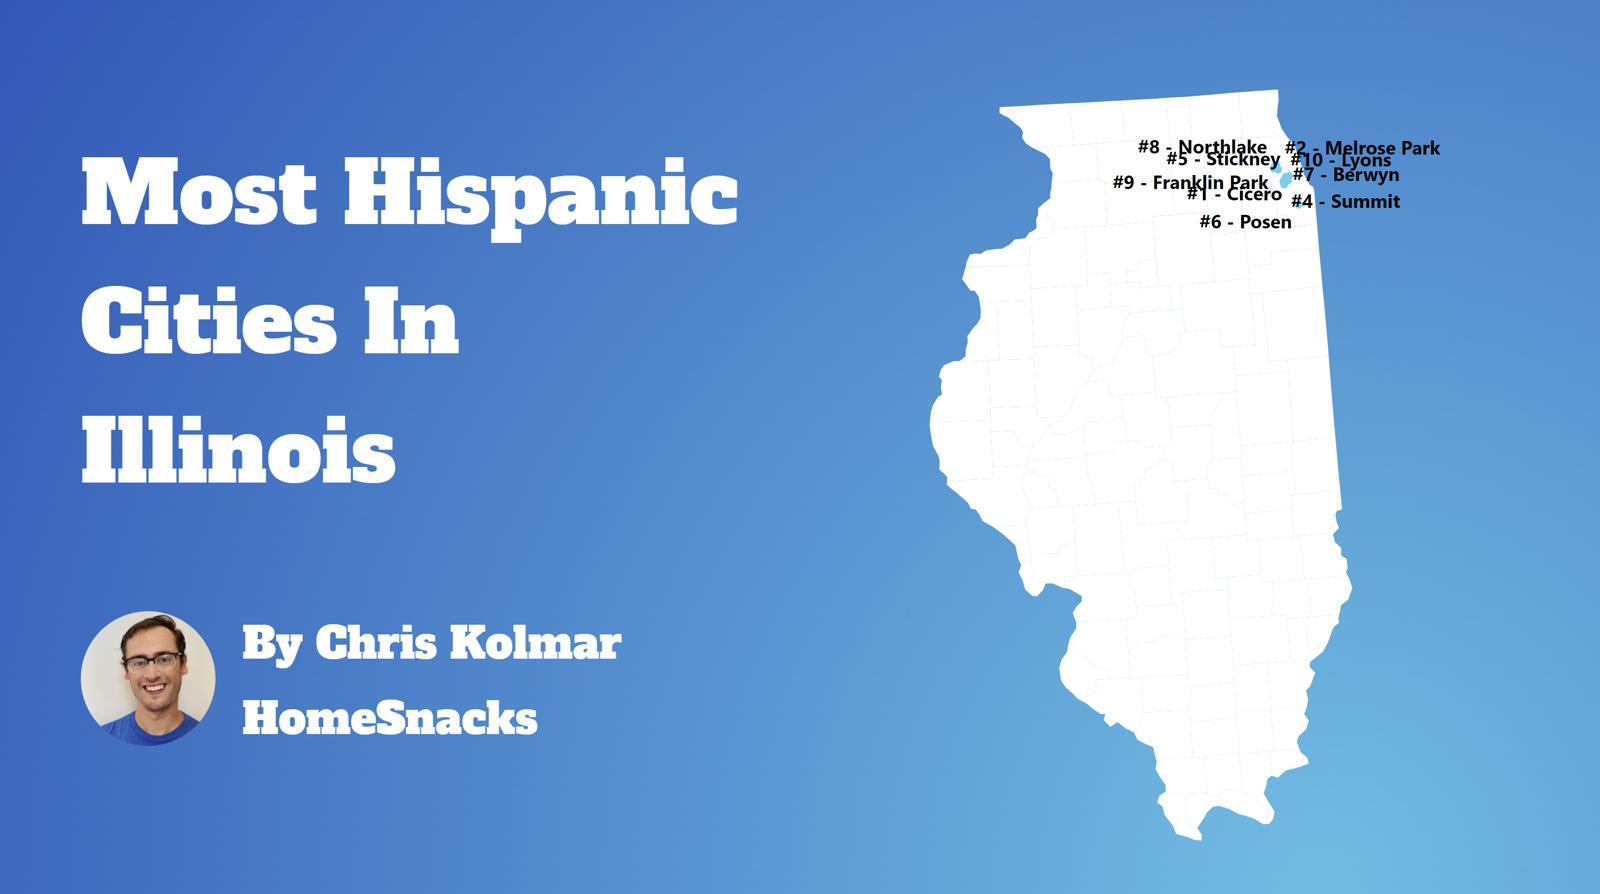
Table Of Contents: Top Ten | Methodology | Summary | Table
The 10 Cities In Illinois With The Largest Hispanic Population For 2025
What’s the city in Illinois with the largest Hispanic/Latino population? Cicero took the number one overall spot for the largest Hispanic population in Illinois for 2025.
Continue below to see how we crunched the numbers and how your town ranked.
To see where Illinois ranked as a state on diversity, we have a ranking of the most diverse states in America.
And if you already knew these places were Hispanic, check out the best places to live in Illinois or the safest places in Illinois.

/10
Population: 83,223
# Of Hispanic/Latino Residents: 73,941
% Hispanic/Latino: 88.85%
More on Cicero: Data

/10
Population: 24,513
# Of Hispanic/Latino Residents: 19,068
% Hispanic/Latino: 77.79%
More on Melrose Park: Data

/10
Population: 7,631
# Of Hispanic/Latino Residents: 5,814
% Hispanic/Latino: 76.19%
More on Park City: Data

/10
Population: 10,896
# Of Hispanic/Latino Residents: 8,268
% Hispanic/Latino: 75.88%
More on Summit: Data

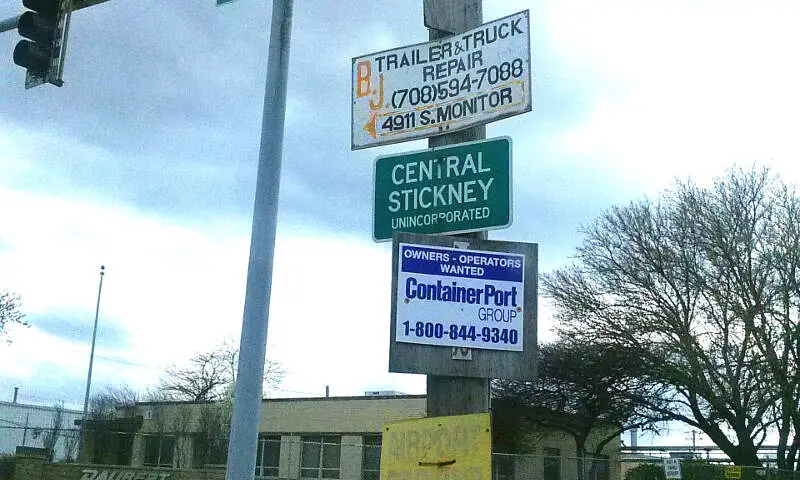
/10
Population: 6,957
# Of Hispanic/Latino Residents: 4,552
% Hispanic/Latino: 65.43%
More on Stickney: Data

/10
Population: 12,547
# Of Hispanic/Latino Residents: 7,710
% Hispanic/Latino: 61.45%
More on Northlake: Data

/10
Population: 5,331
# Of Hispanic/Latino Residents: 3,266
% Hispanic/Latino: 61.26%
More on Posen: Data

/10
Population: 55,888
# Of Hispanic/Latino Residents: 33,666
% Hispanic/Latino: 60.24%
More on Berwyn: Data

/10
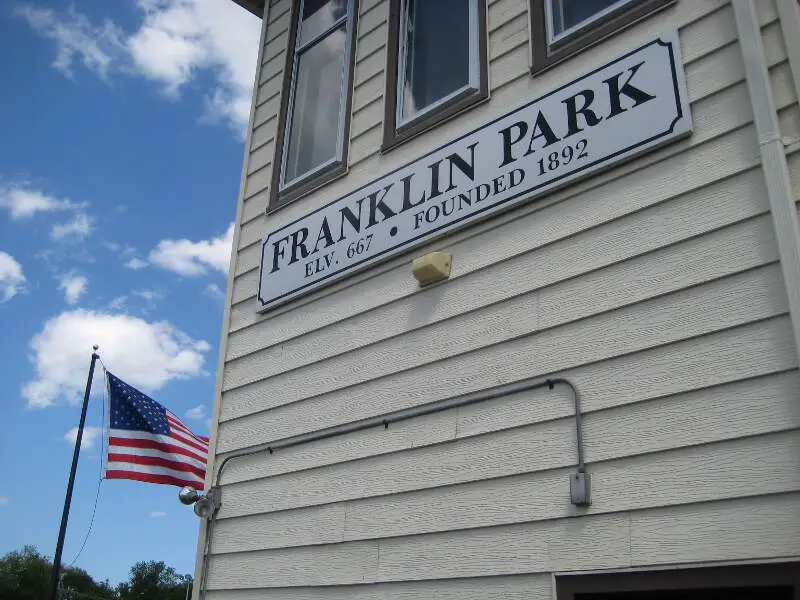
Population: 18,233
# Of Hispanic/Latino Residents: 10,671
% Hispanic/Latino: 58.53%
More on Franklin Park: Data

/10
Population: 88,919
# Of Hispanic/Latino Residents: 50,686
% Hispanic/Latino: 57.0%
More on Waukegan: Data
Methodology: How We Determined The Cities In Illinois With The Largest Hispanic Population For 2025
We used Saturday Night Science to compare data on race from the US Census for every city in Illinois.
Illinois’s most recently available data comes from the 2019-2023 American Community Survey.
Specifically, we looked at table B03002: Hispanic OR LATINO ORIGIN BY RACE. Here are the category names as defined by the Census:
- Hispanic or Latino
- White alone*
- Black or African American alone*
- American Indian and Alaska Native alone*
- Asian alone*
- Native Hawaiian and Other Pacific Islander alone*
- Some other race alone*
- Two or more races*
Our particular column of interest here was the number of people who identified as Hispanic or Latino.
We limited our analysis to places in Illinois with a population greater than 5,000 people. That left us with 324 cities.
We then calculated the percentage of Hispanic or Latino residents in each Illinois city. The percentages ranked from 88.8% to 0.2%.
Finally, we ranked each city based on the percentage of the Hispanic or Latino population, with a higher score being more Hispanic or Latino than a lower score. Cicero was the most Hispanic or Latino, while Salem was the least Hispanic or Latino city.
We updated this article for 2025. This article represents our tenth time ranking the cities in Illinois with the largest Hispanic/Latino population.
Read on for more information on how the cities in Illinois ranked by population of Hispanic or Latino residents or, for a more general take on diversity in America, head over to our ranking of the most diverse cities in America.
Summary: Hispanic or Latino Populations Across Illinois
According to the most recent data, this is an accurate list if you’re looking for a breakdown of Latino populations for each place across Illinois.
The most Hispanic/Latino cities in Illinois are Cicero, Melrose Park, Park City, Summit, Stickney, Northlake, Posen, Berwyn, Franklin Park, and Waukegan.
If you’re curious enough, here are the least Hispanic or Latino places in Illinois:
- Salem
- Taylorville
- Litchfield
For more Illinois reading, check out:
- Best Counties To Live In Illinois
- Best Places To Raise A Family In Illinois
- Richest Cities In Illinois
Most Hispanic Cities In Illinois
| Rank | City | Population | Hispanic Pop. | % Hispanic |
|---|---|---|---|---|
| 1 | Cicero | 83,223 | 73,941 | 88.85% |
| 2 | Melrose Park | 24,513 | 19,068 | 77.79% |
| 3 | Park City | 7,631 | 5,814 | 76.19% |
| 4 | Summit | 10,896 | 8,268 | 75.88% |
| 5 | Stickney | 6,957 | 4,552 | 65.43% |
| 6 | Northlake | 12,547 | 7,710 | 61.45% |
| 7 | Posen | 5,331 | 3,266 | 61.26% |
| 8 | Berwyn | 55,888 | 33,666 | 60.24% |
| 9 | Franklin Park | 18,233 | 10,671 | 58.53% |
| 10 | Waukegan | 88,919 | 50,686 | 57.0% |
| 11 | Carpentersville | 37,544 | 21,031 | 56.02% |
| 12 | Round Lake Beach | 27,081 | 14,701 | 54.29% |
| 13 | Harvard | 9,875 | 5,327 | 53.94% |
| 14 | Beach Park | 13,988 | 7,025 | 50.22% |
| 15 | Bensenville | 18,576 | 9,239 | 49.74% |
| 16 | Burbank | 28,822 | 14,322 | 49.69% |
| 17 | Elgin | 114,106 | 55,251 | 48.42% |
| 18 | Lyons | 10,391 | 5,027 | 48.38% |
| 19 | West Chicago | 25,434 | 12,218 | 48.04% |
| 20 | Round Lake Park | 7,833 | 3,509 | 44.8% |
| 21 | Berkeley | 5,222 | 2,299 | 44.03% |
| 22 | Addison | 35,470 | 15,524 | 43.77% |
| 23 | Blue Island | 23,416 | 10,082 | 43.06% |
| 24 | Aurora | 179,867 | 76,910 | 42.76% |
| 25 | Zion | 24,466 | 10,209 | 41.73% |
| 26 | Highwood | 5,243 | 2,127 | 40.57% |
| 27 | Beardstown | 6,047 | 2,373 | 39.24% |
| 28 | Hanover Park | 36,850 | 14,356 | 38.96% |
| 29 | Streamwood | 39,055 | 15,131 | 38.74% |
| 30 | North Chicago | 30,772 | 11,888 | 38.63% |
| 31 | Elmwood Park | 23,982 | 9,139 | 38.11% |
| 32 | Chicago Heights | 26,938 | 10,017 | 37.19% |
| 33 | Belvidere | 24,510 | 9,087 | 37.07% |
| 34 | Plano | 11,626 | 4,306 | 37.04% |
| 35 | River Grove | 10,482 | 3,829 | 36.53% |
| 36 | Mundelein | 31,632 | 11,541 | 36.49% |
| 37 | Romeoville | 40,996 | 14,636 | 35.7% |
| 38 | Prospect Heights | 15,681 | 5,564 | 35.48% |
| 39 | Joliet | 149,785 | 51,970 | 34.7% |
| 40 | Harvey | 19,831 | 6,860 | 34.59% |
| 41 | Maywood | 23,173 | 7,747 | 33.43% |
| 42 | Hillside | 8,133 | 2,710 | 33.32% |
| 43 | Midlothian | 14,024 | 4,606 | 32.84% |
| 44 | Round Lake | 18,588 | 5,976 | 32.15% |
| 45 | Wheeling | 38,495 | 12,306 | 31.97% |
| 46 | Glendale Heights | 32,864 | 10,330 | 31.43% |
| 47 | Bridgeview | 16,721 | 5,172 | 30.93% |
| 48 | Montgomery | 21,205 | 6,415 | 30.25% |
| 49 | Schiller Park | 11,454 | 3,431 | 29.95% |
| 50 | Chicago | 2,707,648 | 801,852 | 29.61% |
| 51 | North Riverside | 7,495 | 2,203 | 29.39% |
| 52 | Riverside | 9,079 | 2,667 | 29.38% |
| 53 | Rolling Meadows | 23,981 | 7,034 | 29.33% |
| 54 | Wood Dale | 13,926 | 3,975 | 28.54% |
| 55 | Mendota | 6,915 | 1,960 | 28.34% |
| 56 | Bolingbrook | 73,813 | 20,845 | 28.24% |
| 57 | Alsip | 18,650 | 5,103 | 27.36% |
| 58 | Villa Park | 22,456 | 5,798 | 25.82% |
| 59 | Sterling | 14,670 | 3,782 | 25.78% |
| 60 | Genoa | 5,685 | 1,450 | 25.51% |
| 61 | Crest Hill | 19,754 | 4,793 | 24.26% |
| 62 | Rochelle | 9,477 | 2,296 | 24.23% |
| 63 | Kankakee | 24,384 | 5,849 | 23.99% |
| 64 | Oak Lawn | 57,098 | 13,560 | 23.75% |
| 65 | Warrenville | 14,232 | 3,344 | 23.5% |
| 66 | Bellwood | 18,373 | 4,276 | 23.27% |
| 67 | Des Plaines | 59,408 | 13,812 | 23.25% |
| 68 | Rantoul | 12,515 | 2,809 | 22.45% |
| 69 | Steger | 9,449 | 2,102 | 22.25% |
| 70 | Woodstock | 26,316 | 5,851 | 22.23% |
| 71 | Rock Falls | 8,683 | 1,908 | 21.97% |
| 72 | Westchester | 16,524 | 3,518 | 21.29% |
| 73 | Broadview | 7,898 | 1,678 | 21.25% |
| 74 | Worth | 10,731 | 2,254 | 21.0% |
| 75 | Island Lake | 8,023 | 1,685 | 21.0% |
| 76 | South Elgin | 23,984 | 5,033 | 20.98% |
| 77 | Rockford | 147,649 | 30,387 | 20.58% |
| 78 | Brookfield | 19,235 | 3,925 | 20.41% |
| 79 | Harwood Heights | 8,851 | 1,790 | 20.22% |
| 80 | Lake In The Hills | 28,853 | 5,791 | 20.07% |
| 81 | Spring Valley | 5,508 | 1,098 | 19.93% |
| 82 | Palatine | 66,548 | 12,835 | 19.29% |
| 83 | East Moline | 20,837 | 4,005 | 19.22% |
| 84 | Lasalle | 9,471 | 1,814 | 19.15% |
| 85 | Countryside | 6,294 | 1,203 | 19.11% |
| 86 | Hoffman Estates | 51,186 | 9,749 | 19.05% |
| 87 | Monmouth | 8,794 | 1,652 | 18.79% |
| 88 | Yorkville | 22,350 | 4,185 | 18.72% |
| 89 | Evergreen Park | 19,498 | 3,607 | 18.5% |
| 90 | Moline | 42,235 | 7,761 | 18.38% |
| 91 | Dekalb | 40,464 | 7,426 | 18.35% |
| 92 | Carol Stream | 39,427 | 7,234 | 18.35% |
| 93 | Wauconda | 14,010 | 2,540 | 18.13% |
| 94 | Oak Forest | 26,888 | 4,835 | 17.98% |
| 95 | Gilberts | 8,389 | 1,501 | 17.89% |
| 96 | North Aurora | 18,375 | 3,207 | 17.45% |
| 97 | Lansing | 28,415 | 4,947 | 17.41% |
| 98 | Chicago Ridge | 14,147 | 2,417 | 17.08% |
| 99 | Mchenry | 27,774 | 4,738 | 17.06% |
| 100 | Pontoon Beach | 6,131 | 1,019 | 16.62% |