Most Hispanic/Latino cities in Kentucky research summary. We used Saturday Night Science to analyze Kentucky’s most recent Census data to determine the most Hispanic/Latino cities based on the percentage of Hispanic/Latino residents. Here are the results of our analysis:
-
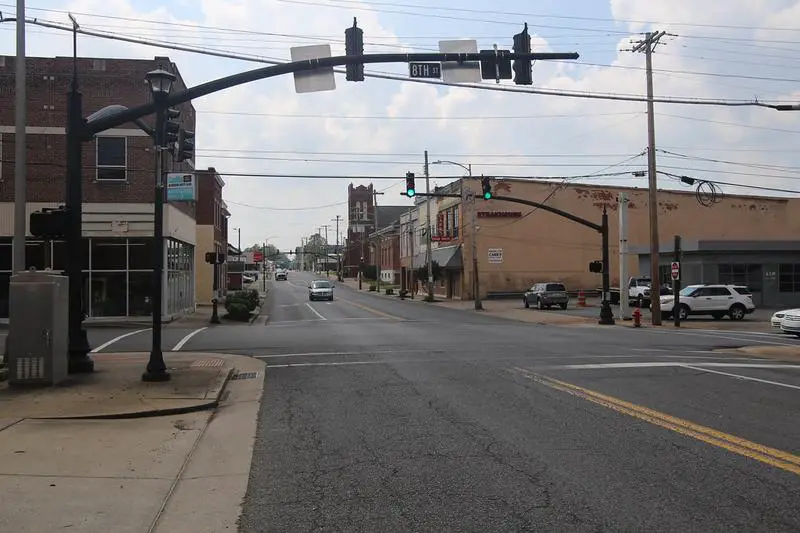
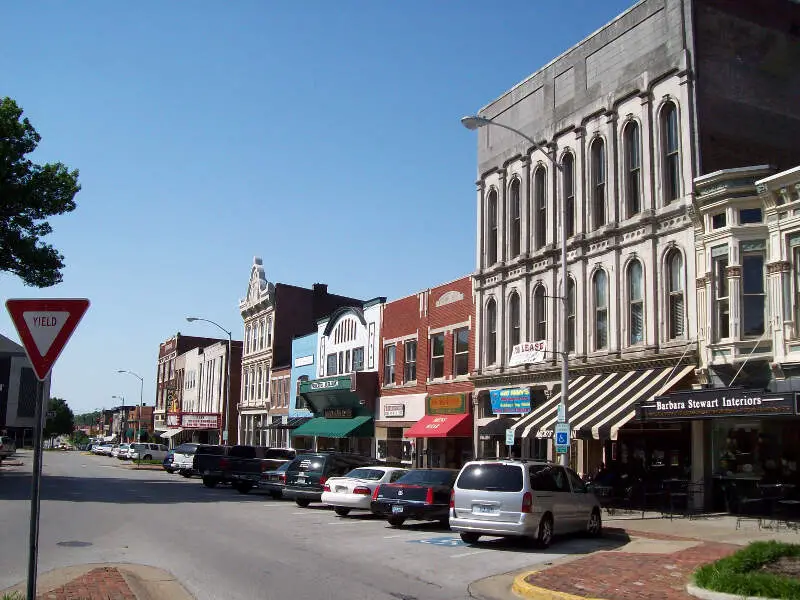
The most Hispanic/Latino city in Kentucky is Shelbyville, based on the most recent Census data.
-
Shelbyville is 19.29% Hispanic/Latino.
-
The least Hispanic/Latino city in Kentucky is Edgewood.
-
Edgewood is 0.54% Hispanic/Latino.
-
Kentucky is 5.0% Hispanic/Latino.
-
Kentucky is the 4most Hispanic/Latino state in the United States.
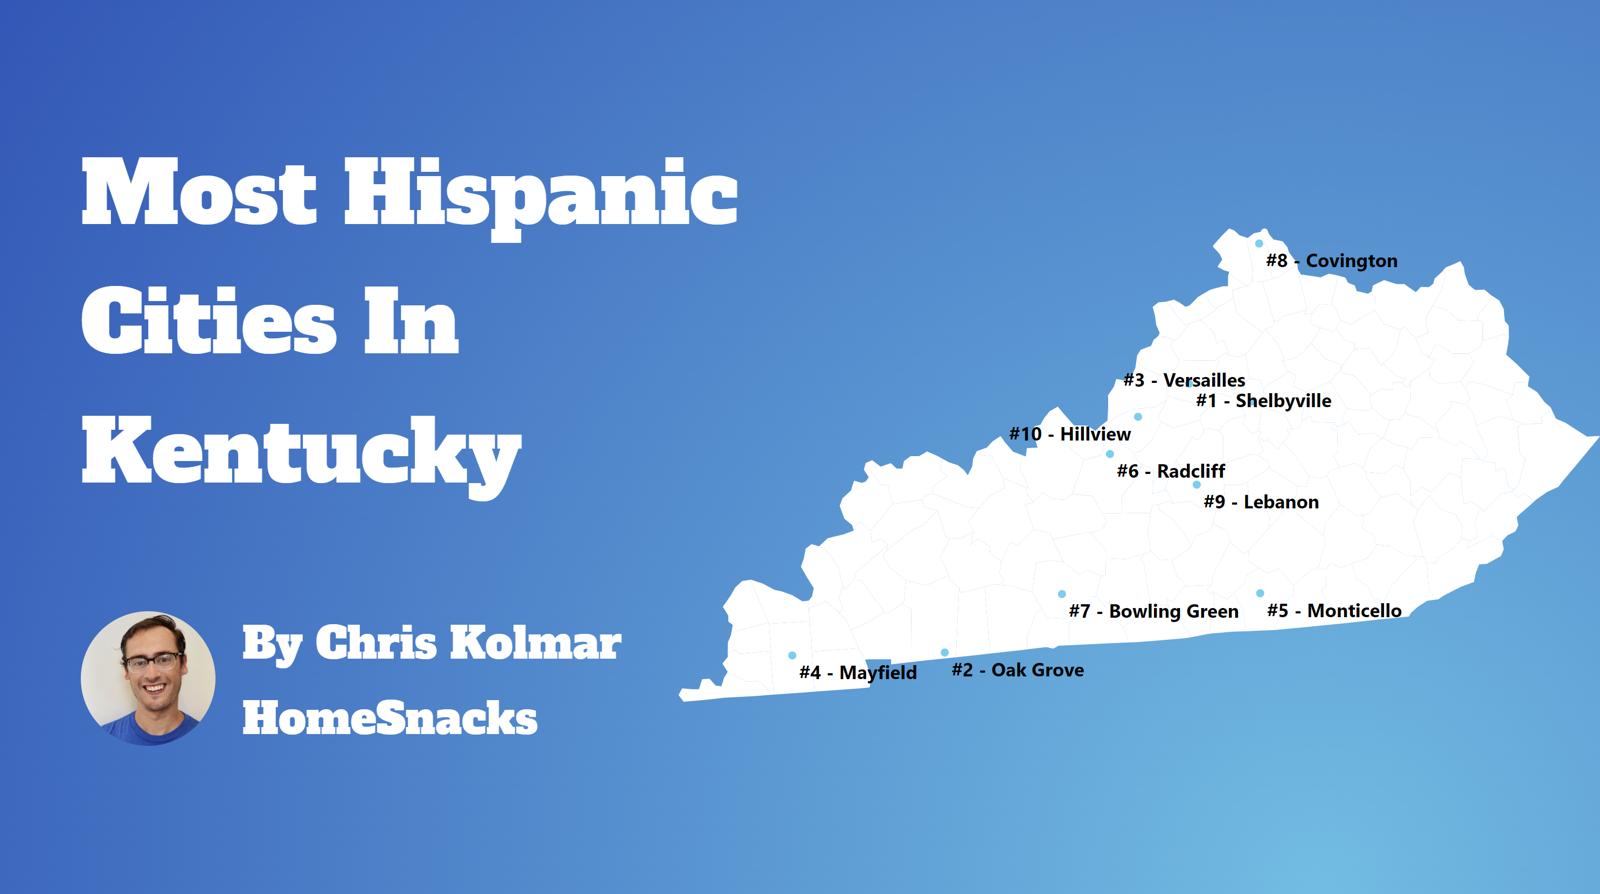
Table Of Contents: Top Ten | Methodology | Summary | Table
The 10 Cities In Kentucky With The Largest Hispanic Population For 2026
- Shelbyville
- Mayfield
- Oak Grove
- Monticello
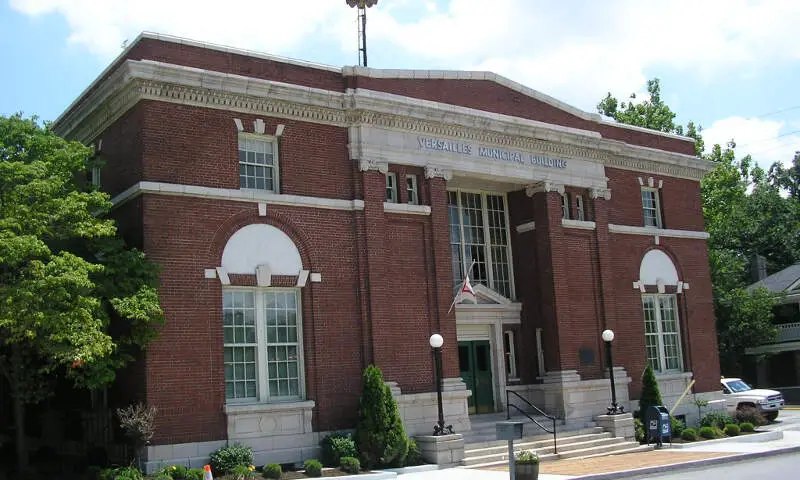
- Versailles
- Hillview
- Bowling Green
- Lebanon
- Radcliff
- Lexington-Fayette urban county
What’s the city in Kentucky with the largest Hispanic/Latino population? Shelbyville took the number one overall spot for the largest Hispanic population in Kentucky for 2026.
Continue below to see how we crunched the numbers and how your town ranked.
To see where Kentucky ranked as a state on diversity, we have a ranking of the most diverse states in America.
And if you already knew these places were Hispanic, check out the best places to live in Kentucky or the safest places in Kentucky.

/10
Population: 17,668
# Of Hispanic/Latino Residents: 3,409
% Hispanic/Latino: 19.29%
More on Shelbyville: Data | Crime | Cost Of Living | Movers

/10
Population: 9,868
# Of Hispanic/Latino Residents: 1,721
% Hispanic/Latino: 17.44%
More on Mayfield: Data | Crime | Cost Of Living | Movers

/10
Population: 7,962
# Of Hispanic/Latino Residents: 1,146
% Hispanic/Latino: 14.39%
More on Oak Grove: Data | Crime | Cost Of Living | Movers

/10
Population: 5,753
# Of Hispanic/Latino Residents: 696
% Hispanic/Latino: 12.1%
More on Monticello: Data | Crime | Cost Of Living | Movers

/10
Population: 10,492
# Of Hispanic/Latino Residents: 1,243
% Hispanic/Latino: 11.85%
More on Versailles: Data | Crime | Cost Of Living | Movers

/10
Population: 8,797
# Of Hispanic/Latino Residents: 1,011
% Hispanic/Latino: 11.49%
More on Hillview: Data | Crime | Cost Of Living | Movers

/10
Population: 75,388
# Of Hispanic/Latino Residents: 7,956
% Hispanic/Latino: 10.55%
More on Bowling Green: Data | Crime | Cost Of Living | Movers

/10
Population: 6,430
# Of Hispanic/Latino Residents: 623
% Hispanic/Latino: 9.69%
More on Lebanon: Data | Crime | Cost Of Living | Movers

/10
Population: 22,864
# Of Hispanic/Latino Residents: 2,214
% Hispanic/Latino: 9.68%
More on Radcliff: Data | Crime | Cost Of Living | Movers
10. Lexington-Fayette Urban County
/10
Population: 323,725
# Of Hispanic/Latino Residents: 30,824
% Hispanic/Latino: 9.52%
More on Lexington-Fayette Urban County: Movers
Methodology: How We Determined The Cities In Kentucky With The Largest Hispanic Population For 2026
We used Saturday Night Science to compare data on race from the US Census for every city in Kentucky.
Kentucky’s most recently available data comes from the 2020-2024 American Community Survey.
Specifically, we looked at table B03002: Hispanic OR LATINO ORIGIN BY RACE. Here are the category names as defined by the Census:
- Hispanic or Latino
- White alone*
- Black or African American alone*
- American Indian and Alaska Native alone*
- Asian alone*
- Native Hawaiian and Other Pacific Islander alone*
- Some other race alone*
- Two or more races*
Our particular column of interest here was the number of people who identified as Hispanic or Latino.
We limited our analysis to places in Kentucky with a population greater than 5,000 people. That left us with 75 cities.
We then calculated the percentage of Hispanic or Latino residents in each Kentucky city. The percentages ranked from 19.3% to 0.5%.
Finally, we ranked each city based on the percentage of the Hispanic or Latino population, with a higher score being more Hispanic or Latino than a lower score. Shelbyville was the most Hispanic or Latino, while Edgewood was the least Hispanic or Latino city.
We updated this article for 2026. This article represents our eleventh time ranking the cities in Kentucky with the largest Hispanic/Latino population.
Read on for more information on how the cities in Kentucky ranked by population of Hispanic or Latino residents or, for a more general take on diversity in America, head over to our ranking of the most diverse cities in America.
Summary: Hispanic or Latino Populations Across Kentucky
According to the most recent data, this is an accurate list if you’re looking for a breakdown of Latino populations for each place across Kentucky.
The most Hispanic/Latino cities in Kentucky are Shelbyville, Mayfield, Oak Grove, Monticello, Versailles, Hillview, Bowling Green, Lebanon, Radcliff, and Lexington-Fayette urban county.
If you’re curious enough, here are the least Hispanic or Latino places in Kentucky:
- Edgewood
- Leitchfield
- Middlesborough
For more Kentucky reading, check out:
Most Hispanic Cities In Kentucky
| Rank | City | Population | Hispanic Pop. | % Hispanic |
|---|---|---|---|---|
| 1 | Shelbyville | 17,668 | 3,409 | 19.29% |
| 2 | Mayfield | 9,868 | 1,721 | 17.44% |
| 3 | Oak Grove | 7,962 | 1,146 | 14.39% |
| 4 | Monticello | 5,753 | 696 | 12.1% |
| 5 | Versailles | 10,492 | 1,243 | 11.85% |
| 6 | Hillview | 8,797 | 1,011 | 11.49% |
| 7 | Bowling Green | 75,388 | 7,956 | 10.55% |
| 8 | Lebanon | 6,430 | 623 | 9.69% |
| 9 | Radcliff | 22,864 | 2,214 | 9.68% |
| 10 | Lexington-Fayette Urban County | 323,725 | 30,824 | 9.52% |
| 11 | Louisville/jefferson County Metro Government (Balance) | 631,818 | 59,943 | 9.49% |
| 12 | Florence | 32,803 | 3,025 | 9.22% |
| 13 | Covington | 41,110 | 3,582 | 8.71% |
| 14 | La Grange | 10,311 | 816 | 7.91% |
| 15 | Glasgow | 15,197 | 1,143 | 7.52% |
| 16 | Middletown | 9,763 | 724 | 7.42% |
| 17 | Georgetown | 39,117 | 2,736 | 6.99% |
| 18 | Newport | 13,967 | 922 | 6.6% |
| 19 | Harrodsburg | 9,313 | 607 | 6.52% |
| 20 | Frankfort | 28,503 | 1,837 | 6.44% |
| 21 | Elsmere | 9,205 | 577 | 6.27% |
| 22 | Danville | 17,327 | 1,074 | 6.2% |
| 23 | Paris | 10,160 | 629 | 6.19% |
| 24 | Jeffersontown | 29,199 | 1,782 | 6.1% |
| 25 | Bardstown | 13,804 | 829 | 6.01% |
| 26 | Russellville | 7,316 | 438 | 5.99% |
| 27 | Fort Wright | 5,887 | 350 | 5.95% |
| 28 | Somerset | 12,216 | 722 | 5.91% |
| 29 | Williamsburg | 5,270 | 304 | 5.77% |
| 30 | Owensboro | 60,302 | 3,393 | 5.63% |
| 31 | Villa Hills | 7,480 | 419 | 5.6% |
| 32 | Elizabethtown | 32,576 | 1,815 | 5.57% |
| 33 | Nicholasville | 32,197 | 1,793 | 5.57% |
| 34 | Berea | 15,786 | 820 | 5.19% |
| 35 | Fort Mitchell | 8,713 | 447 | 5.13% |
| 36 | Henderson | 27,852 | 1,413 | 5.07% |
| 37 | Hopkinsville | 30,906 | 1,553 | 5.02% |
| 38 | Madisonville | 19,515 | 942 | 4.83% |
| 39 | Erlanger | 19,875 | 954 | 4.8% |
| 40 | Winchester | 19,213 | 848 | 4.41% |
| 41 | Richmond | 37,111 | 1,565 | 4.22% |
| 42 | Bellevue | 5,636 | 229 | 4.06% |
| 43 | Lyndon | 11,030 | 427 | 3.87% |
| 44 | Maysville | 8,737 | 327 | 3.74% |
| 45 | Franklin | 10,360 | 364 | 3.51% |
| 46 | St. Matthews | 17,577 | 615 | 3.5% |
| 47 | Central City | 5,707 | 193 | 3.38% |
| 48 | Murray | 18,080 | 609 | 3.37% |
| 49 | Mount Washington | 18,480 | 568 | 3.07% |
| 50 | Paducah | 26,845 | 820 | 3.05% |
| 51 | Union | 7,642 | 229 | 3.0% |
| 52 | Douglass Hills | 5,474 | 163 | 2.98% |
| 53 | Fort Thomas | 17,169 | 507 | 2.95% |
| 54 | Campbellsville | 11,622 | 340 | 2.93% |
| 55 | Dayton | 5,743 | 159 | 2.77% |
| 56 | Shively | 15,638 | 417 | 2.67% |
| 57 | Ashland | 21,295 | 566 | 2.66% |
| 58 | Lawrenceburg | 11,943 | 317 | 2.65% |
| 59 | London | 7,561 | 193 | 2.55% |
| 60 | Independence | 29,392 | 736 | 2.5% |
| 61 | Shepherdsville | 14,533 | 351 | 2.42% |
| 62 | Mount Sterling | 7,551 | 177 | 2.34% |
| 63 | Morehead | 6,870 | 153 | 2.23% |
| 64 | Highland Heights | 6,444 | 138 | 2.14% |
| 65 | Cynthiana | 6,458 | 137 | 2.12% |
| 66 | Pikeville | 7,490 | 139 | 1.86% |
| 67 | Taylor Mill | 6,937 | 109 | 1.57% |
| 68 | Flatwoods | 7,269 | 112 | 1.54% |
| 69 | Corbin | 8,246 | 104 | 1.26% |
| 70 | Princeton | 6,241 | 78 | 1.25% |
| 71 | Cold Spring | 6,341 | 71 | 1.12% |
| 72 | Alexandria | 10,562 | 118 | 1.12% |
| 73 | Middlesborough | 9,123 | 95 | 1.04% |
| 74 | Leitchfield | 6,819 | 60 | 0.88% |
| 75 | Edgewood | 8,447 | 46 | 0.54% |