Most Hispanic/Latino cities in the United States research summary. We used Saturday Night Science to research the cities with the highest percentage of Hispanic/Latino residents for 2026. The data comes from the American Community Survey 2020-2024 vintage, which breaks down race by origin.
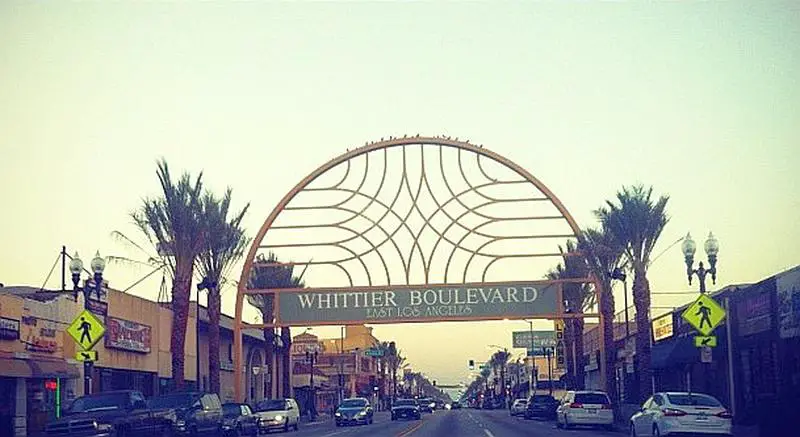
The city with the highest percentage of Hispanic Americans is East Los Angeles. 95.52% of people in East Los Angeles are Hispanic. The city with the lowest percentage is Jackson, MS, where 2.38% of people are Hispanic.
The city with the most Hispanic Americans is New York, NY, with 2,420,122 Hispanic residents. The United States has 64,759,370 Hispanic Americans and is 19.34% Hispanic.
100.0% Hispanic
Data | Movers
100.0% Hispanic
Data | Movers
100.0% Hispanic
Data | Movers
100.0% Hispanic
Data | Movers
100.0% Hispanic
Data | Movers
100.0% Hispanic
Data | Movers
100.0% Hispanic
Data | Movers
100.0% Hispanic
Data | Movers
100.0% Hispanic
Data | Movers
100.0% Hispanic
Data | Movers
The receipts
Compare the top ten
Pick a metric. The bars rescale. The red line is the United States’s statewide median.
On the map
Where the most Hispanic cities in America are
Saturday Night Science
How We Determined The Most Hispanic Large Cities In The US
When we analyze the demographics of a city, we simply look at statistics. In particular, we use Saturday Night Science to compare the recently released 2020-2024 American Community Survey for a detailed breakdown of race by city.
Specifically, we looked at table B03002, which has the breakdown of people by Hispanic/Latino and race. Limiting our analysis to only cities greater than 100,000 people, we looked at the percentage of the population of each city that identified as Hispanic.
We then ranked each city from 1 to 270 in terms of that percentage, with the city having the highest overall percentage being named the “City In America with the Largest Hispanic American population” — East Los Angeles.
We updated this article for 2026. This article is our eleventh time ranking the cities in America with the highest Hispanic population.
The full list
Most Hispanic Cities In The United States For 2026
Click any column to sort. Search by city name.
| Rank | City | Population | Hispanic Population | % Hispanic |
|---|---|---|---|---|
| 1 | East Los Angeles, CA | 111,647 | 106,643 | 100.0% |
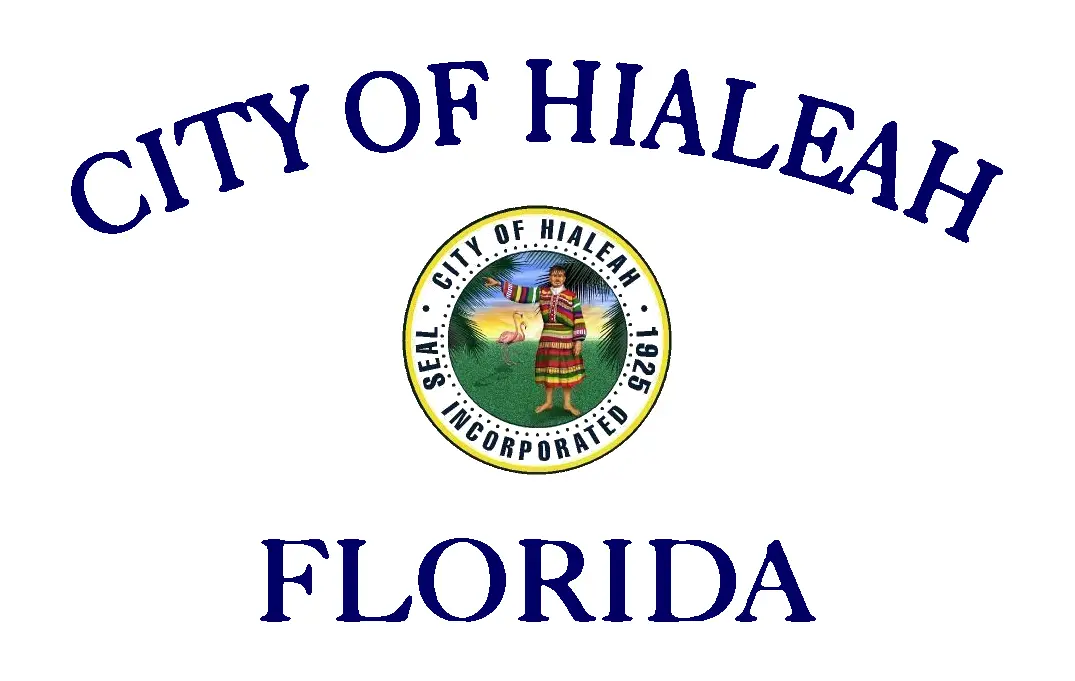
| 2 | Hialeah, FL | 226,165 | 215,133 | 100.0% |
| 3 | Laredo, TX | 257,619 | 244,911 | 100.0% |
| 4 | Brownsville, TX | 189,177 | 177,847 | 100.0% |
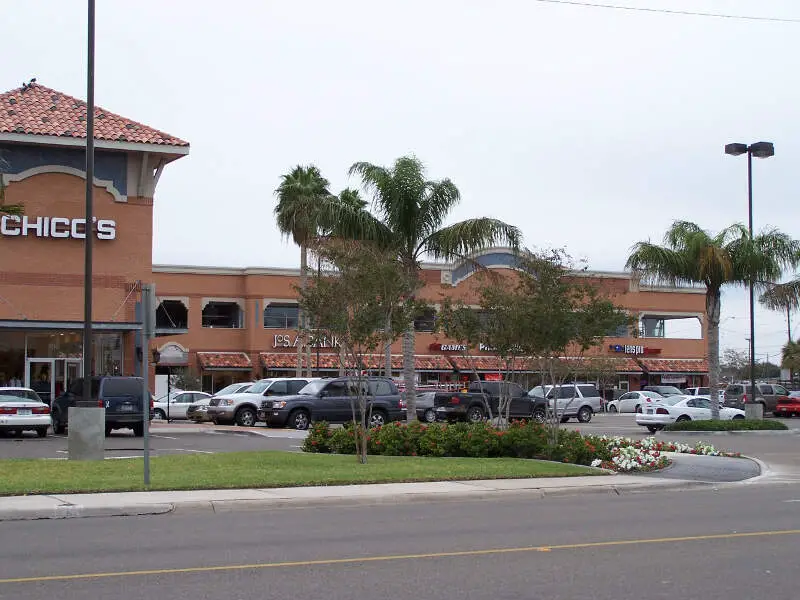
| 5 | Mcallen, TX | 145,385 | 126,523 | 100.0% |
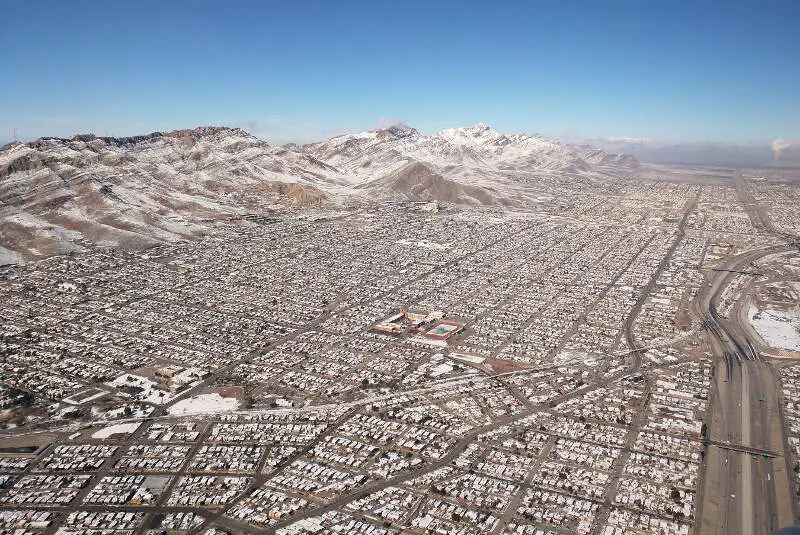
| 6 | El Paso, TX | 680,130 | 552,274 | 100.0% |
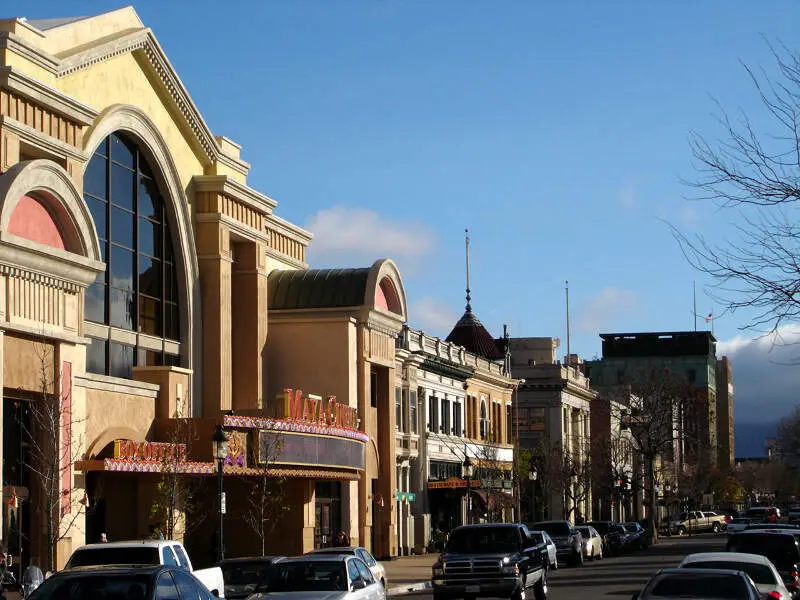
| 7 | Salinas, CA | 161,761 | 130,828 | 100.0% |
| 8 | Oxnard, CA | 200,928 | 154,996 | 100.0% |
| 9 | Santa Ana, CA | 312,534 | 239,503 | 100.0% |
| 10 | Downey, CA | 110,939 | 83,493 | 100.0% |
| 11 | Pomona, CA | 147,943 | 106,153 | 100.0% |
| 12 | Miami, FL | 459,745 | 328,679 | 100.0% |
| 13 | Pasadena, TX | 149,433 | 105,892 | 100.0% |
| 14 | San Bernardino, CA | 222,724 | 156,369 | 100.0% |
| 15 | Ontario, CA | 180,547 | 123,800 | 100.0% |
| 16 | Fontana, CA | 214,169 | 144,733 | 100.0% |
| 17 | Elizabeth, NJ | 137,302 | 92,543 | 100.0% |
| 18 | El Monte, CA | 106,109 | 71,253 | 100.0% |
| 19 | San Antonio, TX | 1,479,835 | 955,906 | 100.0% |
| 20 | Paterson, NJ | 158,735 | 102,436 | 100.0% |
| 21 | Palmdale, CA | 164,634 | 104,593 | 100.0% |
| 22 | Corpus Christi, TX | 317,419 | 196,942 | 100.0% |
| 23 | Moreno Valley, CA | 211,666 | 130,997 | 100.0% |
| 24 | Chula Vista, CA | 276,375 | 168,934 | 100.0% |
| 25 | Victorville, CA | 137,627 | 80,734 | 100.0% |
| 26 | Allentown, PA | 125,976 | 70,952 | 100.0% |
| 27 | Sunrise Manor, NV | 200,218 | 111,708 | 100.0% |
| 28 | Riverside, CA | 319,069 | 177,534 | 100.0% |
| 29 | Bakersfield, CA | 411,986 | 225,254 | 100.0% |
| 30 | West Covina, CA | 107,037 | 56,967 | 100.0% |
| 31 | Anaheim, CA | 344,521 | 183,273 | 100.0% |
| 32 | Visalia, CA | 143,939 | 76,422 | 100.0% |
| 33 | Escondido, CA | 149,668 | 78,292 | 100.0% |
| 34 | Fresno, CA | 545,970 | 277,910 | 100.0% |
| 35 | Pembroke Pines, FL | 173,194 | 86,567 | 0.0% |
| 36 | Elgin, IL | 114,934 | 55,973 | 0.0% |
| 37 | Springfield, MA | 154,749 | 75,190 | 0.0% |
| 38 | Inglewood, CA | 104,569 | 50,769 | 0.0% |
| 39 | Pueblo, CO | 111,561 | 53,885 | 0.0% |
| 40 | Lancaster, CA | 169,169 | 81,512 | 0.0% |
| 41 | Corona, CA | 159,670 | 76,775 | 0.0% |
| 42 | Albuquerque, NM | 562,218 | 268,412 | 0.0% |
| 43 | Los Angeles, CA | 3,857,263 | 1,820,397 | 0.0% |
| 44 | Grand Prairie, TX | 201,883 | 94,084 | 0.0% |
| 45 | Midland, TX | 136,640 | 62,712 | 0.0% |
| 46 | Garland, TX | 246,844 | 112,837 | 0.0% |
| 47 | Stockton, CA | 322,326 | 147,120 | 0.0% |
| 48 | Richmond, CA | 115,505 | 52,516 | 0.0% |
| 49 | Modesto, CA | 219,215 | 99,605 | 0.0% |
| 50 | Providence, RI | 191,767 | 86,835 | 0.0% |
| 51 | Yonkers, NY | 209,978 | 94,902 | 0.0% |
| 52 | Bridgeport, CT | 149,153 | 66,803 | 0.0% |
| 53 | Hartford, CT | 121,127 | 53,941 | 0.0% |
| 54 | Houston, TX | 2,328,253 | 1,030,112 | 0.0% |
| 55 | Mesquite, TX | 149,299 | 65,677 | 0.0% |
| 56 | Long Beach, CA | 455,548 | 199,561 | 0.0% |
| 57 | Irving, TX | 256,492 | 111,352 | 0.0% |
| 58 | West Valley City, UT | 138,437 | 59,992 | 0.0% |
| 59 | Hollywood, FL | 155,082 | 67,004 | 0.0% |
| 60 | Tucson, AZ | 547,073 | 233,878 | 0.0% |
| 61 | Dallas, TX | 1,307,930 | 556,904 | 0.0% |
| 62 | Glendale, AZ | 252,833 | 106,723 | 0.0% |
| 63 | Phoenix, AZ | 1,642,323 | 689,225 | 0.0% |
| 64 | North Las Vegas, NV | 278,595 | 116,202 | 0.0% |
| 65 | Aurora, IL | 179,898 | 74,887 | 0.0% |
| 66 | Hayward, CA | 158,801 | 65,526 | 0.0% |
| 67 | Fullerton, CA | 140,968 | 56,779 | 0.0% |
| 68 | Orange, CA | 138,266 | 55,223 | 0.0% |
| 69 | Miramar, FL | 138,600 | 54,498 | 0.0% |
| 70 | Waterbury, CT | 114,869 | 44,278 | 0.0% |
| 71 | Rancho Cucamonga, CA | 175,411 | 66,809 | 0.0% |
| 72 | Thornton, CO | 144,187 | 54,293 | 0.0% |
| 73 | Newark, NJ | 310,178 | 116,594 | 0.0% |
| 74 | Oceanside, CA | 172,242 | 64,577 | 0.0% |
| 75 | Santa Rosa, CA | 177,090 | 66,211 | 0.0% |
| 76 | Garden Grove, CA | 170,964 | 63,495 | 0.0% |
| 77 | Paradise, NV | 185,913 | 68,493 | 0.0% |
| 78 | Lubbock, TX | 264,814 | 97,039 | 0.0% |
| 79 | Costa Mesa, CA | 110,330 | 40,414 | 0.0% |
| 80 | Miami Gardens, FL | 113,177 | 41,131 | 0.0% |
| 81 | Santa Clarita, CA | 230,221 | 83,648 | 0.0% |
| 82 | San Buenaventura (Ventura), CA | 109,857 | 39,549 | 0.0% |
| 83 | Kansas City, KS | 155,135 | 55,401 | 0.0% |
| 84 | Orlando, FL | 319,758 | 113,128 | 0.0% |
| 85 | Las Vegas, NV | 660,400 | 228,863 | 0.0% |
| 86 | Fort Worth, TX | 963,194 | 333,202 | 0.0% |
| 87 | Joliet, IL | 150,445 | 51,435 | 0.0% |
| 88 | Amarillo, TX | 201,885 | 68,950 | 0.0% |
| 89 | Pasadena, CA | 136,969 | 46,523 | 0.0% |
| 90 | Fairfield, CA | 120,785 | 39,556 | 0.0% |
| 91 | Concord, CA | 124,035 | 40,217 | 0.0% |
| 92 | Carrollton, TX | 133,740 | 43,233 | 0.0% |
| 93 | Arlington, TX | 397,742 | 127,987 | 0.0% |
| 94 | Austin, TX | 979,539 | 312,597 | 0.0% |
| 95 | Aurora, CO | 394,432 | 123,736 | 0.0% |
| 96 | Coral Springs, FL | 136,103 | 42,452 | 0.0% |
| 97 | New Haven, CT | 134,349 | 41,680 | 0.0% |
| 98 | San Jose, CA | 990,138 | 304,988 | 0.0% |
| 99 | Waco, TX | 143,570 | 43,971 | 0.0% |
| 100 | San Diego, CA | 1,389,526 | 414,040 | 0.0% |
Source: U.S. Census ACS 2020-2024. The 100 largest US cities.
Summary
There You Have It — The Most Hispanic Cities In America For 2026
There you have it, the cities in America with the largest Hispanic population for 2026 with East Los Angeles taking the top spot.
We expect the Hispanic population in America to keep increasing in the coming years. So it won’t be a surprise to you or us if these percentages get bigger next year.
The cities in the United States with the largest Hispanic population are East Los Angeles, CA, Hialeah, FL, Laredo, TX, Brownsville, TX, Mcallen, TX, El Paso, TX, Salinas, CA, Oxnard, CA, Santa Ana, CA, and Downey, CA.