

In this article, we will explore some of the most liberal cities in Missouri, where progressive ideas and inclusive attitudes flourish.
If you’re looking to move to Missouri and want to know where the majority of Missourians lean left, you’ve come to the right place.
Specifically, we wanted to know which cities have the highest number of liberal voters in the Show Me State.
To do so, we analyzed how the people in each city in Missouri with a population greater than 5,000 voted during the last presidential election. The cities with the highest percentage of voters who voted Democrat were named the most liberal cities in the state.
Not sold on Missouri? Take the two-minute Find Your Place quiz and see which state actually fits you.
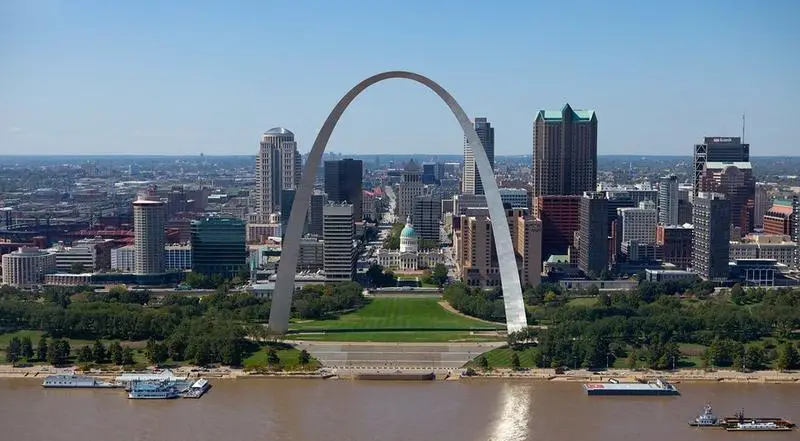
82.2% Democrat vote · #1 most liberal in Missouri
 Located in
St. Louis city, Missouri
Located in
St. Louis city, Missouri
St. Louis is an independent city and major U.S. port in the state of Missouri, built along the western bank of the Mississippi River, on the border with Illinois. The city had an estimated 2016 population of 311,404, and is the cultural and economic center of the Greater St. Louis area, making it the largest metropolitan area in Missouri and the 19th-largest in the United States.
Data | Crime | Cost of living | Movers | Compare
61.2% Democrat vote · #20 most liberal in Missouri
 Located in
St. Louis County, Missouri
Located in
St. Louis County, Missouri
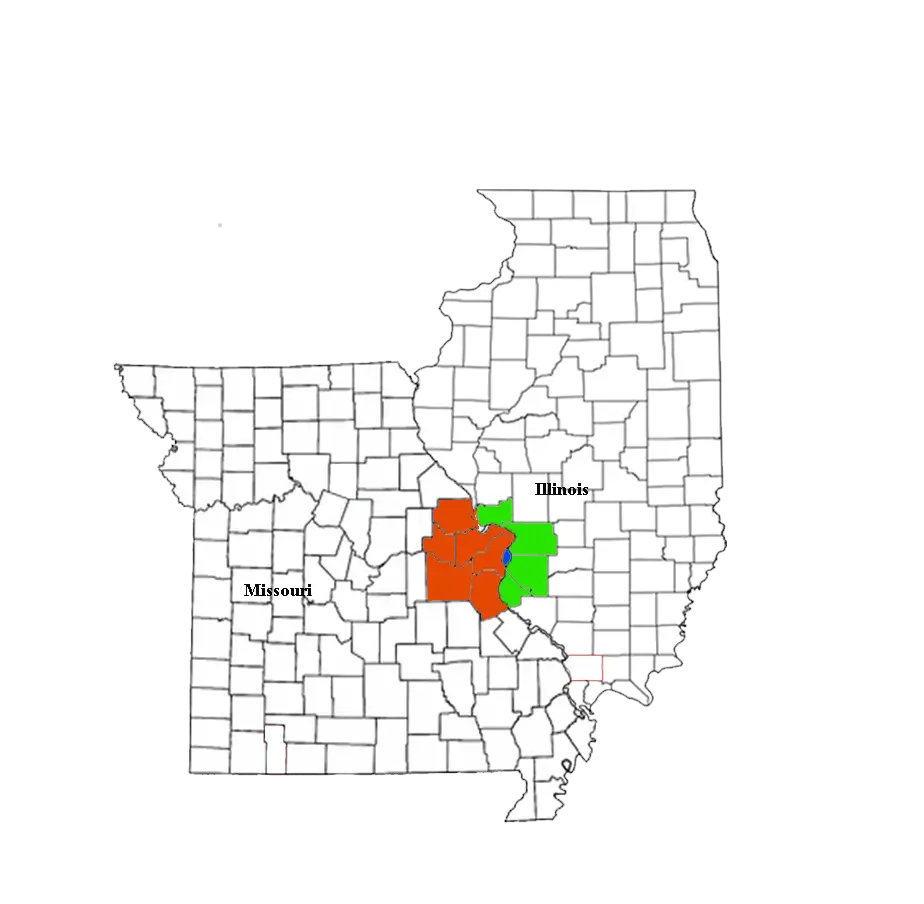
Bellefontaine Neighbors is an inner-ring suburb city in St. Louis County, Missouri, United States. The population was 10,860 at the 2010 census. At 22 letters, it has the longest name of any incorporated place in the United States.
Data | Crime | Cost of living | Movers
61.2% Democrat vote · #20 most liberal in Missouri
 Located in
St. Louis County, Missouri
Located in
St. Louis County, Missouri
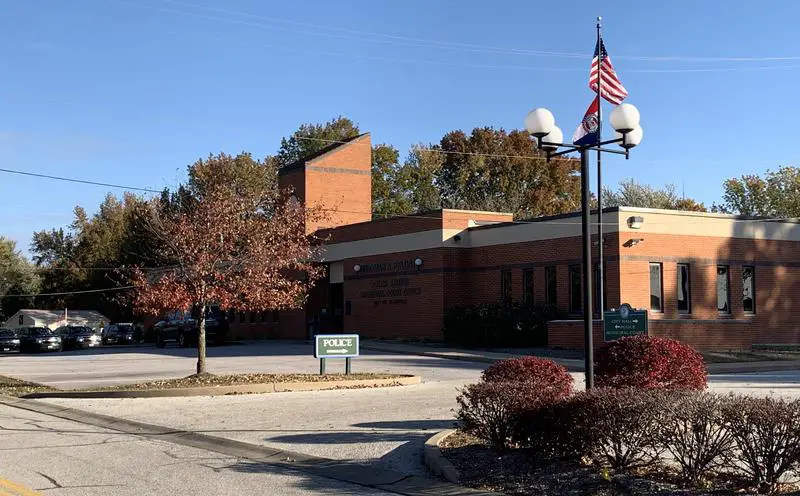
Ellisville is a city in St. Louis County, Missouri, United States. The population was 9,133 at the 2010 census.
Data | Crime | Cost of living | Movers
61.2% Democrat vote · #20 most liberal in Missouri
 Located in
St. Louis County, Missouri
Located in
St. Louis County, Missouri
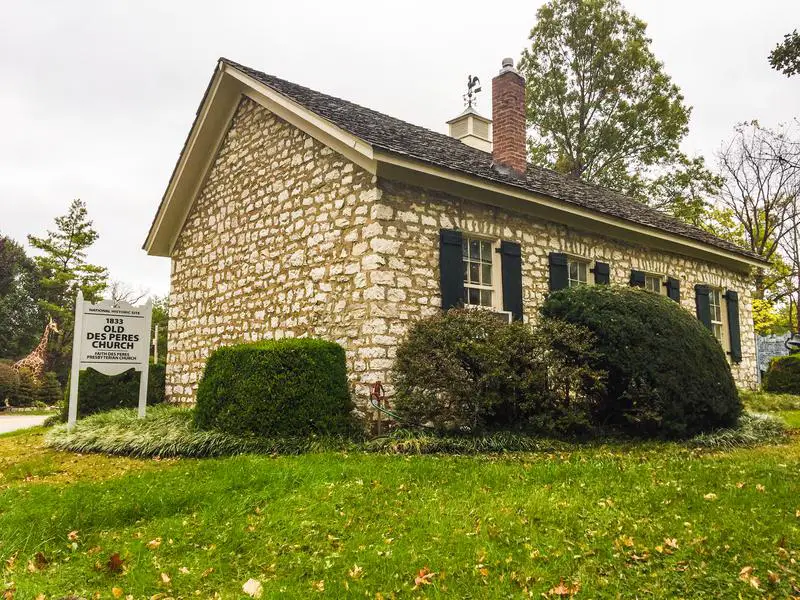
Des Peres is a city in St. Louis County, Missouri, United States. The population was 8,373 at the 2010 census.
Data | Crime | Cost of living | Movers
61.2% Democrat vote · #20 most liberal in Missouri
 Located in
St. Louis County, Missouri
Located in
St. Louis County, Missouri
Data | Crime | Cost of living | Movers
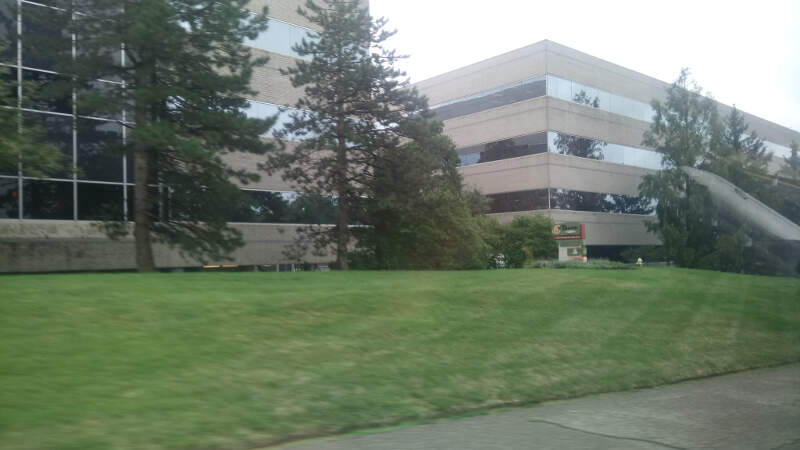
61.2% Democrat vote · #20 most liberal in Missouri
 Located in
St. Louis County, Missouri
Located in
St. Louis County, Missouri
Sunset Hills is a city in St. Louis County, Missouri, United States. The population was 8,496 at the 2010 census.
Data | Crime | Cost of living | Movers
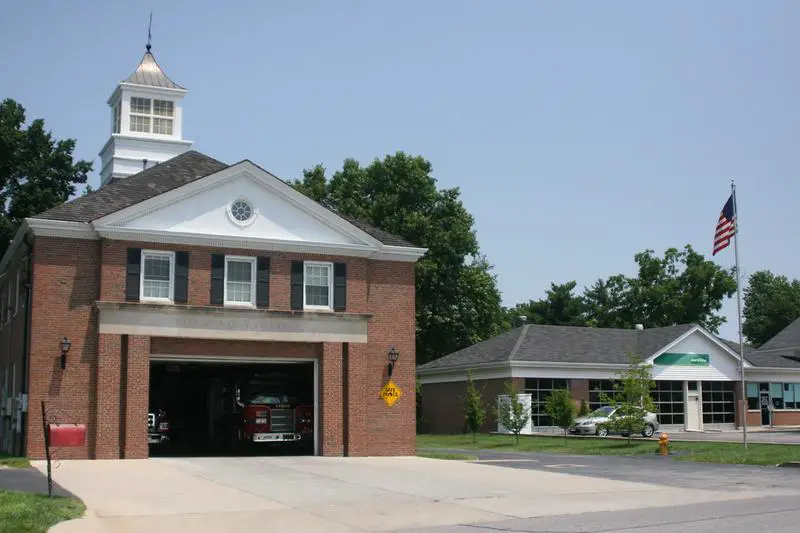
61.2% Democrat vote · #20 most liberal in Missouri
 Located in
St. Louis County, Missouri
Located in
St. Louis County, Missouri
Ladue is an inner-ring suburb of St. Louis, located in central St. Louis County, Missouri, United States. As of the 2013 census, the city had a population of 8,560.
Data | Crime | Cost of living | Movers
61.2% Democrat vote · #20 most liberal in Missouri
 Located in
St. Louis County, Missouri
Located in
St. Louis County, Missouri
Olivette is an inner-ring suburb of St. Louis, located in St. Louis County, Missouri, United States. The population was 7,737 at the 2010 census.
Data | Crime | Cost of living | Movers
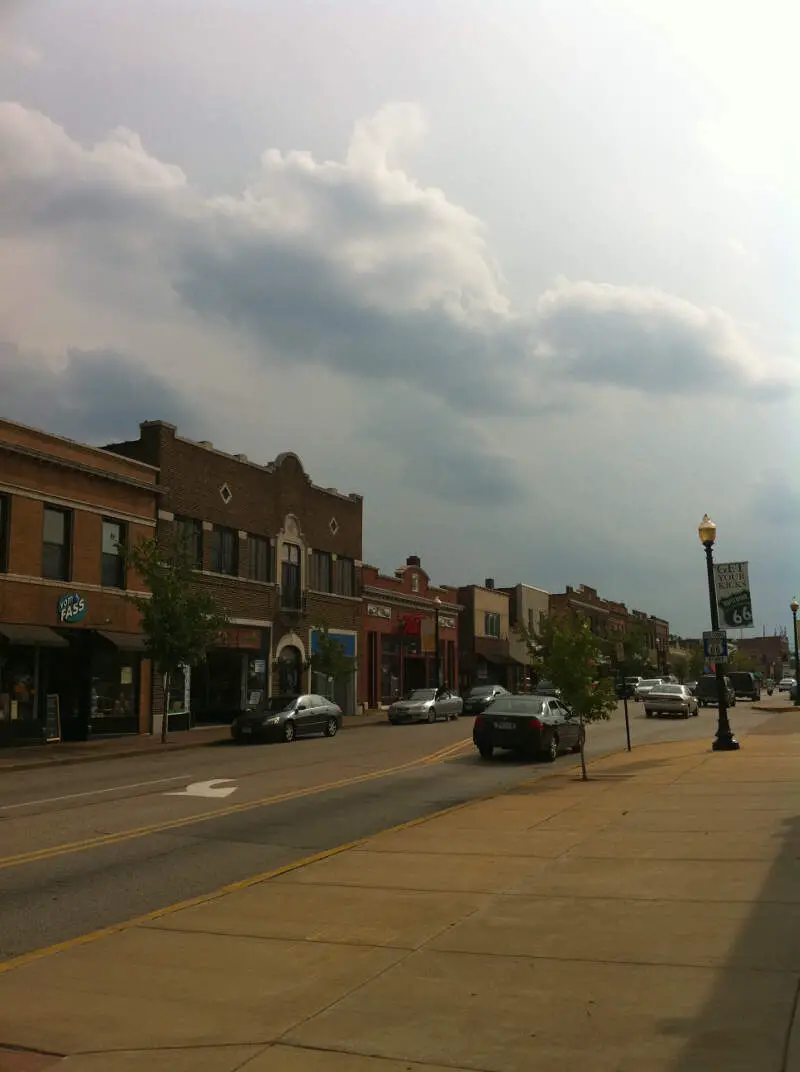
61.2% Democrat vote · #20 most liberal in Missouri
 Located in
St. Louis County, Missouri
Located in
St. Louis County, Missouri
Maplewood is an inner-ring suburb of St. Louis, located in St. Louis County. The population was 8,046 at the 2010 census.
Data | Crime | Cost of living | Movers
61.2% Democrat vote · #20 most liberal in Missouri
 Located in
St. Louis County, Missouri
Located in
St. Louis County, Missouri
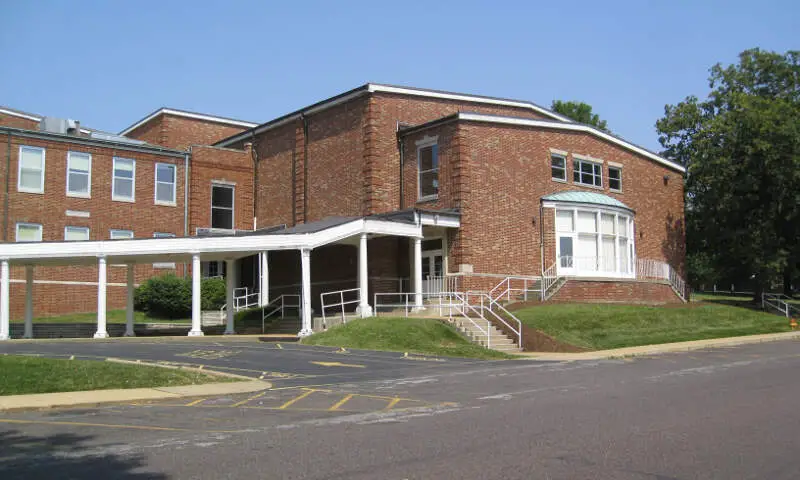
Brentwood is an inner-ring suburb of St. Louis, located in St. Louis County, Missouri. The population was 8,055 at the 2010 census. Brentwood is home to Brentwood High School, a 2006 National Blue Ribbon Award winner, and Mark Twain Elementary School, a 2009 National Blue Ribbon Award winner.
Data | Crime | Cost of living | Movers
The receipts
Compare the top ten
Pick a metric. The bars rescale. The red line is Missouri’s statewide median.
On the map
Mapping the liberal strongholds in Missouri
Saturday Night Science
How we determined the most liberal cities in Missouri for 2026
To find the most liberal places in Missouri, we used Saturday Night Science – the argument you’d make at a bar – to find the cities with the most liberals.
We started by making a list of every city in Missouri over 5,000 people based on the 2020-2024 American Community Survey. That left us with 131 cities and towns.
We then measured the voting record and MIT election data to determine which places lean the most leftward in their allegiances by:
- Percentage Of Votes For Democratic President In 2020
Because no voting data exists at the city level, we used county-level election results from the 2020 election. We assigned every city in a county the percentage of votes that went to the Democrats, effectively extending the county’s results to the city level. In cases where larger cities encompassed an entire county, the election outcomes accurately reflected the city’s political landscape.
The winner, St. Louis, is “The Most liberal City in Missouri For 2026”. The most conservative place in Missouri was Dexter.
We updated this article for 2026. This report is our eleventh time ranking the most liberal places to live in Missouri.
The full plate
Most Liberal Places In Missouri
Click any column to sort. Search by city name.
| Rank | City | Population | % Liberal |
|---|---|---|---|
| 1 | St. Louis | 288,512 | 82.2% |
| 19 | Bellefontaine Neighbors | 10,498 | 61.2% |
| 19 | Ellisville | 10,002 | 61.2% |
| 19 | Des Peres | 9,170 | 61.2% |
| 19 | Richmond Heights | 9,153 | 61.2% |
| 19 | Sunset Hills | 9,112 | 61.2% |
| 19 | Ladue | 8,940 | 61.2% |
| 19 | Olivette | 8,645 | 61.2% |
| 19 | Maplewood | 8,156 | 61.2% |
| 19 | Brentwood | 8,144 | 61.2% |
| 19 | Berkeley | 8,123 | 61.2% |
| 19 | Valley Park | 6,795 | 61.2% |
| 19 | Black Jack | 6,589 | 61.2% |
| 19 | St. John | 6,527 | 61.2% |
| 19 | Shrewsbury | 6,316 | 61.2% |
| 19 | Glendale | 6,114 | 61.2% |
| 19 | Bridgeton | 11,369 | 61.2% |
| 19 | Town and Country | 11,607 | 61.2% |
| 19 | Pacific | 7,475 | 61.2% |
| 19 | St. Ann | 12,811 | 61.2% |
| 19 | Florissant | 51,773 | 61.2% |
| 19 | Chesterfield | 49,574 | 61.2% |
| 19 | Wildwood | 35,133 | 61.2% |
| 19 | University City | 34,685 | 61.2% |
| 19 | Ballwin | 31,279 | 61.2% |
| 19 | Crestwood | 12,295 | 61.2% |
| 19 | Kirkwood | 29,363 | 61.2% |
| 19 | Maryland Heights | 27,880 | 61.2% |
| 19 | Hazelwood | 25,114 | 61.2% |
| 19 | Webster Groves | 23,712 | 61.2% |
| 19 | Creve Coeur | 18,643 | 61.2% |
| 19 | Ferguson | 18,213 | 61.2% |
| 19 | Manchester | 18,160 | 61.2% |
| 19 | Clayton | 17,380 | 61.2% |
| 19 | Overland | 15,695 | 61.2% |
| 19 | Eureka | 13,081 | 61.2% |
| 19 | Jennings | 12,918 | 61.2% |
| 38 | Columbia | 128,548 | 54.9% |
| 40 | Smithville | 10,705 | 47.5% |
| 40 | Parkville | 8,366 | 47.5% |
| 40 | Kansas City | 510,612 | 47.5% |
| 46 | Oak Grove | 8,538 | 46.9% |
| 46 | Independence | 121,740 | 46.9% |
| 46 | Lee’s Summit | 103,656 | 46.9% |
| 46 | Blue Springs | 59,965 | 46.9% |
| 46 | Raytown | 29,445 | 46.9% |
| 46 | Grandview | 26,527 | 46.9% |
| 46 | Grain Valley | 16,271 | 46.9% |
| 46 | Pleasant Hill | 8,847 | 46.9% |
| 46 | Greenwood | 6,013 | 46.9% |
| 52 | Excelsior Springs | 10,484 | 46.9% |
| 52 | Kearney | 10,885 | 46.9% |
| 52 | Gladstone | 27,207 | 46.9% |
| 52 | Liberty | 30,689 | 46.9% |
| 58 | Dardenne Prairie | 13,503 | 40.3% |
| 58 | Cottleville | 5,937 | 40.3% |
| 58 | Lake St. Louis | 18,066 | 40.3% |
| 58 | Weldon Spring | 5,310 | 40.3% |
| 58 | St. Peters | 59,092 | 40.3% |
| 58 | St. Charles | 71,508 | 40.3% |
| 58 | O’Fallon | 93,801 | 40.3% |
| 58 | Wentzville | 47,061 | 40.3% |
| 64 | Willard | 6,488 | 38.8% |
| 64 | Battlefield | 6,165 | 38.8% |
| 64 | Springfield | 169,954 | 38.8% |
| 64 | Republic | 19,829 | 38.8% |
| 67 | St. Joseph | 71,236 | 36.7% |
| 68 | Kirksville | 17,563 | 35.9% |
| 70 | Belton | 25,008 | 33.2% |
| 70 | Raymore | 24,526 | 33.2% |
| 70 | Harrisonville | 9,970 | 33.2% |
| 70 | Peculiar | 5,958 | 33.2% |
| 75 | Herculaneum | 5,071 | 32.2% |
| 75 | Pevely | 6,055 | 32.2% |
| 75 | Arnold | 20,956 | 32.2% |
| 75 | Festus | 13,201 | 32.2% |
| 75 | De Soto | 6,470 | 32.2% |
| 78 | Jefferson City | 42,488 | 32.1% |
| 79 | Marshall | 13,739 | 30.5% |
| 80 | Warrensburg | 19,582 | 30.2% |
| 81 | Maryville | 10,428 | 28.8% |
| 82 | Rolla | 20,287 | 28.8% |
| 83 | Ste. Genevieve | 5,010 | 28.6% |
| 84 | Fulton | 12,617 | 27.8% |
| 85 | Caruthersville | 5,326 | 27.2% |
| 87 | Washington | 15,130 | 27.1% |
| 87 | Union | 12,781 | 27.1% |
| 87 | Sullivan | 6,310 | 27.1% |
| 89 | Richmond | 5,959 | 26.7% |
| 90 | Jackson | 15,659 | 26.7% |
| 90 | Cape Girardeau | 40,344 | 26.7% |
| 92 | Cameron | 8,519 | 26.6% |
| 93 | Odessa | 5,620 | 26.2% |
| 94 | Warrenton | 9,066 | 26.0% |
| 94 | Wright City | 5,240 | 26.0% |
| 96 | Waynesville | 5,442 | 25.9% |
| 96 | St. Robert | 5,356 | 25.9% |
| 99 | Carl Junction | 8,339 | 25.9% |
| 99 | Webb City | 13,221 | 25.9% |
| 99 | Joplin | 52,593 | 25.9% |
Source: county-level 2020 election results, U.S. Census ACS 2020-2024. 131 cities with more than 5,000 residents.
Summary
Summing Up The Liberal Snowflakes in Missouri
Well, there you have it, the places in Missouri that have the highest number of liberals per capita, with St. Louis ranking as the least conservative in the entire state.
The most liberal cities in Missouri are St. Louis, Bellefontaine Neighbors, Ellisville, Des Peres, Richmond Heights, Sunset Hills, Ladue, Olivette, Maplewood, and Brentwood.
If you’re curious, here are the least liberal cities in Missouri. Wondering how St. Louis stacks up against a bigger name? See St. Louis, MO vs. Atlanta, GA side by side.
Questions and answers
Most Liberal Places In Missouri FAQs
What is the most liberal city in Missouri?
St. Louis is the most liberal place in Missouri for 2026, by Democrat share of the 2020 presidential vote. Bellefontaine Neighbors and Ellisville are next.
What are the most liberal places in Missouri?
The most liberal places in Missouri are St. Louis, Bellefontaine Neighbors, Ellisville, Des Peres, Richmond Heights, Sunset Hills, Ladue, Olivette, Maplewood, and Brentwood. We ranked all 131 cities with more than 5,000 residents.
How do you measure how liberal a city is?
Cities are ranked on the county-level Democrat vote share from the 2020 presidential election. One number, straight from certified election results.
What is the most conservative place in Missouri?
Dexter posts the lowest Democrat vote share of the 131 Missouri cities we ranked, making it the most conservative place on this list. Our separate most conservative places in Missouri ranking runs the same math from the other direction.
Does city size matter in this ranking?
Only places with more than 5,000 residents qualify — 131 Missouri cities this year. Beyond that cutoff, a small town and a big city count the same.


