Most Native American places in Michigan research summary. We used Saturday Night Science to research the Michigan cities with the highest percentage of Native American residents for 2026. The data comes from the American Community Survey 2020-2024 vintage, which breaks down race by origin.
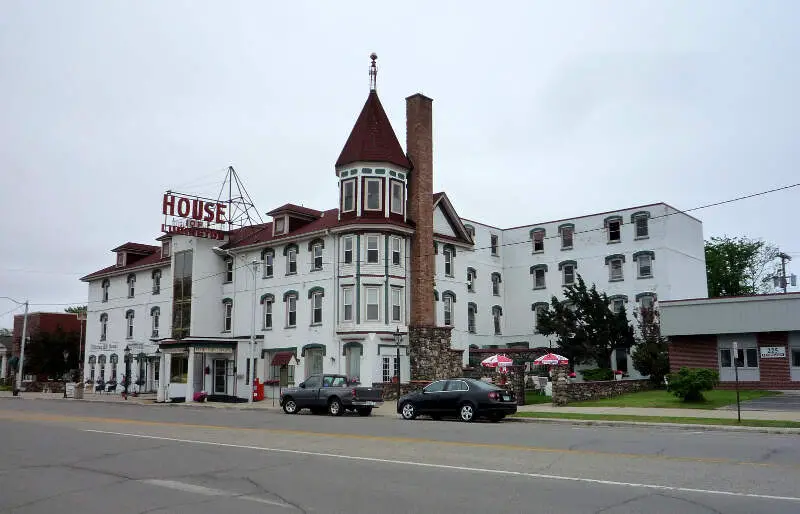
The city with the highest percentage of Native Americans is Sault Ste. Marie. 13.90% of people in Sault Ste. Marie are Native Americans.
The city with the lowest percentage of Native Americans is Zeeland. 0.00% of people in Zeeland are Native American.
The city with the most Native Americans is Sault Ste. Marie. 1,853 people in Sault Ste. Marie are Native American.
The city with the fewest Native Americans is Zeeland. 0 people in Zeeland are Native American.
The United States has 1,698,432 Native Americans and is 0.51% Native American.
Which city in Michigan had the largest Native American population? The place with the largest Native American population in Michigan for 2026 is Sault Ste. Marie. 13.90% of Sault Ste. Marie identify as Native American.
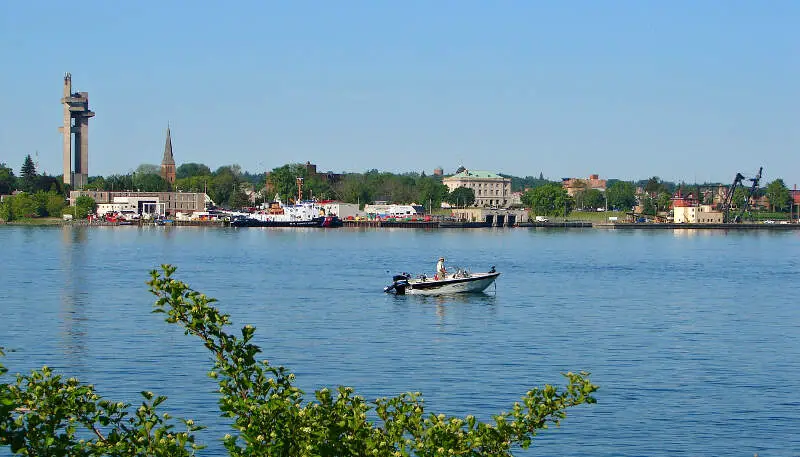
13.9% Native American · 1,853 Native American residents
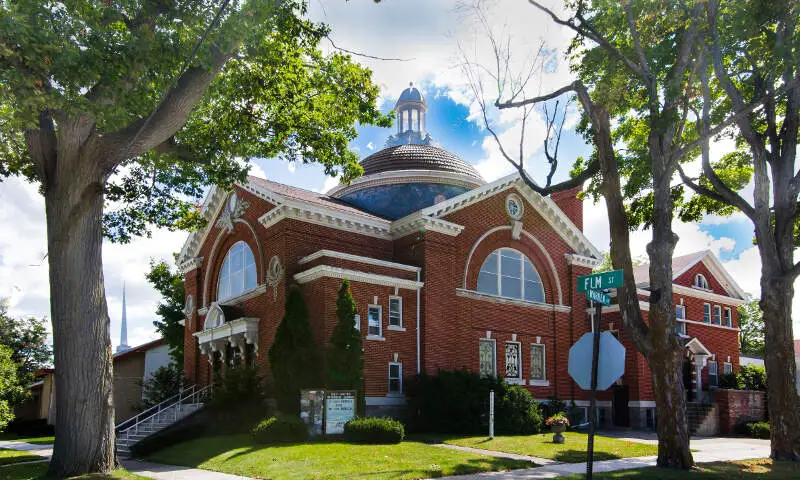
Sault Ste. Marie is a city in, and the county seat of, Chippewa County in the U.S. state of Michigan. It is situated on the northeastern end of Michigan’s Upper Peninsula, on the Canada-US border, and separated from its twin city of Sault Ste. Marie, Ontario, by the St. Marys River. The city is relatively isolated from other communities in Michigan and is 346 miles from Detroit. The population was 14,144 at the 2010 census, making it the second most populous city in the Upper Peninsula. By contrast, the Canadian Sault Ste. Marie is much larger, with more than 75,000 residents, based on more extensive industry developed in the 20th century and an economy with closer connections to other communities.
Data | Crime | Cost of living | Movers
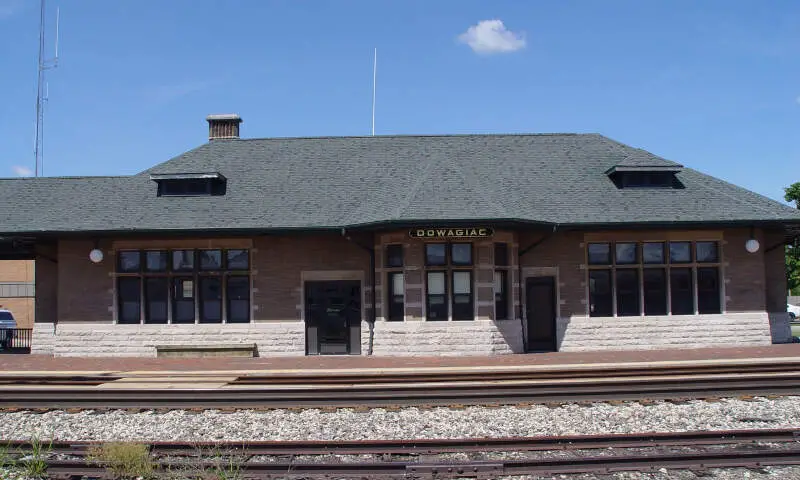
2.0% Native American · 113 Native American residents
Dowagiac is a city in Cass County in the U.S. state of Michigan. The population was 5,879 at the 2010 census. It is part of the South Bend-Mishawaka, IN-MI, Metropolitan Statistical Area.
Data | Crime | Cost of living | Movers
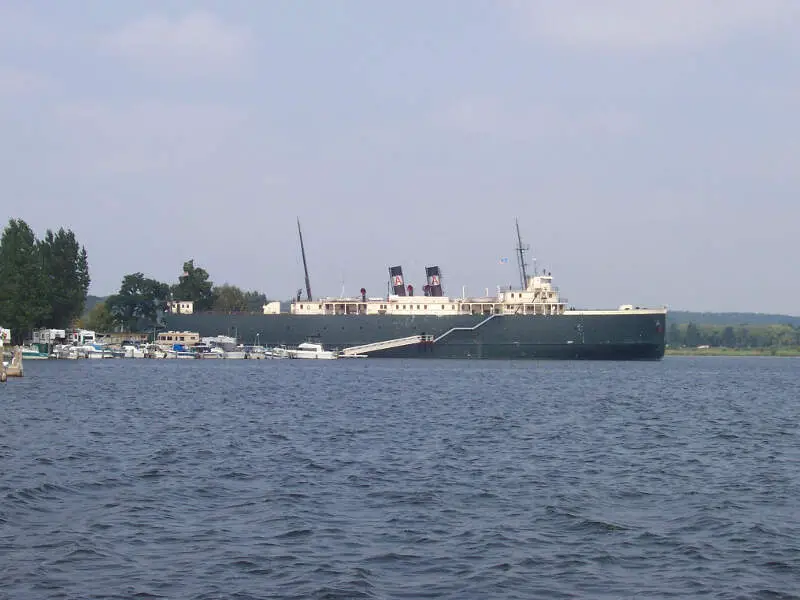
1.9% Native American · 118 Native American residents
Manistee is a city in the U.S. state of Michigan. The population was 6,226 at the 2010 census. It is the county seat of Manistee County. The name “Manistee” is from an Ojibwe word first applied to the principal river of the county. The derivation is not certain, but it may be from ministigweyaa, “river with islands at its mouth”. Other sources claim that it was an Ojibwe term meaning “spirit of the woods”.
Data | Crime | Cost of living | Movers
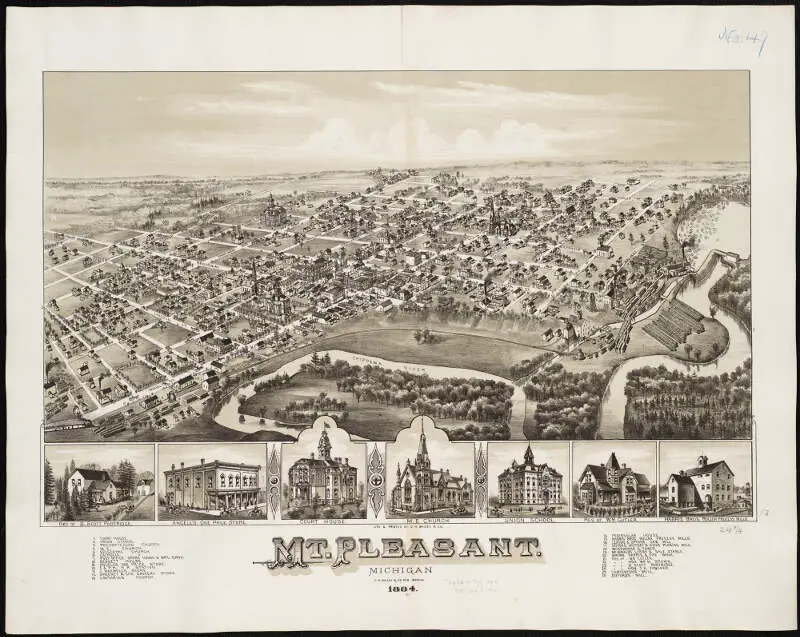
1.5% Native American · 313 Native American residents
Mount Pleasant is a city in the U.S. state of Michigan and the county seat of Isabella County, located in Central Michigan. The population was 26,016 at the 2010 census.
Data | Crime | Cost of living | Movers
1.3% Native American · 125 Native American residents
Data | Crime | Cost of living | Movers
1.3% Native American · 106 Native American residents
Center Line is a city in Macomb County in the U.S. state of Michigan, surrounded entirely by the city of Warren. The population was 8,257 at the 2010 census.
Data | Crime | Cost of living | Movers
1.2% Native American · 100 Native American residents
Houghton is a city in the U.S. state of Michigan’s Upper Peninsula and largest city in the Copper Country on the Keweenaw Peninsula. As of the 2010 census, the city population was 7,708. It is the county seat of Houghton County. It has been listed as one of the “100 Best Small Towns in America.”
Data | Crime | Cost of living | Movers
1.2% Native American · 143 Native American residents
Escanaba is a port city in Delta County in the U.S. state of Michigan, located on the Escanaba River in the banana belt of the state’s Upper Peninsula. The population was 12,616 at the 2010 census, making it the third-largest city in the Upper Peninsula after Marquette and Sault Ste. Marie. It is the seat of government of Delta County.
Data | Crime | Cost of living | Movers
1.2% Native American · 98 Native American residents
Big Rapids is a city in the U.S. state of Michigan. The population was 10,601 at the 2010 census. It is the county seat of Mecosta County. The city is located within Big Rapids Township, but is politically independent. Big Rapids is home of the main campus of Ferris State University, a four-year public university, well known for its College of Pharmacy and the Michigan College of Optometry, as well as its NCAA Division I hockey team, the Bulldogs.
Data | Crime | Cost of living | Movers
0.9% Native American · 82 Native American residents
Ecorse is a city in Wayne County in the U.S. state of Michigan, named for the Ecorse River. The population was 9,512 at the 2010 census.
Data | Crime | Cost of living | Movers
The receipts
Compare the top ten
Pick a metric. The bars rescale. The red line is Michigan’s statewide median.
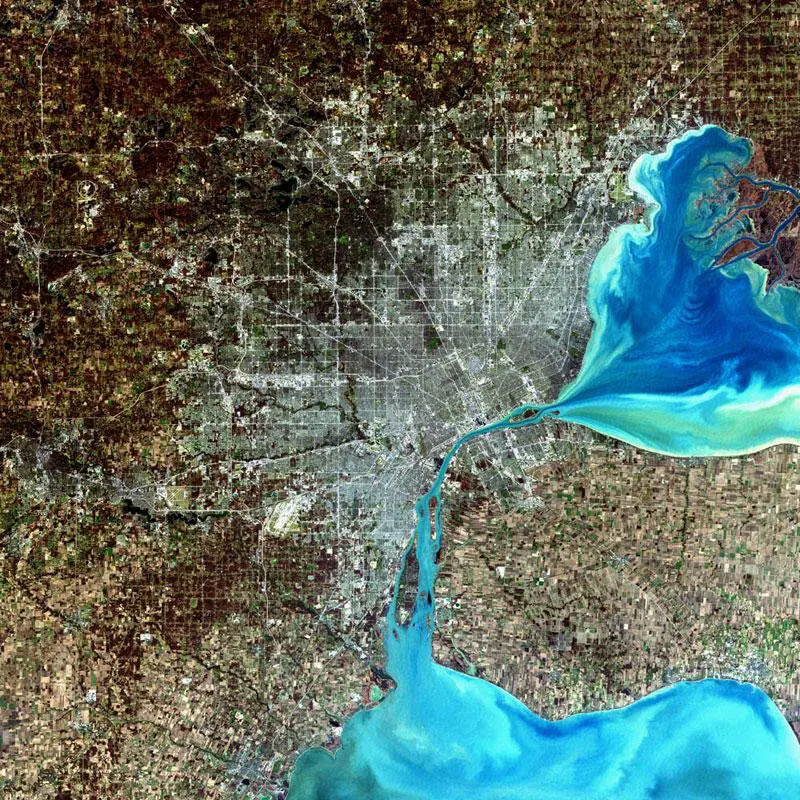
On the map
Where Michigan’s Native American population is concentrated
Saturday Night Science
Methodology: How We Determined The Cities In Michigan With The Largest Native American Population For 2026
We still believe in the accuracy of data — especially from the Census. So that’s where we went to get the race breakdown across Michigan.
We used Saturday Night Science to analyze the Census’s most recently available data, the 2020-2024 American Community Survey data.
Specifically, we looked at table B03002: Hispanic OR LATINO ORIGIN BY RACE. Here are the category names as defined by the Census:
- Hispanic or Latino
- White alone
- Black or African American alone
- American Indian and Alaska Native alone
- Asian alone
- Native Hawaiian and Other Pacific Islander alone
- Some other race alone
- Two or more races
Our particular column of interest here was the number of people identifying as American Indian and Alaska Native alone.
We limited our analysis to places with a population greater than 5,000 people. That left us with 147 cities.
We then calculated the percentage of residents that are American Indian and Alaska Native. The percentages ranked from 13.90 to 0.00.
Finally, we ranked each city based on the percentage of the American Indian and Alaska Native population, with a higher score being more American Indian and Alaska Native than a lower score. Sault Ste. Marie took the distinction of being the most American Indian and Alaska Native, while Zeeland was the least Native American city.
We updated this article for 2026. This article is our eleventh time ranking the cities in Michigan with the largest Native American population.
The full plate
Most Native American Places In Michigan
Click any column to sort. Search by city name.
| Rank | City | Population | Native American Population | % Native American |
|---|---|---|---|---|
| 1 | Sault Ste. Marie | 13,335 | 1,853 | 13.9% |
| 2 | Dowagiac | 5,732 | 113 | 2.0% |
| 3 | Manistee | 6,275 | 118 | 1.9% |
| 4 | Mount Pleasant | 21,236 | 313 | 1.5% |
| 5 | Muskegon Heights | 9,841 | 125 | 1.3% |
| 6 | Center Line | 8,463 | 106 | 1.3% |
| 7 | Houghton | 8,474 | 100 | 1.2% |
| 8 | Escanaba | 12,354 | 143 | 1.2% |
| 9 | Big Rapids | 8,477 | 98 | 1.2% |
| 10 | Ecorse | 9,064 | 82 | 0.9% |
| 11 | Iron Mountain | 7,518 | 68 | 0.9% |
| 12 | Springfield | 5,269 | 43 | 0.8% |
| 13 | Wayne | 17,310 | 128 | 0.7% |
| 14 | Marquette | 21,325 | 147 | 0.7% |
| 15 | St. Johns | 7,715 | 53 | 0.7% |
| 16 | Gladstone | 5,253 | 36 | 0.7% |
| 17 | Albion | 7,560 | 51 | 0.7% |
| 18 | Burton | 29,500 | 187 | 0.6% |
| 19 | Ionia | 12,753 | 75 | 0.6% |
| 20 | Kingsford | 5,124 | 28 | 0.5% |
| 21 | St. Louis | 7,367 | 39 | 0.5% |
| 22 | Belding | 5,960 | 31 | 0.5% |
| 23 | Flushing | 8,284 | 43 | 0.5% |
| 24 | Ludington | 7,676 | 39 | 0.5% |
| 25 | Ishpeming | 6,181 | 30 | 0.5% |
| 26 | Petoskey | 5,856 | 27 | 0.5% |
| 27 | Fraser | 14,583 | 64 | 0.4% |
| 28 | Woodhaven | 12,690 | 54 | 0.4% |
| 29 | Eaton Rapids | 5,183 | 22 | 0.4% |
| 30 | Muskegon | 37,226 | 158 | 0.4% |
| 31 | Grand Ledge | 7,804 | 31 | 0.4% |
| 32 | Hamtramck | 27,743 | 105 | 0.4% |
| 33 | Lapeer | 9,082 | 30 | 0.3% |
| 34 | Inkster | 25,428 | 82 | 0.3% |
| 35 | Lansing | 113,023 | 346 | 0.3% |
| 36 | Hastings | 7,520 | 23 | 0.3% |
| 37 | Westland | 83,633 | 242 | 0.3% |
| 38 | Owosso | 14,632 | 39 | 0.3% |
| 39 | Flint | 80,175 | 209 | 0.3% |
| 40 | Grand Rapids | 198,535 | 510 | 0.3% |
| 41 | Norton Shores | 25,041 | 63 | 0.3% |
| 42 | Garden City | 26,739 | 67 | 0.3% |
| 43 | Plymouth | 9,214 | 23 | 0.2% |
| 44 | Charlotte | 9,277 | 23 | 0.2% |
| 45 | Traverse City | 15,593 | 37 | 0.2% |
| 46 | Alma | 9,396 | 22 | 0.2% |
| 47 | Berkley | 15,149 | 35 | 0.2% |
| 48 | Ann Arbor | 122,036 | 277 | 0.2% |
| 49 | Port Huron | 28,620 | 63 | 0.2% |
| 50 | Pontiac | 62,104 | 125 | 0.2% |
| 51 | Novi | 66,717 | 134 | 0.2% |
| 52 | Howell | 10,021 | 20 | 0.2% |
| 53 | Portage | 49,259 | 95 | 0.2% |
| 54 | Farmington | 11,504 | 22 | 0.2% |
| 55 | Madison Heights | 28,419 | 51 | 0.2% |
| 56 | East Lansing | 45,758 | 81 | 0.2% |
| 57 | Three Rivers | 7,943 | 14 | 0.2% |
| 58 | St. Joseph | 7,986 | 14 | 0.2% |
| 59 | Mount Clemens | 15,511 | 27 | 0.2% |
| 60 | Detroit | 638,530 | 1,069 | 0.2% |
| 61 | Troy | 87,898 | 146 | 0.2% |
| 62 | Walker | 25,386 | 40 | 0.2% |
| 63 | Greenville | 8,995 | 14 | 0.2% |
| 64 | Wyandotte | 24,489 | 38 | 0.2% |
| 65 | Flat Rock | 10,340 | 16 | 0.2% |
| 66 | Kalamazoo | 73,076 | 113 | 0.2% |
| 67 | Highland Park | 8,628 | 13 | 0.2% |
| 68 | Battle Creek | 52,374 | 78 | 0.1% |
| 69 | Bay City | 32,320 | 47 | 0.1% |
| 70 | Romulus | 24,831 | 35 | 0.1% |
| 71 | Saline | 9,006 | 12 | 0.1% |
| 72 | Marshall | 6,804 | 9 | 0.1% |
| 73 | Warren | 137,928 | 181 | 0.1% |
| 74 | Holland | 34,423 | 45 | 0.1% |
| 75 | Kentwood | 54,296 | 68 | 0.1% |
| 76 | Sterling Heights | 133,573 | 162 | 0.1% |
| 77 | Grosse Pointe Farms | 9,904 | 12 | 0.1% |
| 78 | Ypsilanti | 19,857 | 23 | 0.1% |
| 79 | Northville | 6,069 | 7 | 0.1% |
| 80 | Roseville | 47,123 | 54 | 0.1% |
| 81 | Rochester Hills | 77,089 | 88 | 0.1% |
| 82 | Farmington Hills | 83,515 | 94 | 0.1% |
| 83 | Menominee | 8,326 | 9 | 0.1% |
| 84 | Harper Woods | 15,116 | 16 | 0.1% |
| 85 | Taylor | 62,081 | 65 | 0.1% |
| 86 | Jackson | 31,058 | 30 | 0.1% |
| 87 | Cadillac | 10,445 | 10 | 0.1% |
| 88 | Wixom | 17,295 | 16 | 0.1% |
| 89 | Brighton | 7,688 | 7 | 0.1% |
| 90 | St. Clair Shores | 58,140 | 50 | 0.1% |
| 91 | Rochester | 12,934 | 11 | 0.1% |
| 92 | Monroe | 20,320 | 17 | 0.1% |
| 93 | Oak Park | 29,318 | 24 | 0.1% |
| 94 | Livonia | 93,851 | 76 | 0.1% |
| 95 | Alpena | 10,154 | 8 | 0.1% |
| 96 | Niles | 11,803 | 9 | 0.1% |
| 97 | Grandville | 16,356 | 12 | 0.1% |
| 98 | Lincoln Park | 39,257 | 28 | 0.1% |
| 99 | Wyoming | 77,353 | 54 | 0.1% |
| 100 | Saginaw | 43,536 | 29 | 0.1% |
Source: U.S. Census ACS 2020-2024, table B03002. 147 Michigan cities with more than 5,000 residents.
Summary
Summary: Native American Populations Across Michigan
If you’re looking for a breakdown of Native American populations across Michigan according to the most recent data, this is an accurate list.
The most Native American cities in Michigan are Sault Ste. Marie, Dowagiac, Manistee, Mount Pleasant, Muskegon Heights, Center Line, Houghton, Escanaba, Big Rapids, and Ecorse.


