Welcome to the happiest places in Oregon.
Using Saturday Night Science and data, we determined the cities and towns with the most rainbows, butterflies, puppies, and unicorns.
You know, the places where people have jobs, white-picked fences, and friendly neighbors – unicorn cities.
After analyzing the 80 largest cities, we happily present the happiest cities in the Beaver State.
Table Of Contents: Top Ten | Methodology | Summary | Table
The 10 Happiest Places In Oregon
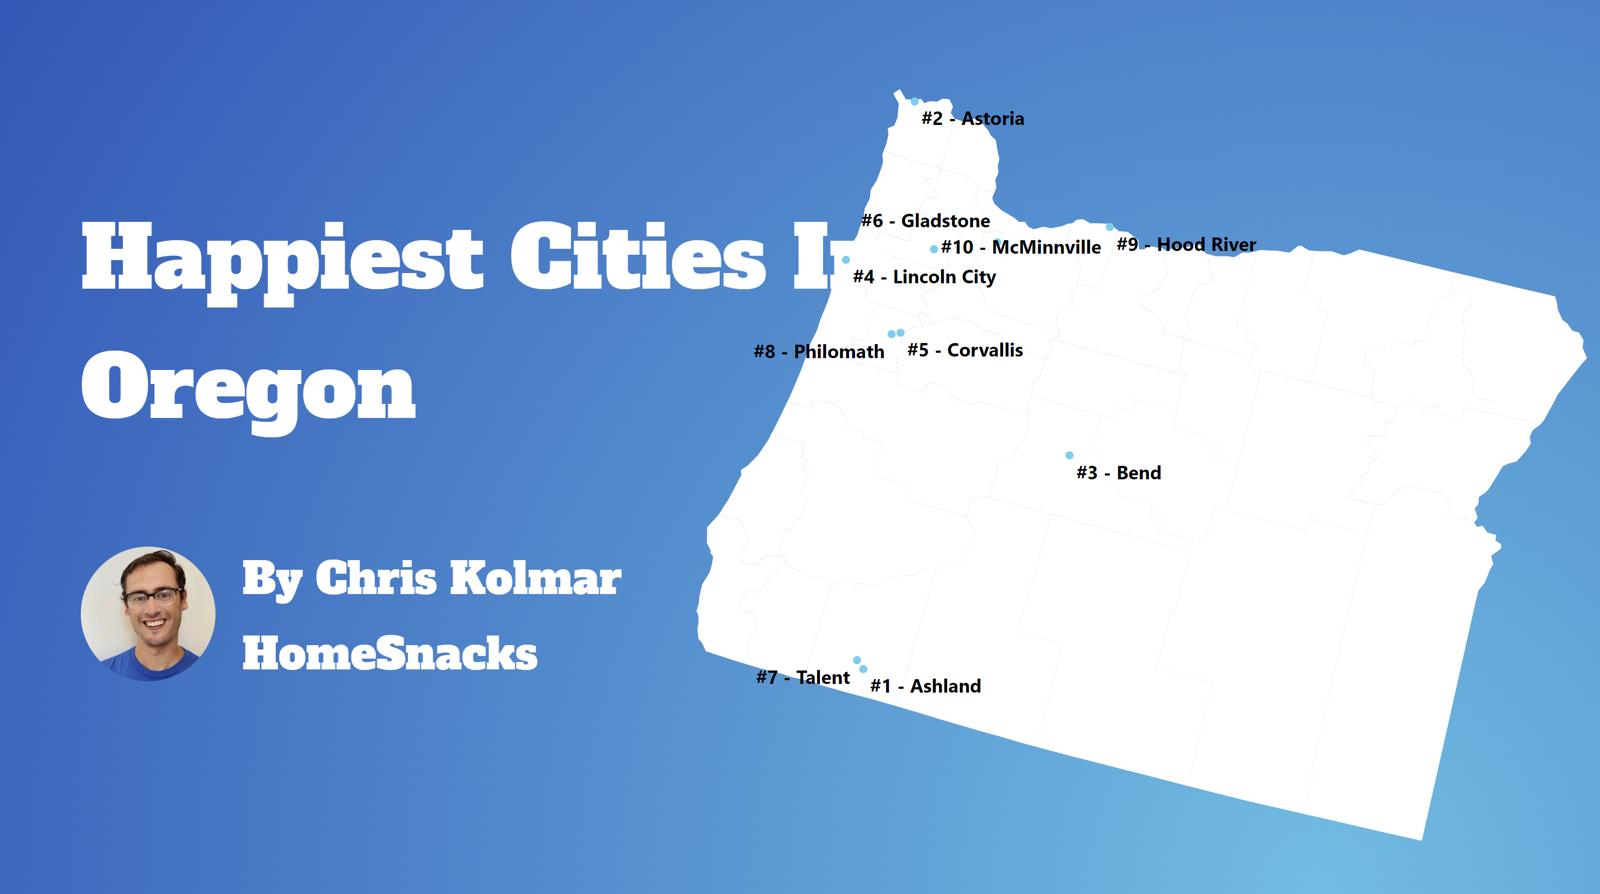
Read on below to see how we crunched the numbers and how your town ranked. If you have a smile on your face, you probably live in one of these cities.
Oh, and by the way, Milton-Freewater is the most miserable place in Oregon.
For more Oregon reading, check out:
The 10 Happiest Places In Oregon For 2026

/10
Population: 59,960
Poverty Level: 24.3%
Median Home Price $555,988
Married Households 7.0%
Households With Kids 19.62%
More on Corvallis: Data | Crime | Cost Of Living | Movers
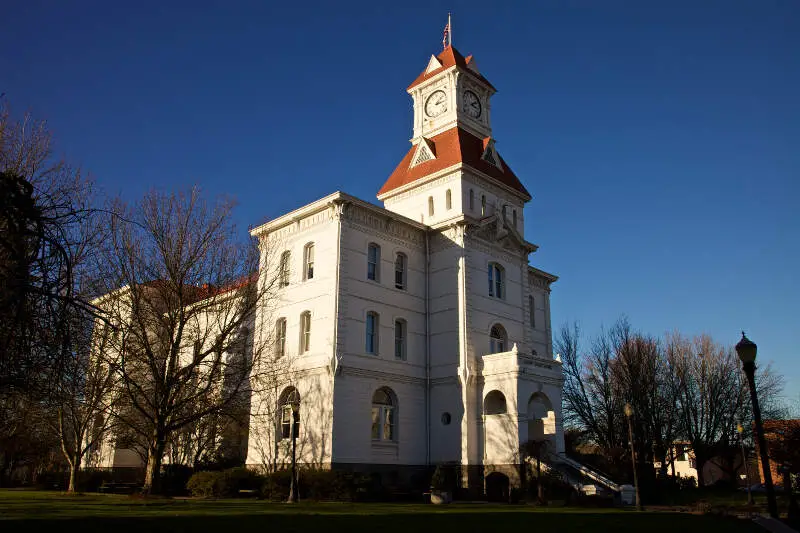
Corvallis is by far the happiest place in the state of Oregon. Let’s see why.
First off, having a solid family life is a good indication of how happy someone is. Lots of the residents of Corvallis aren’t missing out on love; more than 7% of them are married. Plus, the average commute time here is only about 16 minutes each way. That means a lot more time with the spouse and kids.

/10
Population: 8,361
Poverty Level: 10.8%
Median Home Price $712,509
Married Households 11.0%
Households With Kids 30.74%
More on Hood River: Data | Crime | Cost Of Living | Movers
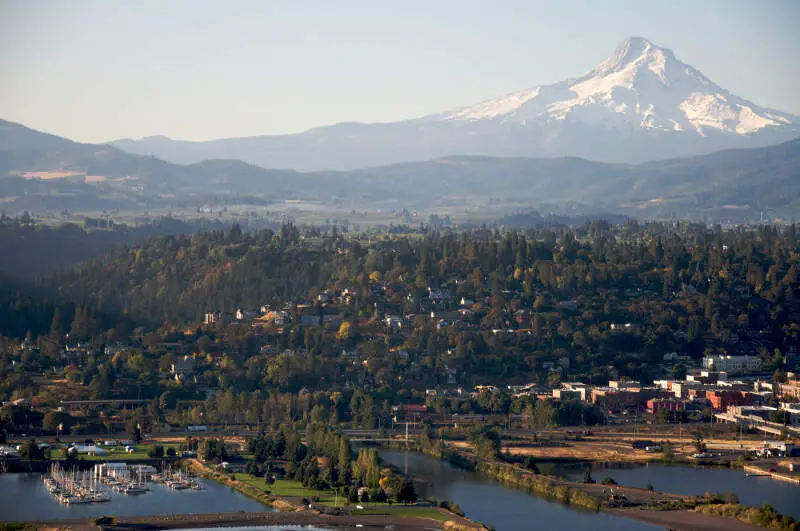
Things look to be pretty pleasant in Hood River. Crime is really low here, and the percentage of married residents (11%) mean there’s lots of stability at home.
In addition to those factors, there is a thriving amount of community involvement. Studies have shown that a key factor to happiness is when people volunteer, especially in their own neighborhoods.

/10
Population: 103,390
Poverty Level: 8.8%
Median Home Price $732,649
Married Households 11.0%
Households With Kids 26.88%
More on Bend: Data | Crime | Cost Of Living | Movers
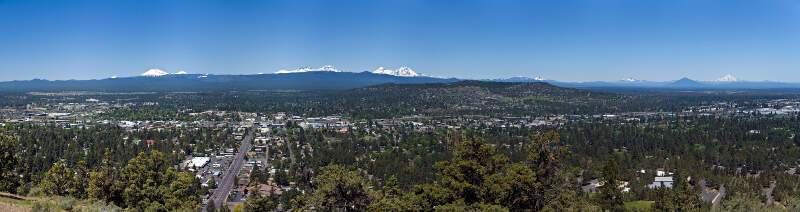
The people who live in Bend have a lot going for them. 52% of them have college degrees, and they command some of the highest salaries in OR. 11% of the people here are married.
Most of these all tops in the entire state.

/10
Population: 21,259
Poverty Level: 15.2%
Median Home Price $551,385
Married Households 6.0%
Households With Kids 15.15%
More on Ashland: Data | Crime | Cost Of Living | Movers
Ashland is where you can bet there are lots of smiley and happy people all over town. Crime is essentially something that just doesn’t happen here very often. And when you can let your guard down and relax a little, the lack of stress really makes a difference.
Same goes on the job front. Only 6.2% of residents here are out of work. Sounds like there are jobs for just about everyone who wants one. Which must be a good feeling to have.

/10
Population: 13,058
Poverty Level: 20.9%
Median Home Price $298,759
Married Households 22.0%
Households With Kids 23.09%
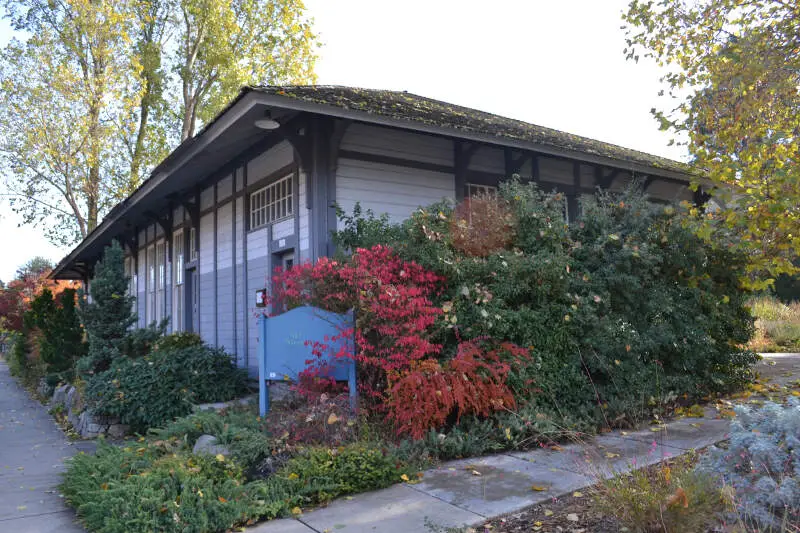
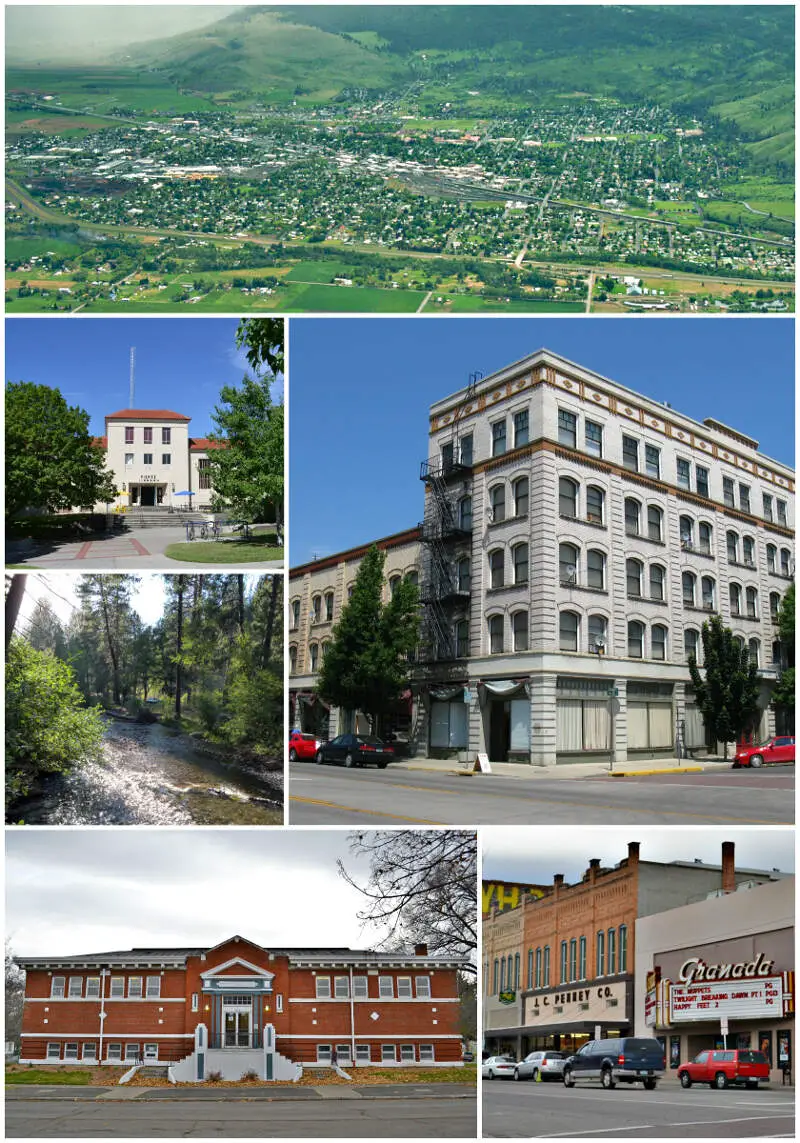
More on La Grande: Data | Crime | Cost Of Living | Movers
If you want to see a bunch of happy people, go to La Grande. It seriously looks like something out of a commercial.
They have a 13 minute commute time, which means lots more time with the kids.
/10
Population: 5,642
Poverty Level: 7.2%
Median Home Price $518,378
Married Households 16.0%
Households With Kids 22.6%
More on Philomath: Data | Crime | Cost Of Living | Movers
For those who say that money doesn’t buy happiness, you’re half right. Studies have shown that people are happy up to a certain point when it comes to annual salaries, somewhere around $72,000 a year. After that, it doesn’t matter how much you make, you’re not going to be much happier.
The residents of Philomath have that covered. Plus about 16% of households are married.

/10
Population: 10,109
Poverty Level: 16.8%
Median Home Price $474,605
Married Households 13.0%
Households With Kids 19.99%
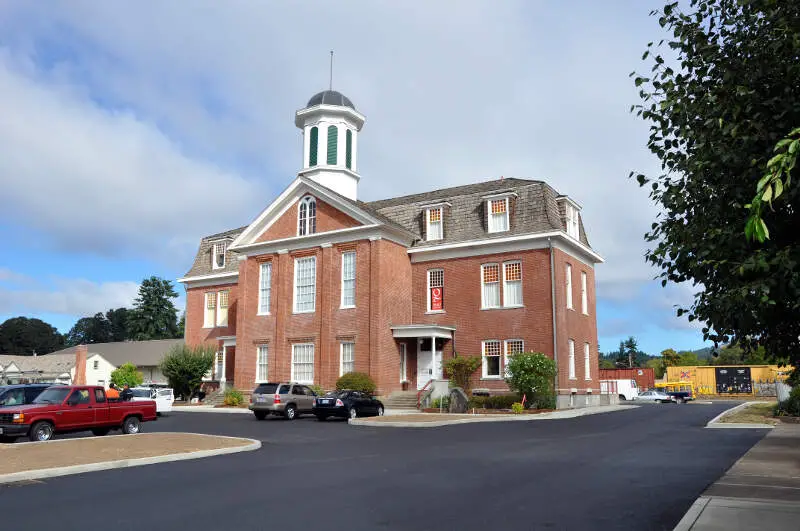
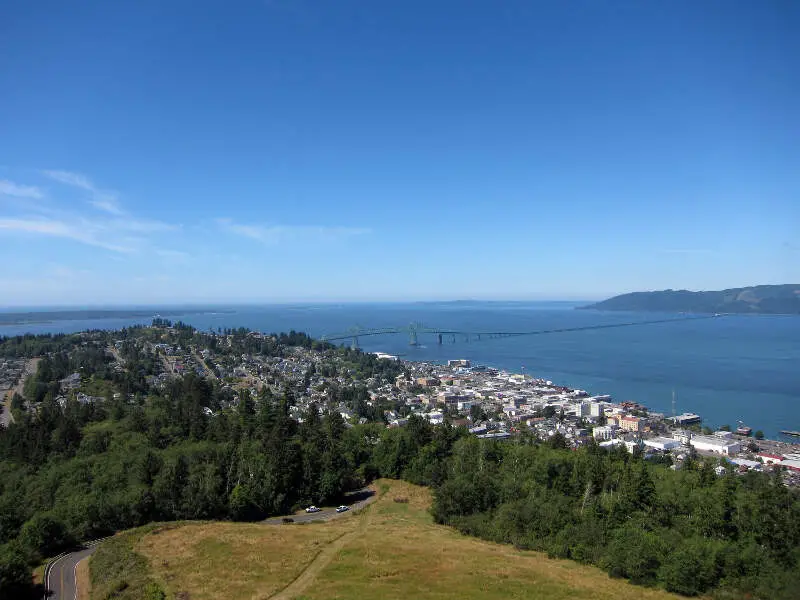
More on Astoria: Data | Crime | Cost Of Living | Movers
Most of the people in Astoria have to be âplum’ happy. True happiness is âHome Sweet Home’ with your kids and spouse, being reminded to do chores, run errands and fold the clothes right.


/10
Population: 27,763
Poverty Level: 10.0%
Median Home Price $638,736
Married Households 15.0%
Households With Kids 31.0%
More on Tualatin: Data | Crime | Cost Of Living | Movers
Less than 4.4% of the residents in Tualatin are jobless, which is just about as low as you’ll see.
Incomes are steady, and commute times are really low as well. That really takes away the stress factors that stop folks from relaxing and enjoying their âdown time’ to do the little things that matter: Walks in the park, time alone with a book and extra face time with the children.

/10
Population: 10,735
Poverty Level: 17.5%
Median Home Price $479,771
Married Households 14.0%
Households With Kids 22.96%
More on Fairview: Data | Cost Of Living | Movers
About 24% of residents in Fairview, OR have a college degree. While we’ve all heard the saying, âIgnorance is bliss,’ our argument is: Ignorance is also broke.
Not only are most of the residents of Fairview smart, they’re safe, too.

/10
Population: 40,381
Poverty Level: 3.4%
Median Home Price $882,924
Married Households 14.0%
Households With Kids 30.67%
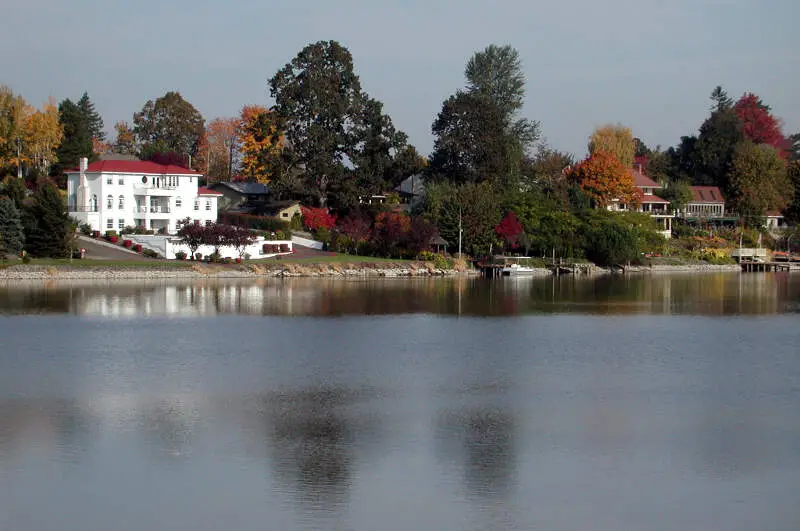
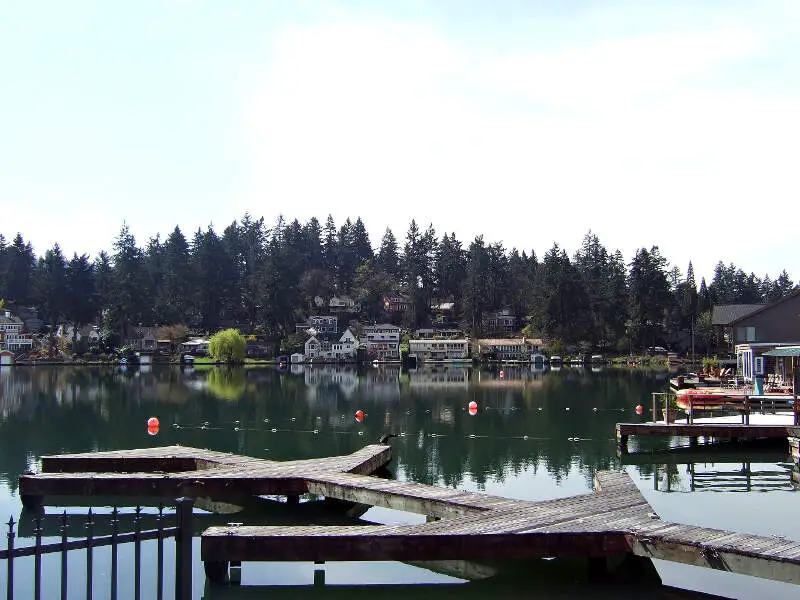
More on Lake Oswego: Data | Crime | Cost Of Living | Movers
In Lake Oswego, most of the population is married, and most own their own homes.
The commute times (21 minutes each way) might eventually start to turn the corners of those smiles sideways.
But for now, it’s all roses in Lake Oswego.
Methodology: How We Measured The Happiest Cities In The Beaver State
To rank the happiest places in Oregon, we had to determine what criteria make people happy. It isn’t a stretch to assume that happy people earn great salaries, are relatively stress-free, and have a stable home life.
So we went to the Census’s American Community Survey 2020-2024 report for the happy criteria, added some Saturday Night Science, and generated the answer.
Here are the criteria we used to measure happiness:
- Percentage of residents with a college degree
- Average commute times
- Unemployment rates
- Cost of living
- % of married couples
- % of families with kids
- Poverty rate
After we decided on the criteria, we gathered the data for the 80 places in Oregon with over 5,000 people.
We then ranked each place from one to 80 for each of the seven criteria, with a score of one being the happiest.
Next, we averaged the seven rankings into a Happy Index for each place with the lowest overall Happy Index “earning” the title “Happiest City In Oregon.”
If you’d like to see the complete list of cities, happiest to saddest, scroll to the bottom of this post to see the unabridged chart.
We updated this article for 2026, and it’s our eleventh time ranking the happiest cities in Oregon.
There You Have It – The Happiest Cities In Oregon
As we said earlier, trying to determine the most miserable cities in Oregon is usually a subjective matter.
But if you’re analyzing cities where people are not stable, where you’re stuck in traffic, and no one spent the time to go to college, then this is an accurate list.
The happiest cities in Oregon are Corvallis, Hood River, Bend, Ashland, La Grande, Philomath, Astoria, Tualatin, Fairview, and Lake Oswego.
If you’re curious enough, here are the most miserable cities in Oregon, according to science:
- Milton-Freewater
- Umatilla
- Sheridan
For more Oregon reading, check out:
- Best Places To Live In Oregon
- Cheapest Places To Live In Oregon
- Most Dangerous Cities In Oregon
- Richest Cities In Oregon
- Safest Places In Oregon
- Worst Places To Live In Oregon
- Most Expensive Places To Live In Oregon
Happiest Cities In Oregon For 2026
| Rank | City | Population | Poverty Level | Median Home Value | % Married | % Kids |
|---|---|---|---|---|---|---|
| 1 | Corvallis, OR | 59,960 | 24.3% | $555,988 | 7.0% | 19.62% |
| 2 | Hood River, OR | 8,361 | 10.8% | $712,509 | 11.0% | 30.74% |
| 3 | Bend, OR | 103,390 | 8.8% | $732,649 | 11.0% | 26.88% |
| 4 | Ashland, OR | 21,259 | 15.2% | $551,385 | 6.0% | 15.15% |
| 5 | La Grande, OR | 13,058 | 20.9% | $298,759 | 22.0% | 23.09% |
| 6 | Philomath, OR | 5,642 | 7.2% | $518,378 | 16.0% | 22.6% |
| 7 | Astoria, OR | 10,109 | 16.8% | $474,605 | 13.0% | 19.99% |
| 8 | Tualatin, OR | 27,763 | 10.0% | $638,736 | 15.0% | 31.0% |
| 9 | Fairview, OR | 10,735 | 17.5% | $479,771 | 14.0% | 22.96% |
| 10 | Lake Oswego, OR | 40,381 | 3.4% | $882,924 | 14.0% | 30.67% |
| 11 | King City, OR | 5,073 | 8.7% | $464,245 | 16.0% | 13.67% |
| 12 | Estacada, OR | 5,152 | 23.8% | $540,538 | 29.0% | 32.16% |
| 13 | Canby, OR | 18,134 | 7.9% | $590,607 | 27.0% | 31.46% |
| 14 | Gladstone, OR | 11,977 | 13.6% | $517,792 | 21.0% | 23.43% |
| 15 | Eugene, OR | 179,591 | 19.0% | $473,231 | 11.0% | 21.14% |
| 16 | Brookings, OR | 6,703 | 16.9% | $477,228 | 6.0% | 28.56% |
| 17 | Seaside, OR | 7,192 | 17.6% | $465,275 | 13.0% | 15.09% |
| 18 | Tigard, OR | 56,011 | 6.7% | $608,407 | 17.0% | 30.57% |
| 19 | Junction City, OR | 6,947 | 9.5% | $478,165 | 30.0% | 22.25% |
| 20 | Winston, OR | 5,690 | 23.6% | $313,138 | 18.0% | 26.43% |
| 21 | Talent, OR | 6,254 | 11.7% | $430,817 | 10.0% | 19.54% |
| 22 | Roseburg, OR | 23,778 | 22.4% | $361,700 | 15.0% | 28.64% |
| 23 | Silverton, OR | 10,456 | 10.6% | $546,989 | 21.0% | 36.86% |
| 24 | Oregon City, OR | 37,755 | 6.8% | $603,703 | 27.0% | 31.52% |
| 25 | Beaverton, OR | 97,812 | 10.1% | $530,794 | 11.0% | 27.51% |
| 26 | Baker City, OR | 10,210 | 14.0% | $264,325 | 25.0% | 26.59% |
| 27 | Newport, OR | 10,583 | 16.2% | $445,960 | 9.0% | 18.81% |
| 28 | Portland, OR | 641,165 | 12.7% | $534,638 | 9.0% | 22.0% |
| 29 | Mcminnville, OR | 34,596 | 16.0% | $484,841 | 15.0% | 29.95% |
| 30 | Stayton, OR | 8,292 | 10.5% | $463,064 | 30.0% | 38.02% |
| 31 | Redmond, OR | 36,092 | 9.6% | $514,637 | 19.0% | 33.02% |
| 32 | Warrenton, OR | 6,327 | 7.0% | $498,702 | 18.0% | 27.71% |
| 33 | Scappoose, OR | 8,179 | 7.2% | $489,282 | 33.0% | 30.04% |
| 34 | Lincoln City, OR | 9,968 | 14.1% | $491,268 | 12.0% | 21.0% |
| 35 | Central Point, OR | 19,216 | 6.7% | $418,192 | 20.0% | 31.89% |
| 36 | North Bend, OR | 10,171 | 14.0% | $355,605 | 17.0% | 28.29% |
| 37 | Milwaukie, OR | 21,392 | 7.9% | $519,433 | 19.0% | 25.08% |
| 38 | Sherwood, OR | 20,307 | 4.3% | $633,004 | 19.0% | 45.35% |
| 39 | Forest Grove, OR | 26,529 | 15.4% | $525,622 | 16.0% | 33.93% |
| 40 | Albany, OR | 56,839 | 13.5% | $435,935 | 21.0% | 32.21% |
| 41 | Medford, OR | 86,315 | 13.2% | $406,688 | 15.0% | 30.64% |
| 42 | West Linn, OR | 26,935 | 5.5% | $777,228 | 16.0% | 37.03% |
| 43 | Coos Bay, OR | 15,925 | 15.3% | $323,164 | 14.0% | 20.87% |
| 44 | Pendleton, OR | 16,950 | 15.0% | $295,556 | 20.0% | 36.14% |
| 45 | Newberg, OR | 26,066 | 7.1% | $530,484 | 16.0% | 30.57% |
| 46 | Wilsonville, OR | 26,974 | 8.8% | $635,208 | 15.0% | 28.98% |
| 47 | Springfield, OR | 61,499 | 14.9% | $414,617 | 17.0% | 30.6% |
| 48 | Hillsboro, OR | 108,231 | 8.5% | $522,557 | 11.0% | 29.48% |
| 49 | Florence, OR | 9,482 | 10.3% | $435,247 | 11.0% | 14.5% |
| 50 | Klamath Falls, OR | 22,115 | 23.4% | $308,370 | 15.0% | 28.9% |
| 51 | Lebanon, OR | 19,344 | 17.8% | $391,198 | 20.0% | 24.92% |
| 52 | Creswell, OR | 5,621 | 4.3% | $468,603 | 31.0% | 41.01% |
| 53 | Salem, OR | 178,865 | 14.4% | $436,317 | 15.0% | 31.83% |
| 54 | Dallas, OR | 17,531 | 15.5% | $474,062 | 22.0% | 28.65% |
| 55 | Troutdale, OR | 15,923 | 7.4% | $492,004 | 21.0% | 33.24% |
| 56 | Happy Valley, OR | 26,738 | 7.7% | $681,241 | 17.0% | 39.92% |
| 57 | Independence, OR | 10,199 | 12.5% | $425,945 | 17.0% | 33.29% |
| 58 | Keizer, OR | 39,082 | 8.1% | $450,014 | 22.0% | 32.08% |
| 59 | Monmouth, OR | 11,428 | 16.1% | $473,961 | 13.0% | 29.03% |
| 60 | Ontario, OR | 11,842 | 21.0% | $305,608 | 14.0% | 30.91% |
| 61 | The Dalles, OR | 15,917 | 11.0% | $389,438 | 16.0% | 24.12% |
| 62 | Tillamook, OR | 5,218 | 11.8% | $459,170 | 16.0% | 34.66% |
| 63 | Sutherlin, OR | 8,599 | 12.6% | $345,331 | 21.0% | 20.95% |
| 64 | Sandy, OR | 12,854 | 7.8% | $523,759 | 27.0% | 39.23% |
| 65 | Cottage Grove, OR | 10,698 | 10.7% | $395,746 | 19.0% | 31.86% |
| 66 | Eagle Point, OR | 9,839 | 10.0% | $470,636 | 22.0% | 31.6% |
| 67 | Veneta, OR | 5,200 | 8.6% | $435,477 | 22.0% | 36.85% |
| 68 | Gresham, OR | 112,378 | 13.0% | $471,181 | 17.0% | 32.59% |
| 69 | Grants Pass, OR | 39,311 | 14.4% | $398,231 | 14.0% | 34.42% |
| 70 | Sweet Home, OR | 10,078 | 19.4% | $350,175 | 23.0% | 24.82% |
| 71 | Prineville, OR | 11,470 | 16.2% | $425,758 | 22.0% | 34.15% |
| 72 | Molalla, OR | 10,186 | 4.3% | $497,975 | 28.0% | 42.26% |
| 73 | St. Helens, OR | 14,258 | 10.0% | $425,039 | 20.0% | 35.63% |
| 74 | Woodburn, OR | 27,875 | 16.3% | $425,247 | 9.0% | 32.34% |
| 75 | Madras, OR | 7,676 | 17.7% | $358,033 | 15.0% | 44.44% |
| 76 | Hermiston, OR | 19,546 | 10.1% | $339,211 | 13.0% | 48.07% |
| 77 | Cornelius, OR | 14,255 | 9.1% | $485,774 | 11.0% | 33.14% |
| 78 | Sheridan, OR | 6,339 | 12.0% | $402,546 | 13.0% | 26.8% |
| 79 | Umatilla, OR | 7,508 | 17.4% | $291,017 | 10.0% | 38.3% |
| 80 | Milton-Freewater, OR | 7,036 | 12.6% | $250,755 | 6.0% | 40.86% |


