Oxford, AL
Demographics And Statistics
Living In Oxford, Alabama Summary
Life in Oxford research summary. HomeSnacks has been using Saturday Night Science to research the quality of life in Oxford over the past nine years using Census, FBI, Zillow, and other primary data sources. Based on the most recently available data, we found the following about life in Oxford:
The population in Oxford is 22,063.
The median home value in Oxford is $190,344.
The median income in Oxford is $70,065.
The cost of living in Oxford is 91 which is 0.9x lower than the national average.
The median rent in Oxford is $882.
The unemployment rate in Oxford is 4.8%.
The poverty rate in Oxford is 14.9%.
The average high in Oxford is 72.7° and the average low is 49.2°.
Table Of Contents
Oxford SnackAbility
Overall SnackAbility
Oxford, AL Cost Of Living
Cost of living in Oxford summary. We use data on the cost of living to determine how expensive it is to live in Oxford. Real estate prices drive most of the variance in cost of living around Alabama. Key points include:
The cost of living in Oxford is 91 with 100 being average.
The cost of living in Oxford is 0.9x lower than the national average.
The median home value in Oxford is $190,344.
The median income in Oxford is $70,065.
Oxford's Overall Cost Of Living
Lower Than The National Average
Cost Of Living In Oxford Comparison Table
| Living Expense | Oxford | Alabama | National Average | |
|---|---|---|---|---|
| Overall | 91 | 90 | 100 | |
| Services | 92 | 97 | 100 | |
| Groceries | 92 | 98 | 100 | |
| Health | 78 | 86 | 100 | |
| Housing | 79 | 74 | 100 | |
| Transportation | 94 | 93 | 100 | |
| Utilities | 125 | 102 | 100 | |
Oxford, AL Weather
The average high in Oxford is 72.7° and the average low is 49.2°.
There are 76.3 days of precipitation each year.
Expect an average of 52.4 inches of precipitation each year with 1.0 inches of snow.
| Stat | Oxford |
|---|---|
| Average Annual High | 72.7 |
| Average Annual Low | 49.2 |
| Annual Precipitation Days | 76.3 |
| Average Annual Precipitation | 52.4 |
| Average Annual Snowfall | 1.0 |
Average High
Days of Rain
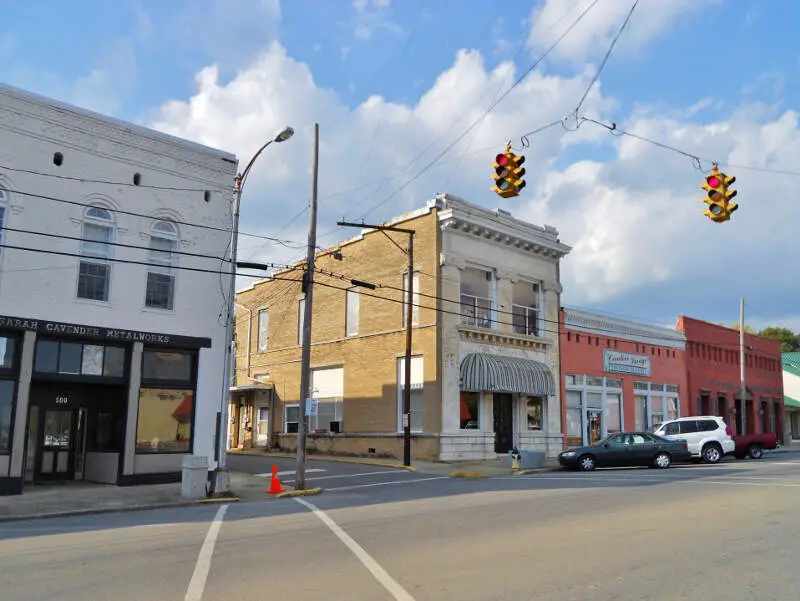
Oxford, AL Photos


Rankings for Oxford in Alabama


Locations Around Oxford
Map Of Oxford, AL
Best Places Around Oxford
Bremen, GA
Population 7,364
Cedartown, GA
Population 10,211
Gadsden, AL
Population 33,617
Anniston, AL
Population 21,377
Talladega, AL
Population 15,041
Sylacauga, AL
Population 12,388
Jacksonville, AL
Population 14,345
Saks, AL
Population 10,727
Irondale, AL
Population 13,462
Moody, AL
Population 13,378
Oxford Demographics And Statistics
Population over time in Oxford
The current population in Oxford is 22,063. The population has increased 5.2% from 2010.
| Year | Population | % Change |
|---|---|---|
| 2023 | 22,063 | 0.2% |
| 2022 | 22,019 | -0.9% |
| 2021 | 22,210 | 4.4% |
| 2020 | 21,282 | -0.2% |
| 2019 | 21,323 | 0.5% |
| 2018 | 21,208 | -0.1% |
| 2017 | 21,231 | 0.1% |
| 2016 | 21,202 | -0.2% |
| 2015 | 21,243 | -0.0% |
| 2014 | 21,250 | -0.2% |
| 2013 | 21,287 | 0.2% |
| 2012 | 21,234 | 0.6% |
| 2011 | 21,106 | 0.7% |
| 2010 | 20,967 | - |
Race / Ethnicity in Oxford
Oxford is:
73.0% White with 16,111 White residents.
16.3% African American with 3,597 African American residents.
0.0% American Indian with 0 American Indian residents.
1.1% Asian with 245 Asian residents.
0.0% Hawaiian with 0 Hawaiian residents.
0.1% Other with 26 Other residents.
3.2% Two Or More with 697 Two Or More residents.
6.3% Hispanic with 1,387 Hispanic residents.
| Race | Oxford | AL | USA |
|---|---|---|---|
| White | 73.0% | 63.8% | 58.2% |
| African American | 16.3% | 25.9% | 12.0% |
| American Indian | 0.0% | 0.3% | 0.5% |
| Asian | 1.1% | 1.4% | 5.7% |
| Hawaiian | 0.0% | 0.0% | 0.2% |
| Other | 0.1% | 0.3% | 0.5% |
| Two Or More | 3.2% | 2.9% | 3.9% |
| Hispanic | 6.3% | 5.4% | 19.0% |
Gender in Oxford
Oxford is 47.1% female with 10,391 female residents.
Oxford is 52.9% male with 11,671 male residents.
| Gender | Oxford | AL | USA |
|---|---|---|---|
| Female | 47.1% | 51.5% | 50.5% |
| Male | 52.9% | 48.5% | 49.5% |
Highest level of educational attainment in Oxford for adults over 25
5.0% of adults in Oxford completed < 9th grade.
9.0% of adults in Oxford completed 9-12th grade.
28.0% of adults in Oxford completed high school / ged.
22.0% of adults in Oxford completed some college.
11.0% of adults in Oxford completed associate's degree.
14.0% of adults in Oxford completed bachelor's degree.
9.0% of adults in Oxford completed master's degree.
1.0% of adults in Oxford completed professional degree.
1.0% of adults in Oxford completed doctorate degree.
| Education | Oxford | AL | USA |
|---|---|---|---|
| < 9th Grade | 5.0% | 4.0% | 5.0% |
| 9-12th Grade | 9.0% | 8.0% | 6.0% |
| High School / GED | 28.0% | 30.0% | 26.0% |
| Some College | 22.0% | 21.0% | 19.0% |
| Associate's Degree | 11.0% | 9.0% | 9.0% |
| Bachelor's Degree | 14.0% | 17.0% | 21.0% |
| Master's Degree | 9.0% | 8.0% | 10.0% |
| Professional Degree | 1.0% | 2.0% | 2.0% |
| Doctorate Degree | 1.0% | 1.0% | 2.0% |
Household Income For Oxford, Alabama
5.8% of households in Oxford earn Less than $10,000.
2.9% of households in Oxford earn $10,000 to $14,999.
6.8% of households in Oxford earn $15,000 to $24,999.
10.5% of households in Oxford earn $25,000 to $34,999.
11.2% of households in Oxford earn $35,000 to $49,999.
17.1% of households in Oxford earn $50,000 to $74,999.
18.6% of households in Oxford earn $75,000 to $99,999.
16.1% of households in Oxford earn $100,000 to $149,999.
4.6% of households in Oxford earn $150,000 to $199,999.
6.3% of households in Oxford earn $200,000 or more.
| Income | Oxford | AL | USA |
|---|---|---|---|
| Less than $10,000 | 5.8% | 6.3% | 4.9% |
| $10,000 to $14,999 | 2.9% | 5.0% | 3.6% |
| $15,000 to $24,999 | 6.8% | 9.2% | 6.6% |
| $25,000 to $34,999 | 10.5% | 8.7% | 6.8% |
| $35,000 to $49,999 | 11.2% | 12.2% | 10.4% |
| $50,000 to $74,999 | 17.1% | 16.8% | 15.7% |
| $75,000 to $99,999 | 18.6% | 12.5% | 12.7% |
| $100,000 to $149,999 | 16.1% | 15.2% | 17.4% |
| $150,000 to $199,999 | 4.6% | 7.1% | 9.3% |
| $200,000 or more | 6.3% | 7.2% | 12.6% |


