Everyone wants a bit of a blissful breeze or a scoop of sunny sanctuary when looking for a place to live in Pennsylvania.
The more sun, the more you can go outside. The more you go outside, the more you’ll feel at peace. The more you’ll feel at peace, the more you’ll enjoy where you live.
So it makes sense to try and find the places with the best weather in Pennsylvania. We used Saturday Night Science to compare the number of sunny days, total precipitation, and the deviation from the ideal 70-degree weather for 84 places in Pennsylvania over 10,000 people.
Grab your shades and put away your raincoat as we look at the cities with the best weather in Pennsylvania.
301.5 sunny days · 64.4 degree average high
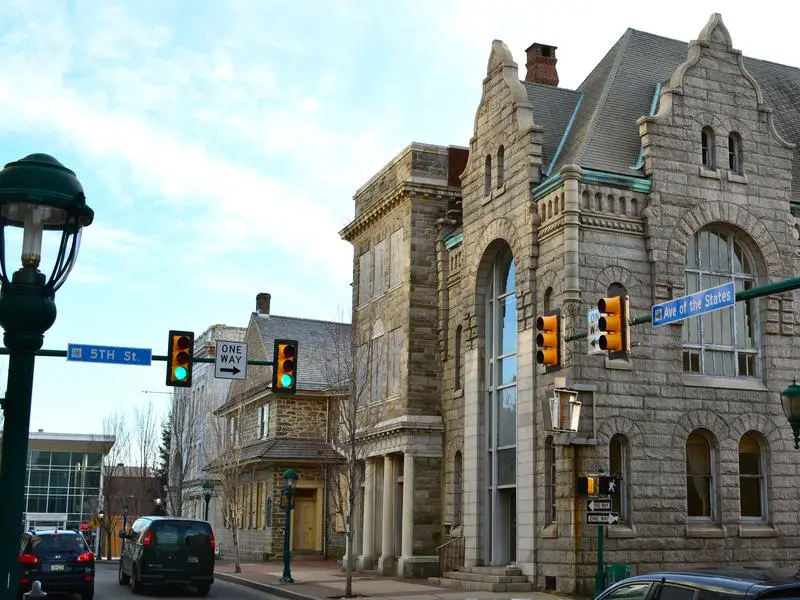
Chester is a city in Delaware County, Pennsylvania, United States, with a population of 33,972 at the 2010 census. Incorporated in 1682, Chester sits on the western bank of the Delaware River between the cities of Philadelphia and Wilmington, Delaware.
Data | Crime | Cost of living | Movers
289.4 sunny days · 64.4 degree average high
291.4 sunny days · 64.1 degree average high
291.4 sunny days · 64.1 degree average high
Broomall is a census-designated place in Delaware County, Pennsylvania, United States. The population was 10,789 at the 2010 census.
291.4 sunny days · 64.1 degree average high
Data | Crime | Cost of living | Movers
289.4 sunny days · 64.6 degree average high
Data | Crime | Cost of living | Movers
301.5 sunny days · 64.6 degree average high
Levittown is a census-designated place and planned community in Bucks County, Pennsylvania, United States, within the Philadelphia metropolitan area. The population was 52,983 at the 2010 census. It is 40 feet above sea level. Though not a municipality, it is sometimes recognized as the largest suburb of Philadelphia in Pennsylvania. Starting with land purchased in 1951, it was planned and built by Levitt & Sons. The brothers Bill Levitt and architect Alfred Levitt designed its six typical houses.
287.2 sunny days · 64.6 degree average high
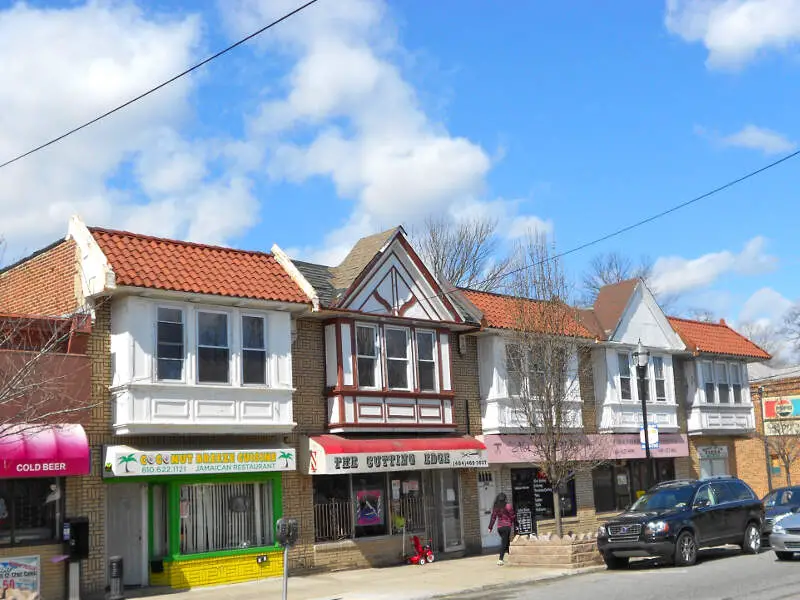
Yeadon is a borough in Delaware County, Pennsylvania, United States. It borders the city of Philadelphia. The population was 11,443 at the 2010 census.
Data | Crime | Cost of living | Movers
289.0 sunny days · 63.1 degree average high
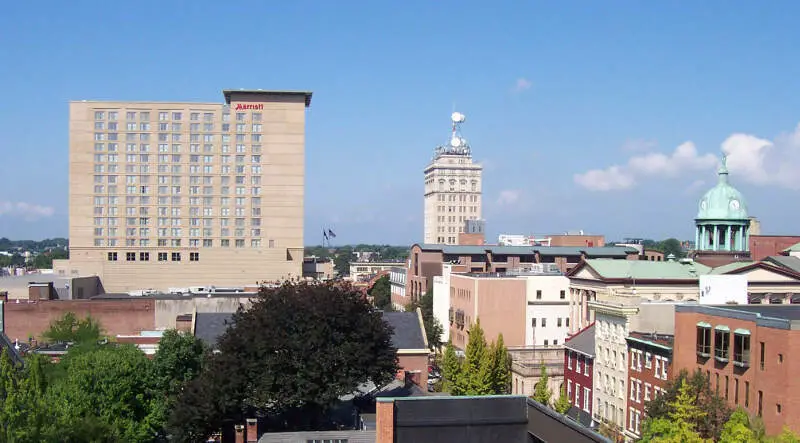
Lancaster is a city located in South Central Pennsylvania which serves as the seat of Pennsylvania’s Lancaster County and one of the oldest inland towns in the United States. With a population of 59,322, it ranks eighth in population among Pennsylvania’s cities. The Lancaster metropolitan area population is 507,766, making it the 101st largest metropolitan area in the U.S. and second largest in the South Central Pennsylvania area.
Data | Crime | Cost of living | Movers
289.1 sunny days · 63.3 degree average high
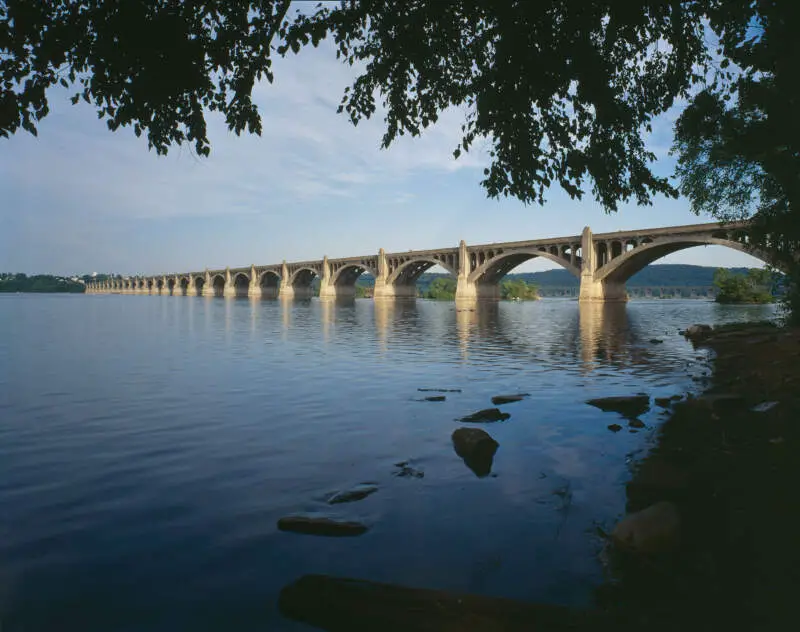
Columbia, formerly Wright’s Ferry, is a borough in Lancaster County, Pennsylvania, 28 miles southeast of Harrisburg on the east bank of the Susquehanna River, across from Wrightsville and York County and just south of U.S. Route 30. The settlement was founded in 1726 by Colonial English Quakers from Chester County led by entrepreneur and evangelist John Wright. Establishment of the eponymous Wright’s Ferry, the first commercial Susquehanna crossing in the region, inflamed territorial conflict with neighboring Maryland but brought growth and prosperity to the small town, which was just a few votes shy of becoming the new United States’ capital. Though besieged for a short while by Civil War destruction, Columbia remained a lively center of transport and industry throughout the 19th century, once serving as a terminus of the Pennsylvania Canal. Later, however, the Great Depression and 20th-century changes in economy and technology sent the borough into decline. It is notable today as the site of one of the world’s few museums devoted entirely to horology.
Data | Crime | Cost of living | Movers
The receipts
Compare the top ten
Pick a metric. The bars rescale. The red line is Pennsylvania’s statewide median.
On the map
Where Pennsylvania’s best weather is
Saturday Night Science
How We Determined The Cities In Pennsylvania With The Best Weather
To rank the most fair weather cities in Pennsylvania, we used Saturday Night Science and the National Oceanic and Atmospheric Administration (NOAA) database, to see which cities in the Keystone State get the best weather.
We used the following criteria to find the best weather:
- Number of sunny days
- Highest average low
- Average high deviation from 70 degrees
- Least amount of rain
- Least amount of snow
We ranked each city of over 10,000 people in Pennsylvania from best to worst on each criterion. We then averaged each ranking into a weather quality index. The city with the best index, Chester, was anointed the city with the best weather in Pennsylvania.
Before we get too far, here are the annual precipitation rates for major cities: Philadelphia (46.6 inches), Pittsburgh (37.5 inches), and Allentown (45.6 inches).
The cities with the best weather in Pennsylvania are Chester, Woodlyn, Drexel Hill, Broomall, Lansdowne, Darby, Levittown, Yeadon, Lancaster, and Columbia.
There’s a complete chart at the bottom.
The full plate
Detailed List Of Places With The Best Weather In Pennsylvania
Click any column to sort. Search by city name.
| Rank | City | Population | Sunny Days | Avg. High | Precipitation (Inches) | Snow (Inches) |
|---|---|---|---|---|---|---|
| 1 | Chester | 34,016 | 301.5 | 64.4 | 43.6 | 11.8 |
| 2 | Woodlyn | 10,249 | 289.4 | 64.4 | 44.1 | 14.4 |
| 3 | Drexel Hill | 27,999 | 291.4 | 64.1 | 45.1 | 15.1 |
| 4 | Broomall | 10,859 | 291.4 | 64.1 | 45.1 | 15.1 |
| 5 | Lansdowne | 10,614 | 291.4 | 64.1 | 45.1 | 15.1 |
| 6 | Darby | 10,693 | 289.4 | 64.6 | 44.8 | 18.2 |
| 7 | Levittown | 51,805 | 301.5 | 64.6 | 47.5 | 11.8 |
| 8 | Yeadon | 11,506 | 287.2 | 64.6 | 45.5 | 17.4 |
| 9 | Lancaster | 59,344 | 289.0 | 63.1 | 43.1 | 19.1 |
| 10 | Columbia | 10,394 | 289.1 | 63.3 | 42.4 | 21.0 |
| 11 | Philadelphia | 1,555,072 | 286.5 | 64.5 | 46.6 | 15.1 |
| 12 | King of Prussia | 19,761 | 289.9 | 63.5 | 46.9 | 18.7 |
| 13 | Horsham | 14,587 | 289.9 | 63.5 | 46.9 | 18.7 |
| 14 | Montgomeryville | 13,104 | 289.9 | 63.5 | 46.9 | 18.7 |
| 15 | Willow Grove | 15,545 | 301.5 | 63.4 | 47.6 | 20.5 |
| 16 | Baldwin | 19,803 | 289.7 | 61.1 | 37.4 | 19.5 |
| 17 | Harrisburg | 49,232 | 290.5 | 62.2 | 42.1 | 27.2 |
| 18 | Ardmore | 12,698 | 284.4 | 63.8 | 46.6 | 15.7 |
| 19 | Reading | 88,057 | 288.9 | 62.4 | 43.6 | 23.2 |
| 20 | Phoenixville | 16,562 | 288.3 | 63.8 | 45.7 | 20.7 |
| 21 | York | 43,853 | 287.1 | 63.3 | 42.5 | 23.9 |
| 22 | Wyomissing | 10,475 | 288.9 | 62.3 | 43.2 | 24.0 |
| 23 | Pott | 22,586 | 284.7 | 63.3 | 45.8 | 15.9 |
| 24 | Lansdale | 16,441 | 291.6 | 63.0 | 47.1 | 20.9 |
| 25 | Norri | 34,500 | 285.4 | 64.0 | 46.5 | 19.7 |
| 26 | Jefferson Hills | 11,115 | 282.2 | 62.0 | 37.1 | 18.4 |
| 27 | Hanover | 15,403 | 288.5 | 62.9 | 43.2 | 25.3 |
| 28 | Weigelstown | 12,684 | 288.5 | 62.9 | 43.2 | 25.3 |
| 29 | Shiloh | 11,652 | 288.5 | 62.9 | 43.2 | 25.3 |
| 30 | McKeesport | 19,637 | 280.1 | 62.2 | 37.5 | 17.1 |
| 31 | Carlisle | 18,945 | 288.2 | 62.6 | 42.4 | 27.6 |
| 32 | Pittsburgh | 305,928 | 286.2 | 61.8 | 37.5 | 27.6 |
| 33 | West Mifflin | 20,237 | 282.2 | 61.4 | 37.6 | 17.0 |
| 34 | Lebanon | 25,555 | 289.4 | 62.0 | 44.4 | 21.3 |
| 35 | Chambersburg | 20,519 | 286.3 | 62.9 | 41.2 | 31.3 |
| 36 | Upper St. Clair | 19,385 | 289.7 | 61.2 | 37.8 | 28.9 |
| 37 | Elizabet | 11,591 | 282.0 | 62.5 | 42.3 | 23.3 |
| 38 | Munhall | 11,351 | 280.1 | 61.7 | 37.7 | 22.8 |
| 39 | Ephrata | 13,617 | 285.7 | 62.7 | 44.4 | 25.4 |
| 40 | South Park Township | 13,504 | 280.1 | 61.4 | 37.1 | 19.5 |
| 41 | Whitehall | 13,920 | 283.1 | 61.6 | 38.2 | 25.9 |
| 42 | Carnot-Moon | 12,546 | 283.1 | 61.6 | 38.2 | 25.9 |
| 44 | Waynesboro | 10,731 | 286.8 | 62.2 | 41.3 | 31.1 |
| 45 | Wilkinsburg | 15,866 | 280.1 | 61.0 | 38.6 | 19.6 |
| 46 | Hershey | 14,469 | 288.6 | 61.5 | 43.8 | 27.6 |
| 47 | Colonial Park | 13,196 | 288.6 | 61.5 | 43.8 | 27.6 |
| 48 | West Chester | 19,181 | 283.0 | 62.9 | 47.0 | 24.4 |
| 49 | Emmaus | 11,342 | 290.6 | 61.7 | 46.5 | 28.9 |
| 51 | Franklin Park | 14,062 | 278.4 | 61.0 | 38.0 | 26.7 |
| 52 | Allentown | 119,261 | 288.2 | 61.8 | 45.6 | 31.5 |
| 53 | Plum | 27,458 | 282.2 | 61.0 | 40.3 | 25.3 |
| 54 | New Kensington | 12,874 | 281.9 | 61.6 | 40.2 | 28.0 |
| 55 | Bethlehem | 75,004 | 286.0 | 61.8 | 44.5 | 33.8 |
| 57 | Wilkes-Barre | 41,108 | 288.4 | 60.3 | 41.0 | 33.4 |
| 58 | Coatesville | 13,152 | 283.0 | 62.6 | 48.6 | 29.2 |
| 59 | Allison Park | 21,864 | 280.1 | 61.4 | 39.2 | 32.3 |
| 60 | Kingston | 13,074 | 288.4 | 60.1 | 40.9 | 34.2 |
| 61 | Easton | 26,996 | 283.1 | 62.4 | 46.7 | 31.5 |
| 62 | Fullerton | 15,662 | 286.5 | 61.6 | 46.4 | 28.9 |
| 63 | Uniontown | 10,150 | 279.7 | 62.5 | 43.1 | 32.4 |
| 64 | Scranton | 76,064 | 287.0 | 59.3 | 38.9 | 49.0 |
| 65 | New Castle | 22,682 | 279.7 | 60.3 | 39.5 | 28.4 |
| 66 | Washington | 13,642 | 261.5 | 61.3 | 39.2 | 30.6 |
| 67 | Altoona | 45,814 | 281.7 | 59.6 | 39.2 | 29.7 |
| 68 | Greensburg | 14,669 | 272.7 | 61.4 | 41.9 | 34.4 |
| 69 | Lower Burrell | 11,593 | 272.7 | 61.4 | 41.9 | 34.4 |
| 70 | Bloomsburg | 14,631 | 282.4 | 60.1 | 42.0 | 31.3 |
| 71 | Williamsport | 29,339 | 283.7 | 60.2 | 42.4 | 33.5 |
| 72 | Berwick | 10,328 | 281.0 | 60.6 | 41.4 | 38.5 |
| 73 | Dunmore | 13,810 | 287.0 | 58.6 | 40.1 | 57.0 |
| 74 | Sharon | 13,754 | 274.6 | 60.6 | 38.4 | 49.8 |
| 75 | State College | 42,129 | 283.3 | 59.1 | 39.6 | 45.1 |
| 76 | Nanticoke | 10,356 | 280.0 | 60.4 | 42.0 | 35.4 |
| 77 | Butler | 13,517 | 276.2 | 60.4 | 40.4 | 34.9 |
| 78 | Hermitage | 16,185 | 274.6 | 59.9 | 38.9 | 52.8 |
| 79 | Mountain Top | 11,378 | 288.4 | 58.2 | 45.8 | 35.3 |
| 80 | Erie | 100,678 | 268.8 | 56.7 | 42.5 | 113.5 |
| 81 | Pottsville | 14,025 | 282.4 | 60.0 | 48.7 | 36.2 |
| 82 | Johnstown | 20,369 | 266.9 | 60.4 | 46.3 | 91.3 |
| 83 | Indiana | 14,050 | 267.1 | 59.5 | 45.3 | 53.8 |
| 84 | Oil City | 10,296 | 269.1 | 58.1 | 45.0 | 62.1 |
| 85 | St. Marys | 12,845 | 269.4 | 55.9 | 44.7 | 57.9 |
| 86 | Meadville | 13,224 | 256.5 | 58.0 | 45.5 | 95.1 |
| 87 | Hazleton | 25,087 | 272.0 | 57.1 | 49.2 | 40.6 |
Source: NOAA climate data. 84 Pennsylvania cities with more than 10,000 residents.
Summary
Summary: The Cities With The Best Weather In Pennsylvania For 2026
If you’re looking for the Pennsylvania cities with the most sunny days, the least rain and snow, and highs closest to a perfect 70 degrees, this is an accurate list.
The cities with the best weather in Pennsylvania are Chester, Woodlyn, Drexel Hill, Broomall, Lansdowne, Darby, Levittown, Yeadon, Lancaster, and Columbia.


