

Most African American cities in Tennessee research summary. We used Saturday Night Science to analyze Tennessee’s most recent Census data to determine the cities with the largest Black population, based on the percentage of Black residents.
The city with the largest African American population in Tennessee is Brownsville (67.0% Black); the least is Mount Carmel (0.0%). Statewide, Tennessee is 15.4% Black — the 10th blackest state in the country.
Roughly 42 million people identifying as Black or African American live in the United States, about 12% of the total population. In Tennessee, the Black population is 1,090,494, at 15.4% of the state total.
We broke down the most recent Census data to determine the cities in Tennessee with the largest African American population in 2026.
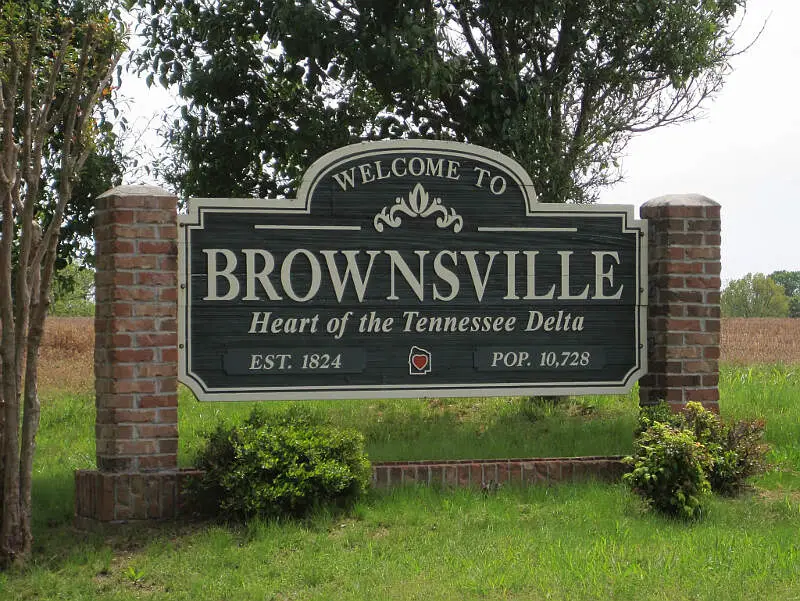
#1 most African American in Tennessee
 Located in
Haywood County, Tennessee
Located in
Haywood County, Tennessee
Brownsville is a city in Haywood County, Tennessee. It is the county seat of Haywood County, which is in the broad delta floodplain near the Mississippi River. Its population as of the 2010 census is 10,292.
Data | Crime | Cost of living | Movers
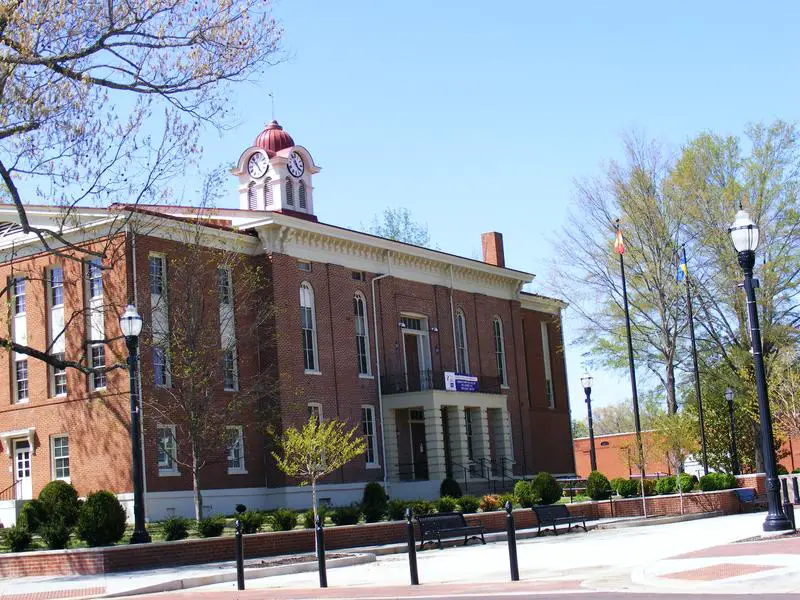
#2 most African American in Tennessee
Bolivar is a city in Hardeman County, Tennessee, United States. As of the 2010 census, the city population was 5,417. It is the county seat of Hardeman County. The town was named for South American revolutionary leader Simn Bolvar.
Data | Crime | Cost of living | Movers
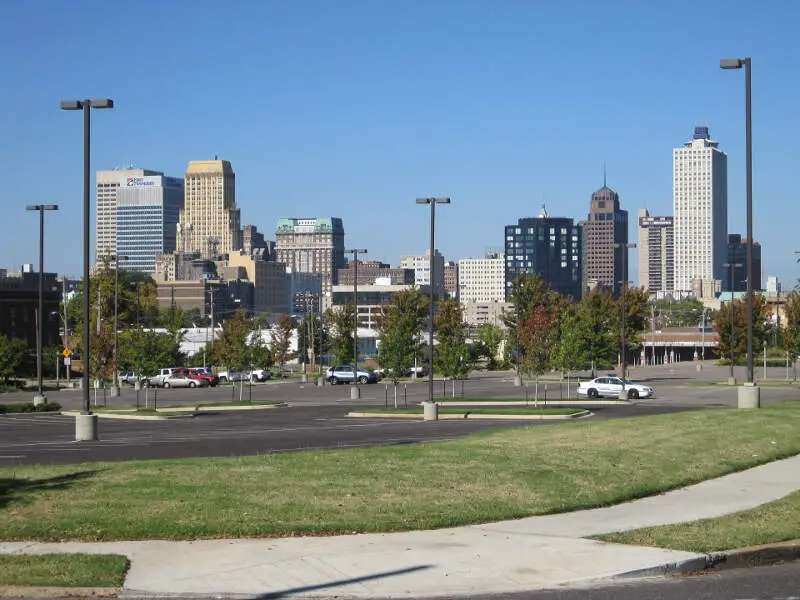
#3 most African American in Tennessee
 Located in
Shelby County, Tennessee
Located in
Shelby County, Tennessee
Memphis is a city in the southwestern corner of the U.S. state of Tennessee and the county seat of Shelby County. The city is located on the fourth Chickasaw Bluff, south of the confluence of the Wolf and Mississippi rivers.
Data | Crime | Cost of living | Movers | Compare
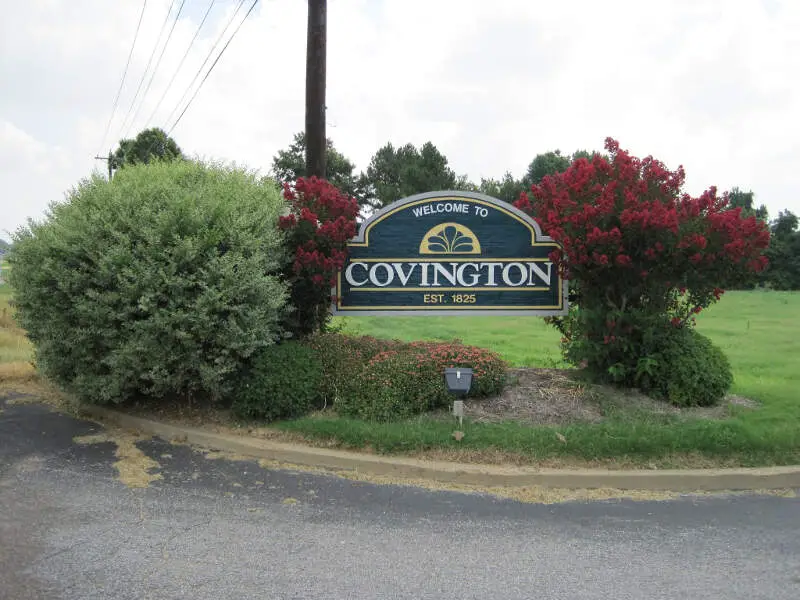
#4 most African American in Tennessee
 Located in
Tipton County, Tennessee
Located in
Tipton County, Tennessee
Covington is a city in central Tipton County, Tennessee, United States. Covington is the largest city and county seat of Tipton County. The city is located in West Tennessee, 12mi east of the Mississippi River. The city’s population was 9,038 at the time of the 2010 U.S. Census. Located 42mi northeast of Memphis, Covington is part of the Memphis, Tennessee Metropolitan Area.
Data | Crime | Cost of living | Movers
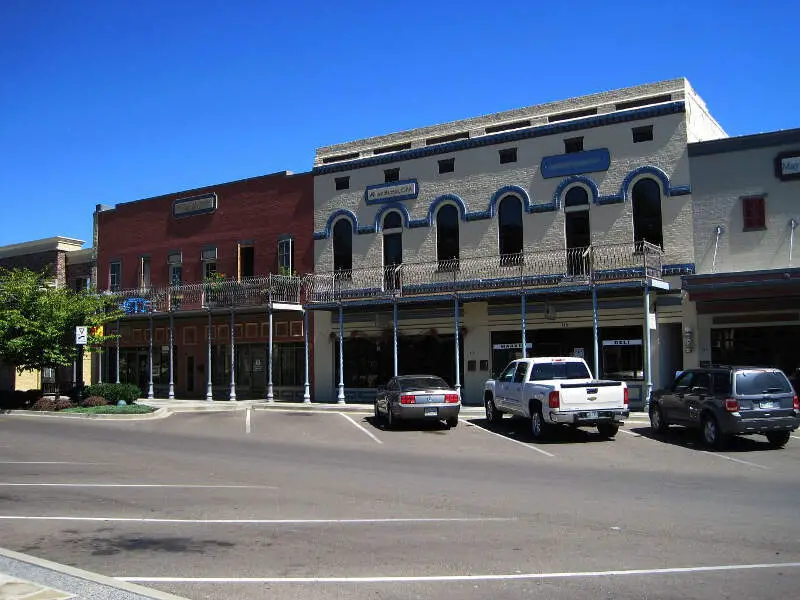
#5 most African American in Tennessee
 Located in
Lauderdale County, Tennessee
Located in
Lauderdale County, Tennessee
Data | Crime | Cost of living | Movers
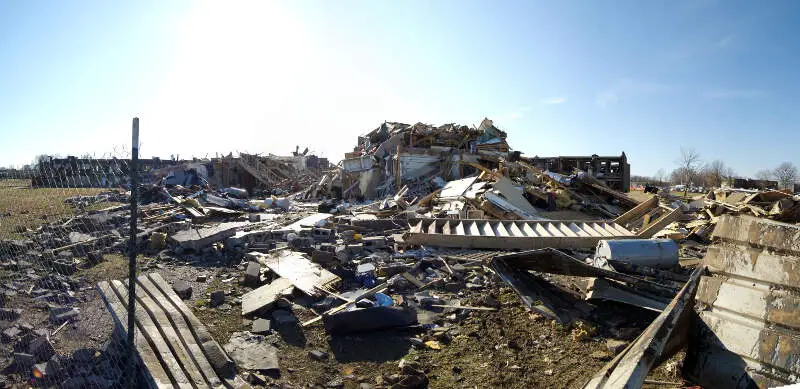
#6 most African American in Tennessee
 Located in
Madison County, Tennessee
Located in
Madison County, Tennessee
Jackson is the county seat of Madison County, Tennessee. Located 70 miles east of Memphis, it is a regional center of trade for West Tennessee. Its total population was 65,211 at the 2010 census and 67,265 in the 2012 Census estimate.
Data | Crime | Cost of living | Movers
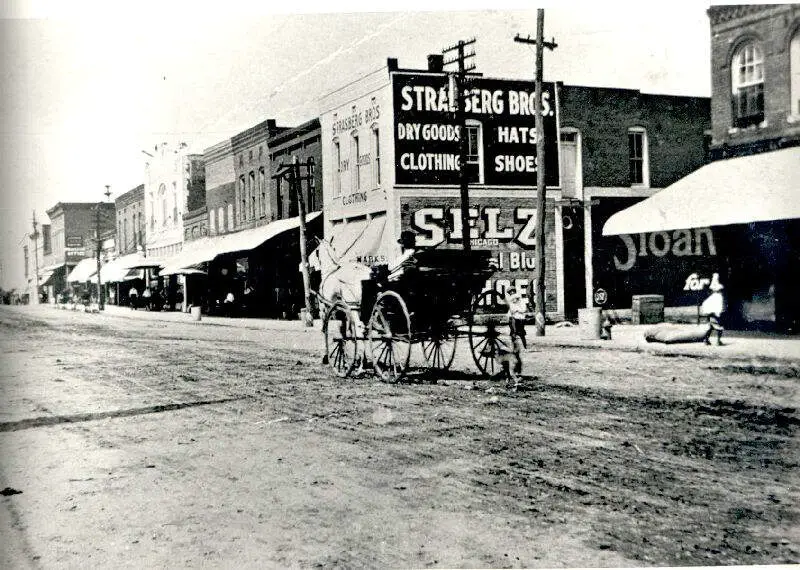
#7 most African American in Tennessee
 Located in
Madison County, Tennessee
Located in
Madison County, Tennessee
Humboldt is a city in Gibson and Madison counties, Tennessee. The population was 8,452 at the 2010 census, a decline of 1,015 from 2000. It is the principal city of and is included in the Humboldt, Tennessee Micropolitan Statistical Area, which is included in the Jackson, Tennessee-Humboldt, Tennessee Combined Statistical Area. It is Gibson County’s largest city and Madison County’s second largest city after Jackson.
Data | Crime | Cost of living | Movers
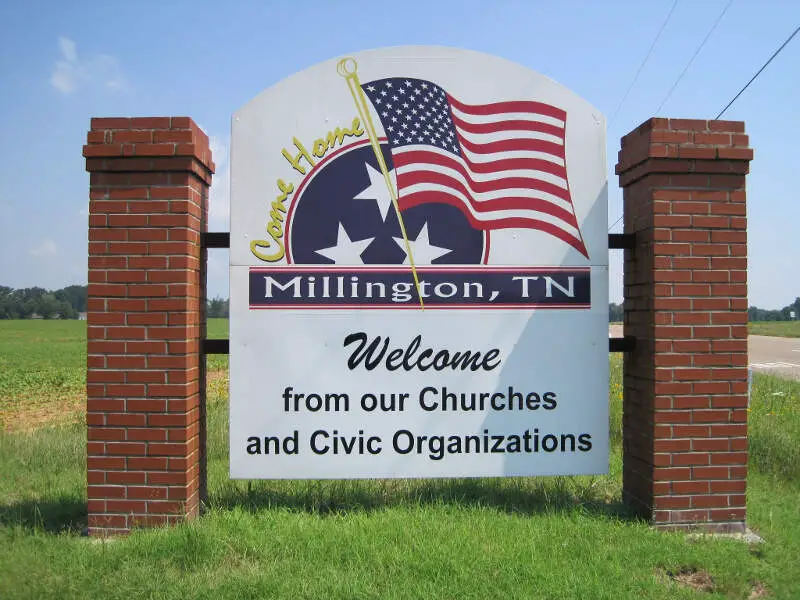
#8 most African American in Tennessee
 Located in
Shelby County, Tennessee
Located in
Shelby County, Tennessee
Millington is a city in Shelby County, Tennessee, United States. As of the 2010 census, it had a population of 10,176. Millington is the home of the Memphis International Raceway. It was granted the title “Flag City Tennessee” by the Tennessee State Legislature. The Naval Support Activity Mid-South is located at the former Memphis Naval Air Station, which was changed functions from a training base to an administrative one in 1993. There is also a general aviation airport that features the third longest runway in Tennessee.
Data | Crime | Cost of living | Movers
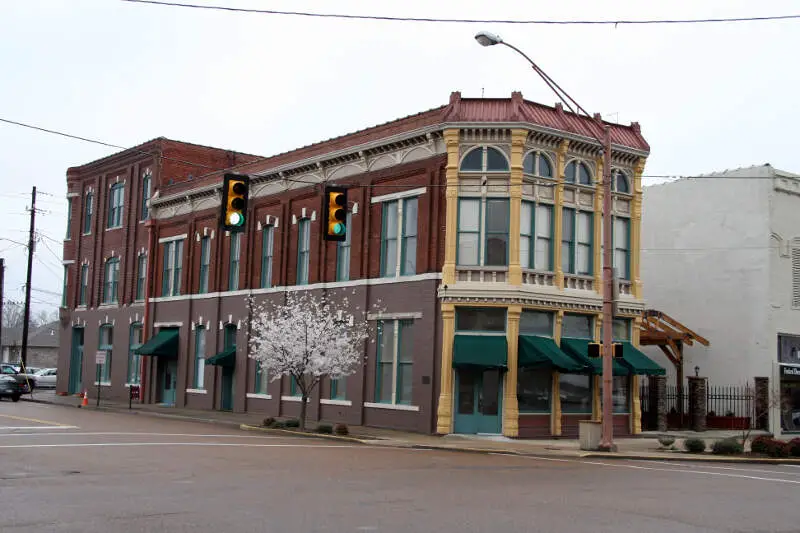
#9 most African American in Tennessee
 Located in
Dyer County, Tennessee
Located in
Dyer County, Tennessee
Dyersburg is a city and the county seat of Dyer County, Tennessee, in the United States. It is located in northwest Tennessee, 79 miles northeast of Memphis on the Forked Deer River. The population was 17,145 at the 2010 census. Dyersburg and Dyer County offer many amenities including quality schools, a low crime rate, moderate climate, low cost of living, and close proximity to area recreation. Dyersburg is a regional retail, medical, employment and cultural center for more than 300,000 people who live in Tennessee, Arkansas and Missouri.
Data | Crime | Cost of living | Movers
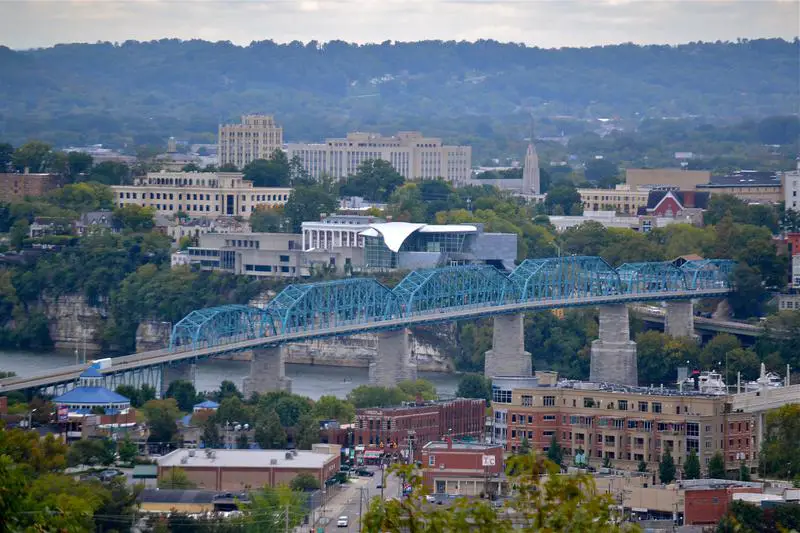
#10 most African American in Tennessee
 Located in
Hamilton County, Tennessee
Located in
Hamilton County, Tennessee
Chattanooga is a city in the U.S. state of Tennessee, with a population of 176,588 in 2015. The fourth-largest Tennessee city, it is the seat of Hamilton County. Located in southeastern Tennessee in East Tennessee, on the Tennessee River, served by multiple railroads and Interstate highways, Chattanooga is a transit hub. Chattanooga lies 120 miles northwest of Atlanta, Georgia, 120 miles southwest of Knoxville, Tennessee, 135 miles southeast of Nashville, Tennessee, 120 miles northeast of Huntsville, Alabama, and 148 miles northeast of Birmingham, Alabama.
Data | Crime | Cost of living | Movers
The receipts
Compare the top ten
Pick a metric. The bars rescale. The red line is Tennessee’s statewide median.
On the map
Where Tennessee’s Black communities live
Saturday Night Science
Methodology: How We Determined The Cities In Tennessee With The Largest Black Population For 2026
We still believe in the accuracy of data — especially from the Census. So that’s where we went to get the race breakdown across Tennessee.
That leads us to the Census’s most recently available data, the 2020-2024 American Community Survey data from the US Census.
Specifically, we looked at table B03002: Hispanic OR LATINO ORIGIN BY RACE. Here are the category names as defined by the Census:
- Hispanic or Latino
- White alone*
- Black or African American alone*
- American Indian and Alaska Native alone*
- Asian alone*
- Native Hawaiian and Other Pacific Islander alone*
- Some other race alone*
- Two or more races*
Our particular column of interest was the number of people who identified as Black or African American.
We limited our analysis to non-CDPs with a population greater than 5,000 people in Tennessee. That left us with 92 cities.
We then calculated the percentage of residents that are Black or African American. The percentages ranked from 67.0% to 0.0%.
Finally, we ranked each city based on the percentage of the Black population, with a higher score being more Black than a lower score. Brownsville took the distinction of being the most Black, while Mount Carmel was the least African American city.
We updated this article for 2026. This is our eleventh time ranking the cities in Tennessee with the largest African American population.
The full plate
African American Population By City In Tennessee
Click any column to sort. Search by city name.
| Rank | City | Population | African American Population | % African American |
|---|---|---|---|---|
| 1 | Brownsville | 9,622 | 6,447 | 67.0% |
| 2 | Bolivar | 5,144 | 3,272 | 63.6% |
| 3 | Memphis | 618,980 | 387,985 | 62.7% |
| 4 | Covington | 8,587 | 4,737 | 55.2% |
| 5 | Ripley | 7,658 | 3,894 | 50.8% |
| 6 | Jackson | 68,435 | 30,086 | 44.0% |
| 7 | Humboldt | 7,787 | 3,291 | 42.3% |
| 8 | Millington | 11,289 | 3,774 | 33.4% |
| 9 | Dyersburg | 15,979 | 4,450 | 27.8% |
| 10 | Chattanooga | 185,783 | 51,198 | 27.6% |
| 11 | Oakland | 9,979 | 2,594 | 26.0% |
| 12 | Goodlettsville | 17,597 | 4,493 | 25.5% |
| 13 | La Vergne | 40,243 | 9,706 | 24.1% |
| 14 | Milan | 8,244 | 1,820 | 22.1% |
| 15 | Clarksville | 176,456 | 38,547 | 21.8% |
| 16 | Pulaski | 8,285 | 1,788 | 21.6% |
| 17 | Springfield | 19,255 | 4,041 | 21.0% |
| 18 | Union City | 10,982 | 2,253 | 20.5% |
| 19 | Bartlett | 56,876 | 11,216 | 19.7% |
| 20 | Smyrna | 56,692 | 10,704 | 18.9% |
| 21 | Fayetteville | 7,057 | 1,295 | 18.4% |
| 22 | Martin | 10,915 | 1,990 | 18.2% |
| 23 | Henderson | 6,411 | 1,156 | 18.0% |
| 24 | McKenzie | 5,631 | 1,001 | 17.8% |
| 25 | Columbia | 45,441 | 7,518 | 16.5% |
| 26 | Murfreesboro | 161,445 | 26,210 | 16.2% |
| 27 | Paris | 10,338 | 1,677 | 16.2% |
| 28 | Knoxville | 195,185 | 30,545 | 15.6% |
| 29 | Gallatin | 48,532 | 7,056 | 14.5% |
| 30 | Arlington | 15,205 | 1,992 | 13.1% |
| 31 | Lakeland | 14,192 | 1,802 | 12.7% |
| 32 | Lexington | 7,962 | 995 | 12.5% |
| 33 | Lebanon | 44,788 | 5,370 | 12.0% |
| 34 | Alcoa | 12,222 | 1,457 | 11.9% |
| 35 | Atoka | 10,385 | 1,226 | 11.8% |
| 36 | Harriman | 6,090 | 691 | 11.3% |
| 37 | East Ridge | 22,070 | 2,444 | 11.1% |
| 38 | Hartsville/Trousdale County | 11,957 | 1,319 | 11.0% |
| 39 | Collierville | 51,515 | 5,529 | 10.7% |
| 40 | Winchester | 9,799 | 1,040 | 10.6% |
| 41 | Shelbyville | 24,661 | 2,369 | 9.6% |
| 42 | Collegedale | 11,330 | 1,039 | 9.2% |
| 43 | Hendersonville | 63,091 | 5,757 | 9.1% |
| 44 | Lewisburg | 12,861 | 1,116 | 8.7% |
| 45 | Savannah | 7,412 | 641 | 8.6% |
| 46 | Millersville | 5,836 | 436 | 7.5% |
| 47 | Mount Juliet | 42,073 | 3,076 | 7.3% |
| 48 | Cleveland | 48,829 | 3,399 | 7.0% |
| 49 | Tullahoma | 21,103 | 1,361 | 6.4% |
| 50 | Athens | 14,471 | 925 | 6.4% |
| 51 | Newport | 6,881 | 435 | 6.3% |
| 52 | Red Bank | 12,010 | 734 | 6.1% |
| 53 | Dickson | 16,424 | 999 | 6.1% |
| 54 | Manchester | 12,944 | 767 | 5.9% |
| 55 | Oak Ridge | 32,693 | 1,894 | 5.8% |
| 56 | Johnson City | 72,222 | 4,173 | 5.8% |
| 57 | Franklin | 87,133 | 4,575 | 5.3% |
| 58 | Sweetwater | 6,532 | 335 | 5.1% |
| 59 | Lawrenceburg | 11,844 | 571 | 4.8% |
| 60 | Morristown | 31,527 | 1,485 | 4.7% |
| 61 | Brentwood | 45,556 | 2,095 | 4.6% |
| 62 | Germantown | 40,673 | 1,806 | 4.4% |
| 63 | McMinnville | 13,844 | 588 | 4.2% |
| 64 | Elizabethton | 14,374 | 578 | 4.0% |
| 65 | Spring Hill | 55,765 | 2,141 | 3.8% |
| 66 | Kingston | 6,224 | 232 | 3.7% |
| 67 | Cookeville | 36,088 | 1,226 | 3.4% |
| 68 | Bristol | 27,636 | 857 | 3.1% |
| 69 | Dayton | 7,625 | 233 | 3.1% |
| 70 | Maryville | 32,392 | 943 | 2.9% |
| 71 | Jefferson City | 8,579 | 242 | 2.8% |
| 72 | Nolensville | 15,074 | 415 | 2.8% |
| 73 | Kingsport | 56,262 | 1,512 | 2.7% |
| 74 | Munford | 6,588 | 175 | 2.7% |
| 75 | Crossville | 12,428 | 314 | 2.5% |
| 76 | Greeneville | 15,646 | 383 | 2.4% |
| 77 | Greenbrier | 6,971 | 169 | 2.4% |
| 78 | Portland | 13,449 | 319 | 2.4% |
| 79 | Sevierville | 18,397 | 386 | 2.1% |
| 80 | White House | 14,631 | 282 | 1.9% |
| 81 | Clinton | 10,239 | 195 | 1.9% |
| 82 | Pigeon Forge | 6,375 | 83 | 1.3% |
| 83 | Lenoir City | 11,110 | 131 | 1.2% |
| 84 | Rockwood | 5,566 | 58 | 1.0% |
| 85 | Farragut | 24,634 | 250 | 1.0% |
| 86 | Soddy-Daisy | 13,231 | 124 | 0.9% |
| 87 | La Follette | 7,273 | 60 | 0.8% |
| 88 | Signal Mountain | 8,860 | 57 | 0.6% |
| 89 | Fairview | 10,009 | 60 | 0.6% |
| 90 | Erwin | 5,988 | 28 | 0.5% |
| 91 | Church Hill | 7,139 | 16 | 0.2% |
| 92 | Mount Carmel | 5,472 | 0 | 0.0% |
Source: U.S. Census ACS 2020-2024. 92 cities with more than 5,000 residents.
Summary
Summary: Black Populations Across Tennessee
If you’re looking for a breakdown of African American populations across Tennessee according to the most recent data, this is an accurate list.
The blackest cities in Tennessee are Brownsville, Bolivar, Memphis, Covington, Ripley, Jackson, Humboldt, Millington, Dyersburg, and Chattanooga. Not sold on Tennessee? Take the two-minute Find Your Place quiz and see which state actually fits you.
Questions and answers
Cities In Tennessee With The Largest Black Population FAQs
What city in Tennessee has the largest Black population share?
Brownsville has the largest Black population share in Tennessee for 2026, at 67.0% of residents. Bolivar and Memphis are next.
What are the most African American cities in Tennessee?
The Tennessee cities with the largest Black population shares are Brownsville, Bolivar, Memphis, Covington, Ripley, Jackson, Humboldt, Millington, Dyersburg, and Chattanooga. We ranked all 92 places with more than 5,000 residents by their Black share of the population.
What percent of Tennessee is Black?
Tennessee is 15.4% Black, which works out to 1,090,494 residents. That makes it the 10th blackest state in the country.
What is the least African American city in Tennessee?
Mount Carmel has the smallest Black population share in Tennessee, at 0.0%. It sits at the opposite end of the same ranking.
Where does this data come from?
Every share is calculated from the Census Bureau’s American Community Survey (2020-2024), based on residents identifying as Black or African American. We rank each Tennessee place with more than 5,000 residents.



