
Before you decide to relocate to Oregon, it’s important to research the exact cost of living around the state. And that’s what we’re going to help you do.
These are the places in Oregon that cost a pretty penny — the most expensive cities in the state.
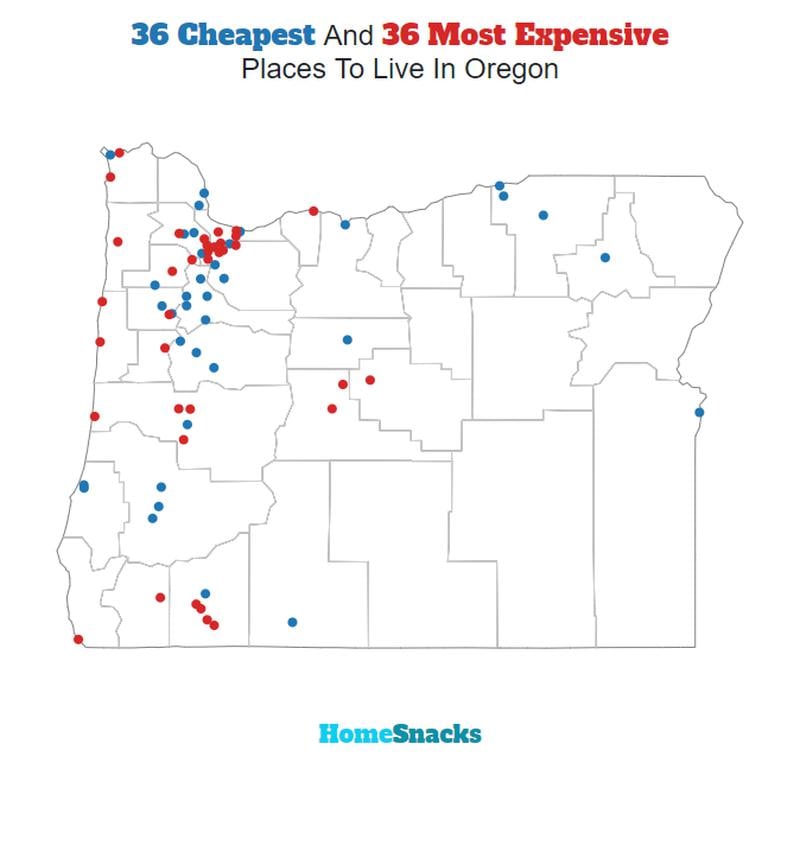
We used Saturday Night Science to compare the 2020-2024 American Community Survey on cost of living for the 80 places in Oregon with more than 5,000 people.
After we saved up for months and could finally afford it, we landed on this list of the ten most expensive cities in Oregon for 2026.
Table Of Contents: Top Ten | Methodology | Summary | Table
The 10 Most Expensive Places To Live In Oregon For 2026
What’s the most expensive place to live in Oregon? Well, HomeSnacks crunched the numbers and discovered that Lake Oswego is the most expensive place to live in Oregon.
Ontario (the cheapest place to live in Oregon) can show these guys how to live on a budget in the coming years. Read on for how these places had costs rise faster than inflation.
And if you already knew these places were expensive, check out some more reading about Oregon and the most expensive cities in the country:
The 10 Most Expensive Places To Live In Oregon For 2026

/10
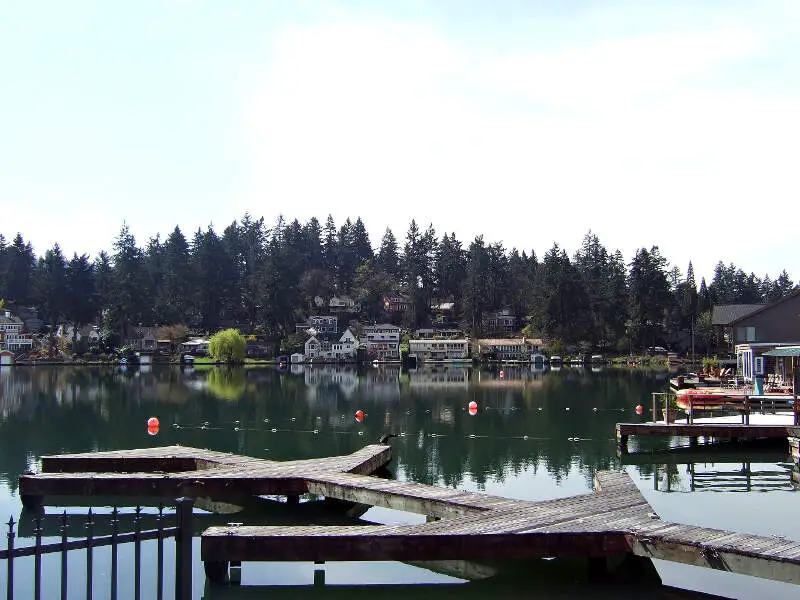
Population: 40,381
Cost Of Living Index: 166
Median Income: $141,549
Average Home Price: $882,924
Home Price To Income Ratio: 6.2x
More on Lake Oswego: Data | Crime | Cost Of Living | Movers
The overall cost of living in Lake Oswego is 166. The median income in Lake Oswego comes in at $141,549 and the average home value is $882,924 for 2026.

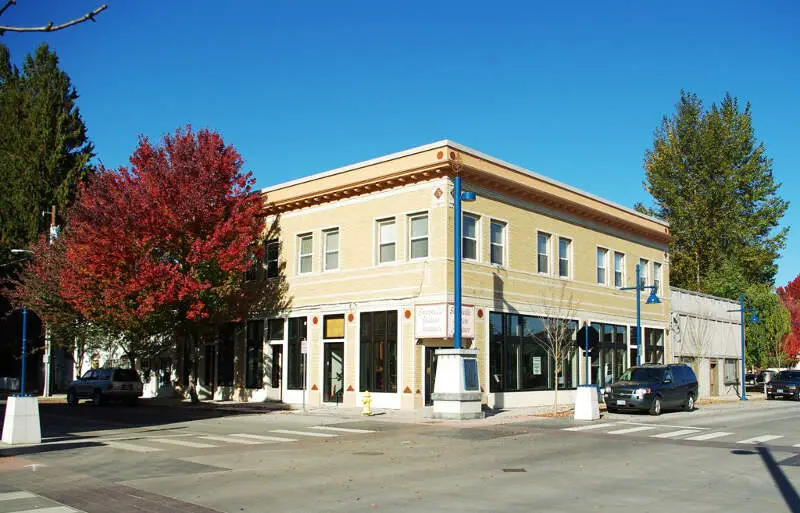
/10
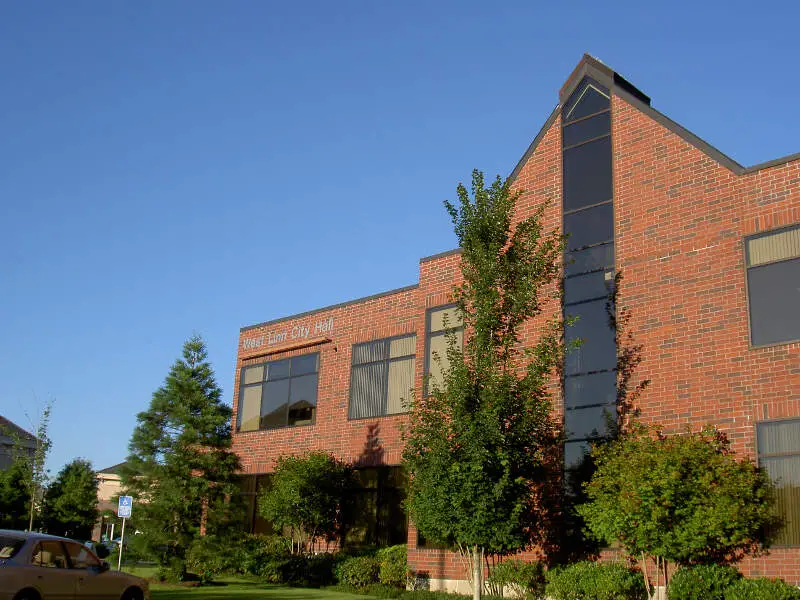
Population: 26,935
Cost Of Living Index: 153
Median Income: $146,507
Average Home Price: $777,228
Home Price To Income Ratio: 5.3x
More on West Linn: Data | Crime | Cost Of Living | Movers
The overall cost of living in West Linn is 153. The median income in West Linn comes in at $146,507 and the average home value is $777,228 for 2026.

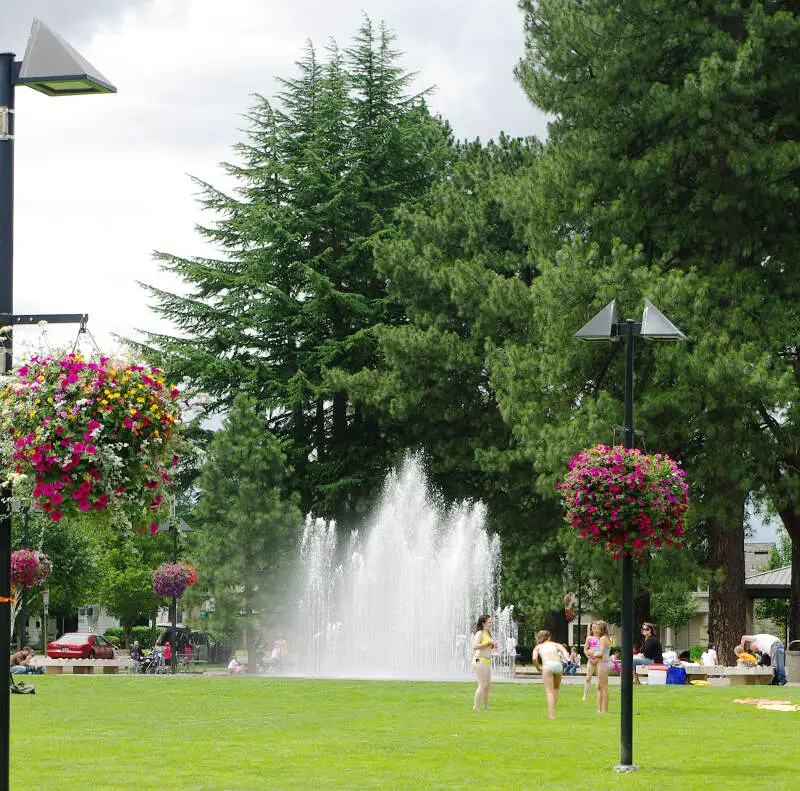
/10
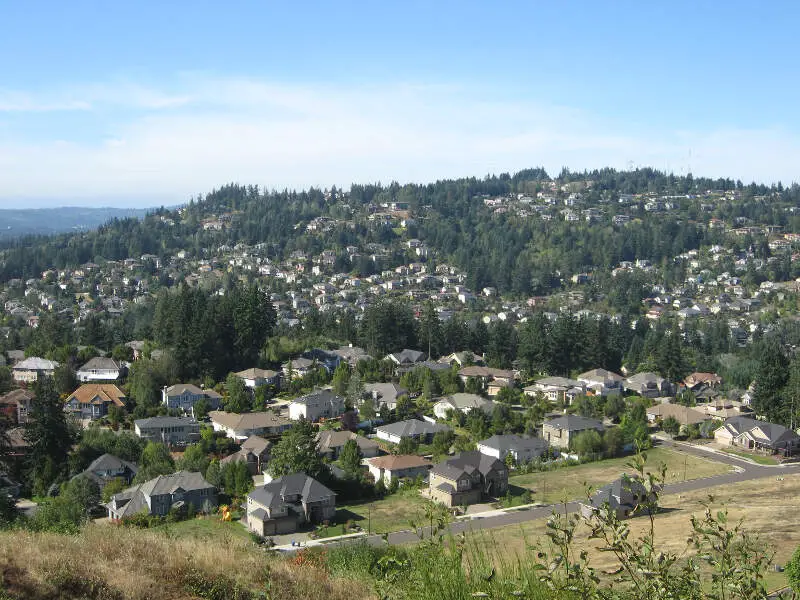
Population: 26,738
Cost Of Living Index: 153
Median Income: $122,151
Average Home Price: $681,241
Home Price To Income Ratio: 5.6x
More on Happy Valley: Data | Cost Of Living | Movers
The overall cost of living in Happy Valley is 153. The median income in Happy Valley comes in at $122,151 and the average home value is $681,241 for 2026.

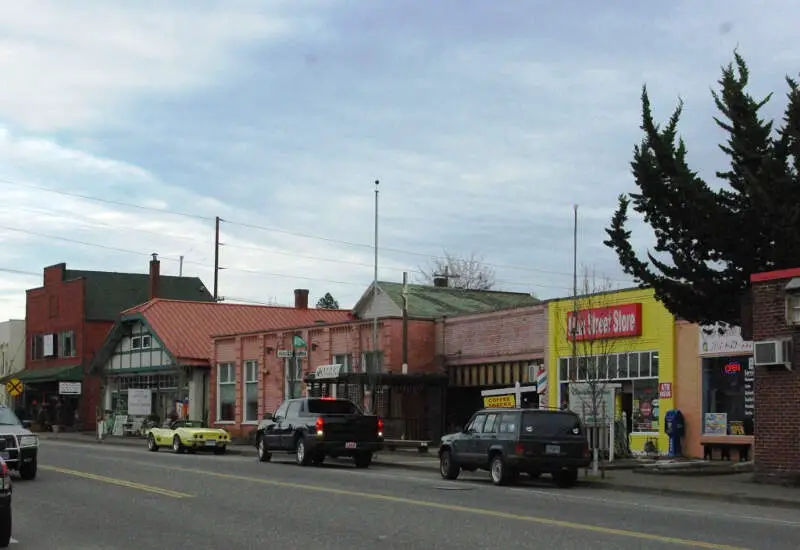
/10
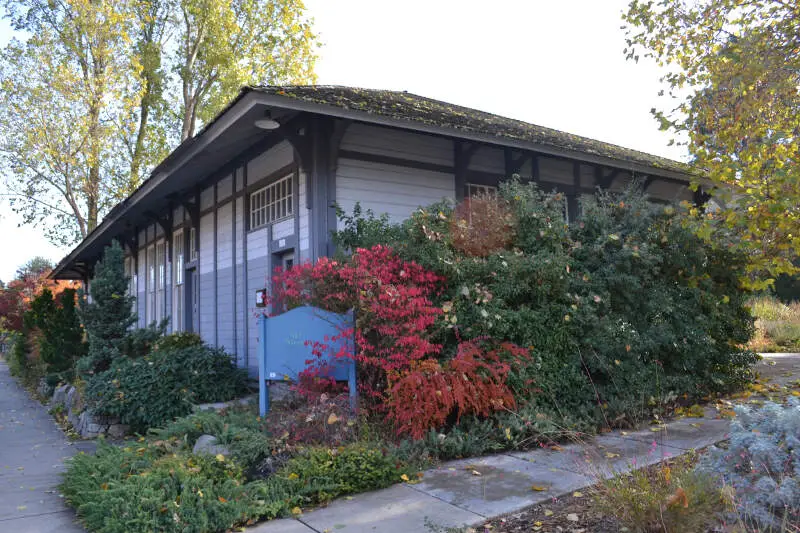
Population: 21,259
Cost Of Living Index: 141
Median Income: $68,028
Average Home Price: $551,385
Home Price To Income Ratio: 8.1x
More on Ashland: Data | Crime | Cost Of Living | Movers
The overall cost of living in Ashland is 141. The median income in Ashland comes in at $68,028 and the average home value is $551,385 for 2026.

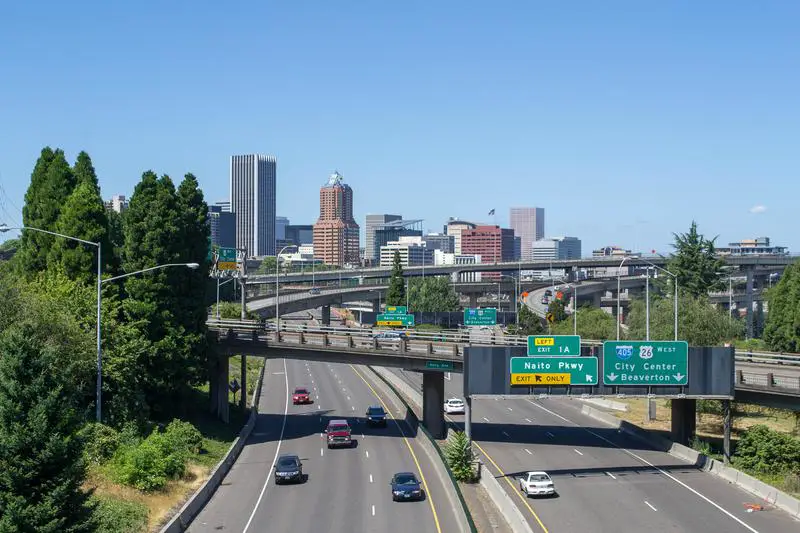
/10
Population: 641,165
Cost Of Living Index: 139
Median Income: $90,919
Average Home Price: $534,638
Home Price To Income Ratio: 5.9x
More on Portland: Data | Crime | Cost Of Living | Movers
The overall cost of living in Portland is 139. The median income in Portland comes in at $90,919 and the average home value is $534,638 for 2026.


/10
Population: 27,763
Cost Of Living Index: 139
Median Income: $104,043
Average Home Price: $638,736
Home Price To Income Ratio: 6.1x
More on Tualatin: Data | Crime | Cost Of Living | Movers
The overall cost of living in Tualatin is 139. The median income in Tualatin comes in at $104,043 and the average home value is $638,736 for 2026.

/10
Population: 20,307
Cost Of Living Index: 138
Median Income: $109,966
Average Home Price: $633,004
Home Price To Income Ratio: 5.8x
More on Sherwood: Data | Crime | Cost Of Living | Movers
The overall cost of living in Sherwood is 138. The median income in Sherwood comes in at $109,966 and the average home value is $633,004 for 2026.

/10
Population: 97,812
Cost Of Living Index: 136
Median Income: $98,622
Average Home Price: $530,794
Home Price To Income Ratio: 5.4x
More on Beaverton: Data | Crime | Cost Of Living | Movers
The overall cost of living in Beaverton is 136. The median income in Beaverton comes in at $98,622 and the average home value is $530,794 for 2026.

/10
Population: 56,011
Cost Of Living Index: 136
Median Income: $108,823
Average Home Price: $608,407
Home Price To Income Ratio: 5.6x
More on Tigard: Data | Crime | Cost Of Living | Movers
The overall cost of living in Tigard is 136. The median income in Tigard comes in at $108,823 and the average home value is $608,407 for 2026.

/10
Population: 26,974
Cost Of Living Index: 134
Median Income: $96,236
Average Home Price: $635,208
Home Price To Income Ratio: 6.6x
More on Wilsonville: Data | Cost Of Living | Movers
The overall cost of living in Wilsonville is 134. The median income in Wilsonville comes in at $96,236 and the average home value is $635,208 for 2026.
Methodology: How We Determined The Most Expensive Places To Live In The Beaver State For 2026
The two most important things to think about when it comes to being able to afford a city in Oregon are:
- How much money do I make?
- How much do I have to spend to live there?
You need to understand your costs in the context of how much money you make.
For example, if the median household earns $100,000 and spends $40,000 on housing, it’s actually cheaper to live there than a place with a median income of $50,000 and housing costs of $21,000. You might spend more on housing, but you have more money overall to play with.
With that example in mind, we derived several statistics from the latest Census American Community Survey 2020-2024 around incomes and costs. They are:
- Overall Cost Of Living Index
- Median Home Price / Median Income (lower is better)
- Median Income / Median Rent (Higher is better)
- Median Home Price
You can then compare these metrics in each of the places in Oregon to figure out which is the most expensive.
You are left with a “Cost of Living Index” by taking the average rank of each of these metrics for each city.
So we used that cost of living index to rank all of the 80 places in Oregon that have more than 5,000 people.
The place with the highest cost of living in Oregon according to the data is Lake Oswego. We updated this article for 2026. This article is our eleventh time ranking the most expensive places to live in Oregon.
Summary: Taking A Chunk Out Of Your Paycheck In Oregon For 2026
Well, there you have it, the places in Oregon that have the highest cost of living, with Lake Oswego ranking as the most expensive city in the Beaver State.
The most expensive cities in Oregon are Lake Oswego, West Linn, Happy Valley, Ashland, Portland, Tualatin, Sherwood, Beaverton, Tigard, and Wilsonville.
Here’s a look at the most affordable cities in Oregon according to the data:
- Ontario
- Milton-Freewater
- Baker City
For more Oregon reading, check out:
- Best Places To Live In Oregon
- Cheapest Places To Live In Oregon
- Most Dangerous Cities In Oregon
- Best Places To Raise A Family In Oregon
- Safest Places In Oregon
- Worst Places To Live In Oregon
Most Expensive Cities In Oregon
| Rank | City | Cost Of Living | Population | Median Income | Average Home Price | Home/Income Ratio |
|---|---|---|---|---|---|---|
| 1 | Lake Oswego | 166 | 40,381 | $141,549 | $882,924 | 6.2x |
| 2 | West Linn | 153 | 26,935 | $146,507 | $777,228 | 5.3x |
| 3 | Happy Valley | 153 | 26,738 | $122,151 | $681,241 | 5.6x |
| 4 | Ashland | 141 | 21,259 | $68,028 | $551,385 | 8.1x |
| 5 | Portland | 139 | 641,165 | $90,919 | $534,638 | 5.9x |
| 6 | Tualatin | 139 | 27,763 | $104,043 | $638,736 | 6.1x |
| 7 | Sherwood | 138 | 20,307 | $109,966 | $633,004 | 5.8x |
| 8 | Beaverton | 136 | 97,812 | $98,622 | $530,794 | 5.4x |
| 9 | Tigard | 136 | 56,011 | $108,823 | $608,407 | 5.6x |
| 10 | Wilsonville | 134 | 26,974 | $96,236 | $635,208 | 6.6x |
| 11 | Hood River | 134 | 8,361 | $85,647 | $712,509 | 8.3x |
| 12 | Bend | 132 | 103,390 | $96,394 | $732,649 | 7.6x |
| 13 | Hillsboro | 128 | 108,231 | $106,409 | $522,557 | 4.9x |
| 14 | Corvallis | 128 | 59,960 | $65,012 | $555,988 | 8.6x |
| 15 | Oregon City | 128 | 37,755 | $97,829 | $603,703 | 6.2x |
| 16 | Troutdale | 128 | 15,923 | $89,337 | $492,004 | 5.5x |
| 17 | Canby | 127 | 18,134 | $100,989 | $590,607 | 5.8x |
| 18 | Gladstone | 127 | 11,977 | $91,250 | $517,792 | 5.7x |
| 19 | Estacada | 127 | 5,152 | $94,435 | $540,538 | 5.7x |
| 20 | Gresham | 126 | 112,378 | $77,795 | $471,181 | 6.1x |
| 21 | Newberg | 126 | 26,066 | $93,232 | $530,484 | 5.7x |
| 22 | Sandy | 125 | 12,854 | $108,984 | $523,759 | 4.8x |
| 23 | Forest Grove | 124 | 26,529 | $87,933 | $525,622 | 6.0x |
| 24 | Milwaukie | 124 | 21,392 | $86,892 | $519,433 | 6.0x |
| 25 | Scappoose | 124 | 8,179 | $97,708 | $489,282 | 5.0x |
| 26 | Brookings | 124 | 6,703 | $74,933 | $477,228 | 6.4x |
| 27 | Cornelius | 122 | 14,255 | $96,273 | $485,774 | 5.0x |
| 28 | Fairview | 122 | 10,735 | $70,107 | $479,771 | 6.8x |
| 29 | Molalla | 122 | 10,186 | $89,318 | $497,975 | 5.6x |
| 30 | Seaside | 122 | 7,192 | $47,361 | $465,275 | 9.8x |
| 31 | Eugene | 121 | 179,591 | $66,562 | $473,231 | 7.1x |
| 32 | Silverton | 120 | 10,456 | $79,960 | $546,989 | 6.8x |
| 33 | King City | 120 | 5,073 | $63,684 | $464,245 | 7.3x |
| 34 | Medford | 119 | 86,315 | $73,230 | $406,688 | 5.6x |
| 35 | Eagle Point | 119 | 9,839 | $84,126 | $470,636 | 5.6x |
| 36 | Keizer | 118 | 39,082 | $84,813 | $450,014 | 5.3x |
| 37 | Central Point | 118 | 19,216 | $86,058 | $418,192 | 4.9x |
| 38 | Astoria | 118 | 10,109 | $68,007 | $474,605 | 7.0x |
| 39 | Redmond | 117 | 36,092 | $84,164 | $514,637 | 6.1x |
| 40 | Warrenton | 117 | 6,327 | $70,670 | $498,702 | 7.1x |
| 41 | Philomath | 117 | 5,642 | $83,672 | $518,378 | 6.2x |
| 42 | Salem | 116 | 178,865 | $75,487 | $436,317 | 5.8x |
| 43 | Monmouth | 116 | 11,428 | $69,170 | $473,961 | 6.9x |
| 44 | Newport | 116 | 10,583 | $60,568 | $445,960 | 7.4x |
| 45 | Florence | 116 | 9,482 | $53,333 | $435,247 | 8.2x |
| 46 | McMinnville | 115 | 34,596 | $73,736 | $484,841 | 6.6x |
| 47 | Stayton | 115 | 8,292 | $78,268 | $463,064 | 5.9x |
| 48 | St. Helens | 114 | 14,258 | $82,865 | $425,039 | 5.1x |
| 49 | Talent | 114 | 6,254 | $62,543 | $430,817 | 6.9x |
| 50 | Grants Pass | 113 | 39,311 | $59,646 | $398,231 | 6.7x |
| 51 | Creswell | 113 | 5,621 | $100,385 | $468,603 | 4.7x |
| 52 | Albany | 112 | 56,839 | $78,114 | $435,935 | 5.6x |
| 53 | Junction City | 112 | 6,947 | $85,595 | $478,165 | 5.6x |
| 54 | Springfield | 111 | 61,499 | $68,761 | $414,617 | 6.0x |
| 55 | Woodburn | 111 | 27,875 | $67,347 | $425,247 | 6.3x |
| 56 | Dallas | 111 | 17,531 | $71,549 | $474,062 | 6.6x |
| 57 | Independence | 111 | 10,199 | $85,375 | $425,945 | 5.0x |
| 58 | Lincoln City | 111 | 9,968 | $56,635 | $491,268 | 8.7x |
| 59 | Veneta | 110 | 5,200 | $66,890 | $435,477 | 6.5x |
| 60 | The Dalles | 109 | 15,917 | $62,614 | $389,438 | 6.2x |
| 61 | Coos Bay | 108 | 15,925 | $56,524 | $323,164 | 5.7x |
| 62 | North Bend | 108 | 10,171 | $81,320 | $355,605 | 4.4x |
| 63 | Sheridan | 107 | 6,339 | $70,785 | $402,546 | 5.7x |
| 64 | Hermiston | 106 | 19,546 | $66,998 | $339,211 | 5.1x |
| 65 | Prineville | 106 | 11,470 | $72,980 | $425,758 | 5.8x |
| 66 | Cottage Grove | 106 | 10,698 | $80,875 | $395,746 | 4.9x |
| 67 | Roseburg | 105 | 23,778 | $53,918 | $361,700 | 6.7x |
| 68 | Sutherlin | 105 | 8,599 | $51,250 | $345,331 | 6.7x |
| 69 | Tillamook | 105 | 5,218 | $58,176 | $459,170 | 7.9x |
| 70 | Klamath Falls | 104 | 22,115 | $46,693 | $308,370 | 6.6x |
| 71 | Winston | 104 | 5,690 | $56,667 | $313,138 | 5.5x |
| 72 | Lebanon | 103 | 19,344 | $63,176 | $391,198 | 6.2x |
| 73 | Pendleton | 103 | 16,950 | $66,563 | $295,556 | 4.4x |
| 74 | La Grande | 103 | 13,058 | $58,427 | $298,759 | 5.1x |
| 75 | Umatilla | 103 | 7,508 | $68,826 | $291,017 | 4.2x |
| 76 | Sweet Home | 102 | 10,078 | $56,927 | $350,175 | 6.2x |
| 77 | Madras | 102 | 7,676 | $64,659 | $358,033 | 5.5x |
| 78 | Baker City | 100 | 10,210 | $61,580 | $264,325 | 4.3x |
| 79 | Milton-Freewater | 97 | 7,036 | $52,183 | $250,755 | 4.8x |
| 80 | Ontario | 91 | 11,842 | $46,308 | $305,608 | 6.6x |