Most Hispanic/Latino cities in Georgia research summary. We used Saturday Night Science to analyze Georgia’s most recent Census data to determine the most Hispanic/Latino cities based on the percentage of Hispanic/Latino residents.
54.7% Hispanic · #1 most Hispanic in Georgia
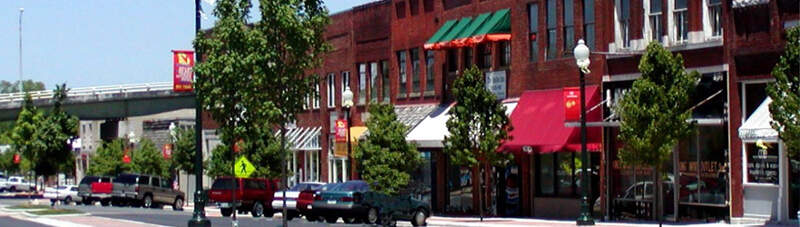
Dalton is a city in Whitfield County, Georgia, United States. It is the county seat of Whitfield County and the principal city of the Dalton, Georgia Metropolitan Statistical Area, which encompasses all of Murray and Whitfield counties.
Data | Crime | Cost of living | Movers
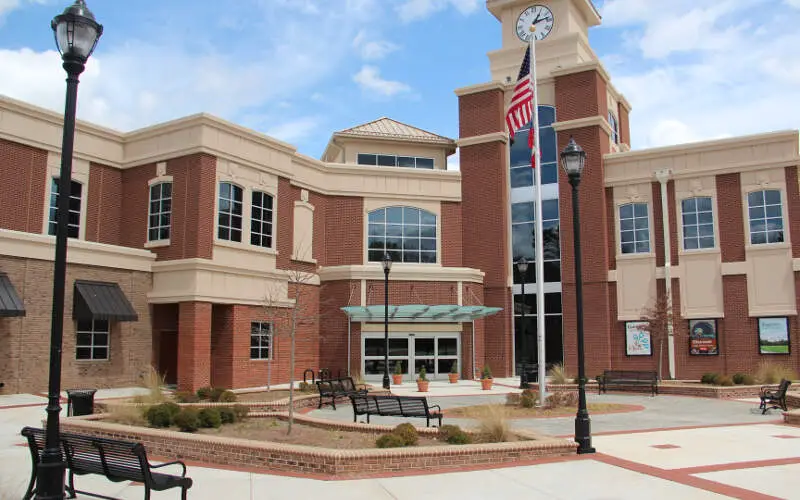
48.2% Hispanic · #2 most Hispanic in Georgia
Data | Crime | Cost of living | Movers
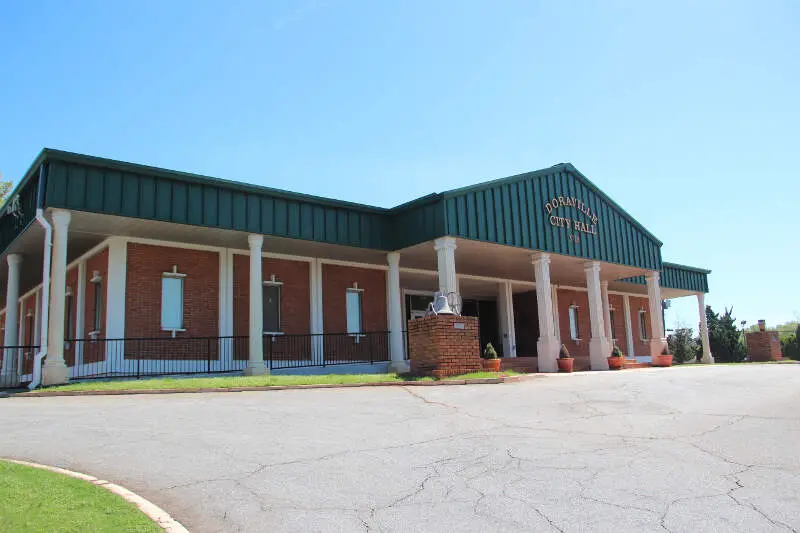
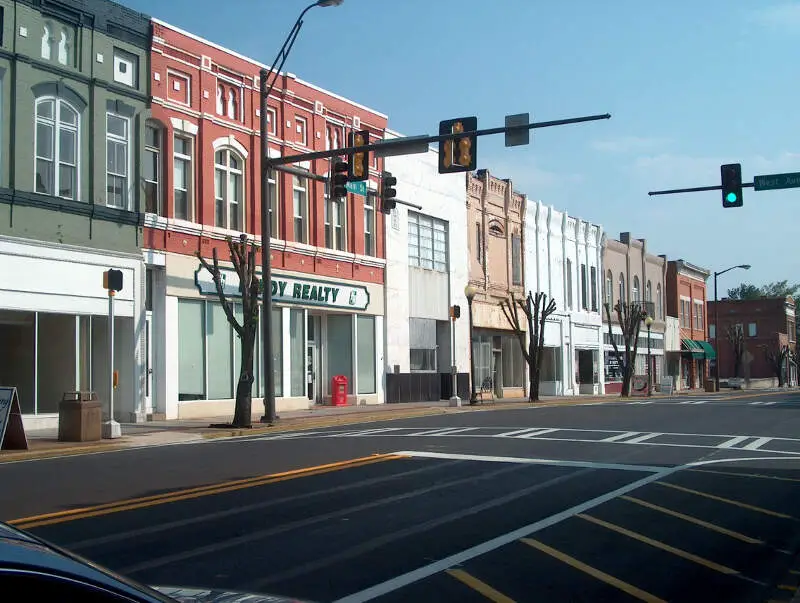
46.1% Hispanic · #3 most Hispanic in Georgia
Doraville is a city in DeKalb County, Georgia, United States. The municipality is northeast of Atlanta. As of the 2010 census, the city had a population of 8,330.
Data | Crime | Cost of living | Movers
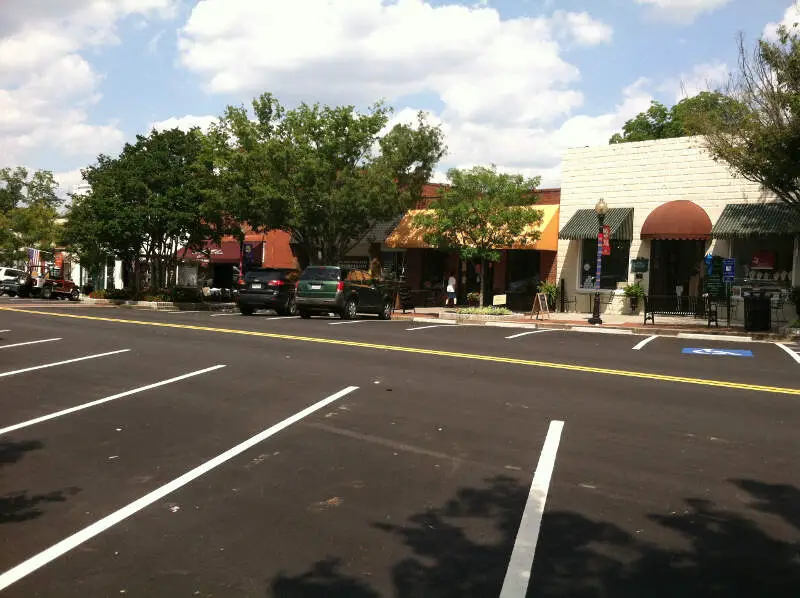
40.1% Hispanic · #4 most Hispanic in Georgia
Norcross is a city in Gwinnett County, Georgia, United States. The population as of the 2010 census was 9,116, while in 2015 the estimated population was 16,634. It is included in the Atlanta-Sandy Springs-Marietta metropolitan statistical area, which is included in the Atlanta-Sandy Springs-Gainesville combined statistical area.
Data | Crime | Cost of living | Movers
37.0% Hispanic · #5 most Hispanic in Georgia
The city of Gainesville is the county seat of Hall County, Georgia, United States. As of the 2010 census, the city had a population of 33,804. By 2015 the population had risen to an estimated 38,712. Because of its large number of poultry processing plants, it is often called the “Poultry Capital of the World”. Gainesville is the principal city of, and is included in, the Gainesville, Georgia Metropolitan Statistical Area, which is included in the Atlanta-Sandy Springs-Gainesville, Georgia Combined Statistical Area.
Data | Crime | Cost of living | Movers
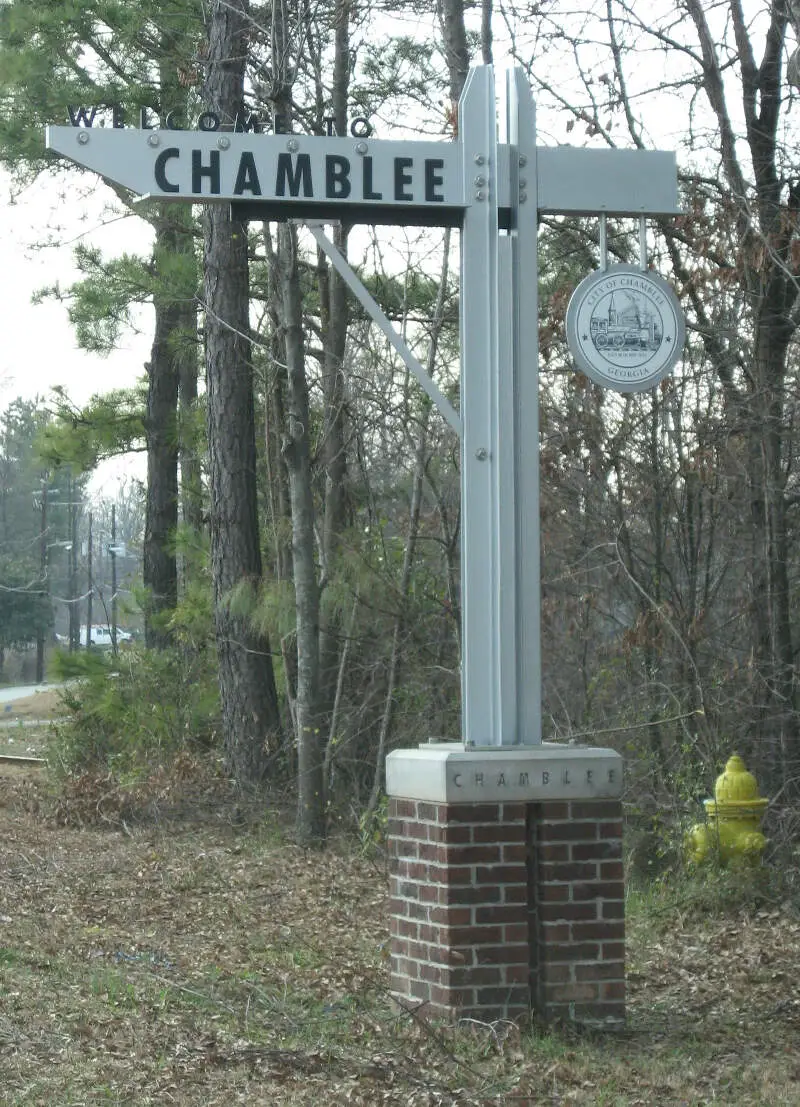
36.8% Hispanic · #6 most Hispanic in Georgia
Chamblee is a city in northern DeKalb County, Georgia, United States, northeast of Atlanta. The population was 9,892 at the 2010 census.
Data | Crime | Cost of living | Movers
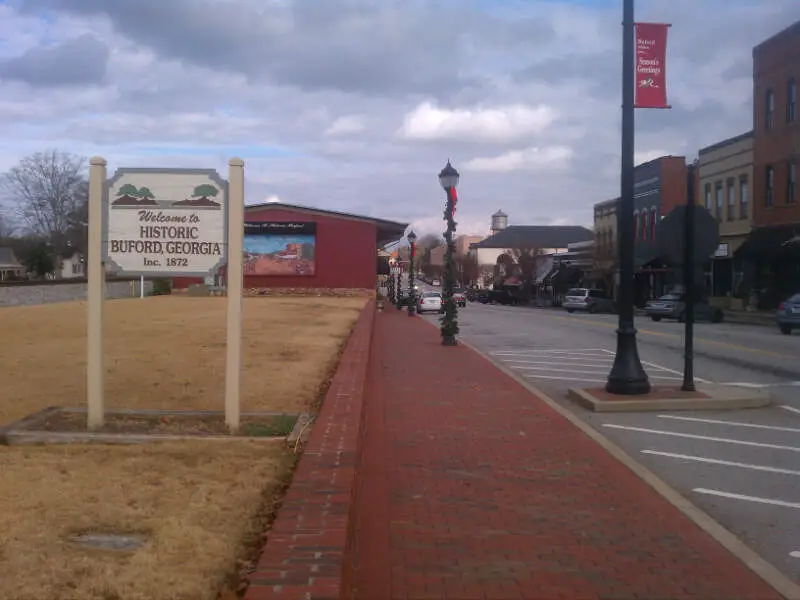
31.9% Hispanic · #7 most Hispanic in Georgia
Buford is a city in Gwinnett and Hall counties in the U.S. state of Georgia. As of the 2010 census, the city had a population of 12,225. Most of the city is in Gwinnett County, which is part of the Atlanta-Sandy Springs-Marietta Metropolitan Statistical Area. The portions of the city in Hall County are not part of Atlanta’s metropolitan statistical area, but are part of Atlanta’s larger Combined Statistical Area, which includes Hall County.
Data | Crime | Cost of living | Movers

31.3% Hispanic · #8 most Hispanic in Georgia
Lawrenceville is a city in and the county seat of Gwinnett County, Georgia, United States. It is a suburb of Atlanta, located approximately 30 miles northeast of downtown. As of the 2010 census, the population of Lawrenceville was 28,546. In 2015, the U.S. Census Bureau estimated the city population to be 30,493. Lawrenceville has six ZIP codes, and it is part of the 678404 telephone area code, which is used throughout metropolitan Atlanta.
Data | Crime | Cost of living | Movers
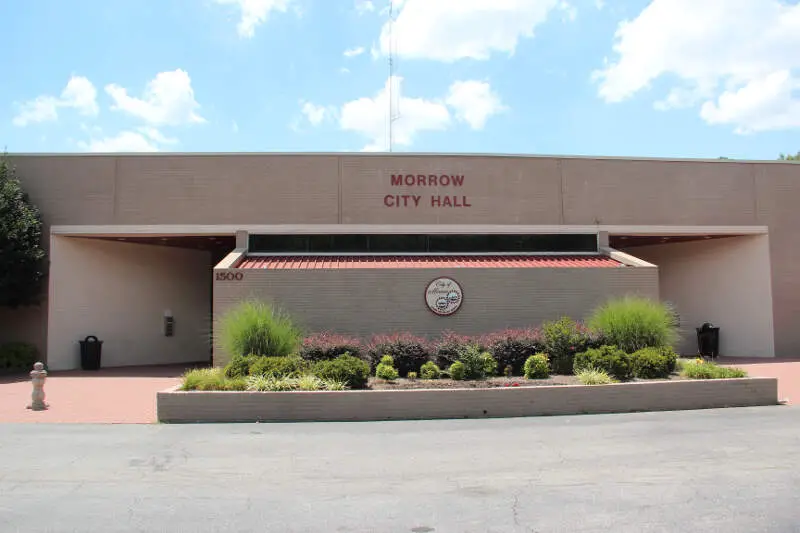
30.0% Hispanic · #9 most Hispanic in Georgia
Morrow is a city in Clayton County, Georgia, United States. The population was 6,445 at the 2010 census, up from 4,882 in 2000. It is the home of Clayton State University.
Data | Crime | Cost of living | Movers
29.4% Hispanic · #10 most Hispanic in Georgia
Cedartown is a city in Polk County, Georgia, United States. As of the 2010 census, the city had a population of 9,750. The city is the county seat of Polk County. Cedartown is the principal city of and is included in the Cedartown, Georgia Micropolitan Statistical Area, which is included in the Atlanta-Sandy Springs-Gainesville, Georgia-Alabama Combined Statistical Area.
Data | Crime | Cost of living | Movers
The receipts
Compare the top ten
Pick a metric. The bars rescale. The red line is Georgia’s statewide median.
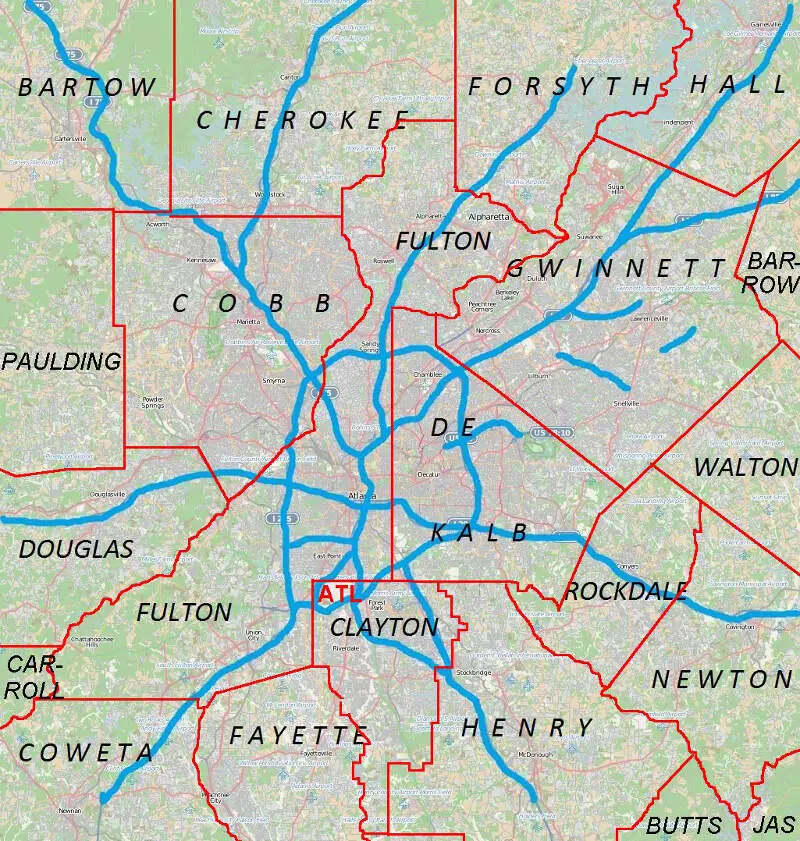
On the map
Where Georgia’s Hispanic and Latino communities live
Saturday Night Science
Methodology: How We Determined The Cities In Georgia With The Largest Hispanic Population For 2026
We used Saturday Night Science to compare data on race from the US Census for every city in Georgia.
Georgia’s most recently available data comes from the 2020-2024 American Community Survey.
Specifically, we looked at table B03002: Hispanic OR LATINO ORIGIN BY RACE. Here are the category names as defined by the Census:
- Hispanic or Latino
- White alone*
- Black or African American alone*
- American Indian and Alaska Native alone*
- Asian alone*
- Native Hawaiian and Other Pacific Islander alone*
- Some other race alone*
- Two or more races*
Our particular column of interest here was the number of people who identified as Hispanic or Latino.
We limited our analysis to places in Georgia with a population greater than 5,000 people. That left us with 121 cities.
We then calculated the percentage of Hispanic or Latino residents in each Georgia city. The percentages ranked from 54.7% to 0.0%.
Finally, we ranked each city based on the percentage of the Hispanic or Latino population, with a higher percentage being more Hispanic or Latino. Dalton was the most Hispanic or Latino, while Blakely was the least Hispanic or Latino city.
We updated this article for 2026. This article represents our eleventh time ranking the cities in Georgia with the largest Hispanic/Latino population.
The full plate
Cities In Georgia By Hispanic Population
Click any column to sort. Search by city name.
| Rank | City | Population | Hispanic Population | % Hispanic |
|---|---|---|---|---|
| 1 | Dalton | 34,538 | 18,884 | 54.7% |
| 2 | Lilburn | 15,390 | 7,425 | 48.2% |
| 3 | Doraville | 11,134 | 5,130 | 46.1% |
| 4 | Norcross | 18,007 | 7,223 | 40.1% |
| 5 | Gainesville | 45,032 | 16,667 | 37.0% |
| 6 | Chamblee | 30,895 | 11,382 | 36.8% |
| 7 | Buford | 17,997 | 5,737 | 31.9% |
| 8 | Lawrenceville | 30,954 | 9,694 | 31.3% |
| 9 | Morrow | 6,364 | 1,912 | 30.0% |
| 10 | Cedartown | 10,227 | 3,006 | 29.4% |
| 11 | Forest Park | 19,504 | 5,354 | 27.5% |
| 12 | Hapeville | 6,630 | 1,794 | 27.1% |
| 13 | Canton | 35,741 | 9,625 | 26.9% |
| 14 | Calhoun | 18,183 | 4,512 | 24.8% |
| 15 | Cairo | 10,055 | 2,133 | 21.2% |
| 16 | Rome | 38,189 | 7,811 | 20.5% |
| 17 | Garden City | 10,426 | 1,941 | 18.6% |
| 18 | Auburn | 8,711 | 1,618 | 18.6% |
| 19 | Marietta | 62,263 | 11,264 | 18.1% |
| 20 | Cusseta-Chattahoochee County unified government | 8,887 | 1,594 | 17.9% |
| 21 | Powder Springs | 18,009 | 3,122 | 17.3% |
| 22 | Sugar Hill | 26,128 | 4,383 | 16.8% |
| 23 | Adel | 5,641 | 945 | 16.8% |
| 24 | Duluth | 32,426 | 5,299 | 16.3% |
| 25 | Roswell | 92,621 | 15,106 | 16.3% |
| 26 | Winder | 19,437 | 3,134 | 16.1% |
| 27 | Cumming | 8,469 | 1,365 | 16.1% |
| 28 | Commerce | 8,013 | 1,286 | 16.0% |
| 29 | Snellville | 21,620 | 3,391 | 15.7% |
| 30 | Austell | 8,447 | 1,310 | 15.5% |
| 31 | Cartersville | 24,074 | 3,665 | 15.2% |
| 32 | Tifton | 17,210 | 2,578 | 15.0% |
| 33 | Eatonton | 6,515 | 964 | 14.8% |
| 34 | Dallas | 14,714 | 2,166 | 14.7% |
| 35 | Richmond Hill | 18,181 | 2,653 | 14.6% |
| 36 | Flowery Branch | 10,925 | 1,578 | 14.4% |
| 37 | Kennesaw | 34,605 | 4,709 | 13.6% |
| 38 | Braselton | 15,178 | 2,004 | 13.2% |
| 39 | Acworth | 22,473 | 2,950 | 13.1% |
| 40 | Hinesville | 35,679 | 4,670 | 13.1% |
| 41 | Riverdale | 14,792 | 1,907 | 12.9% |
| 42 | Smyrna | 56,633 | 7,286 | 12.9% |
| 43 | Moultrie | 14,588 | 1,783 | 12.2% |
| 44 | Athens-Clarke County unified government (balance) | 127,345 | 15,148 | 11.9% |
| 45 | Carrollton | 27,392 | 3,240 | 11.8% |
| 46 | Sandy Springs | 107,087 | 12,642 | 11.8% |
| 47 | East Point | 38,335 | 4,493 | 11.7% |
| 48 | Fort Valley | 8,858 | 1,019 | 11.5% |
| 49 | Dunwoody | 51,758 | 5,689 | 11.0% |
| 50 | Grovetown | 17,014 | 1,850 | 10.9% |
| 51 | Jefferson | 14,990 | 1,530 | 10.2% |
| 52 | Lovejoy | 11,508 | 1,151 | 10.0% |
| 53 | Woodstock | 37,381 | 3,671 | 9.8% |
| 54 | Union City | 27,728 | 2,716 | 9.8% |
| 55 | Douglas | 11,749 | 1,146 | 9.8% |
| 56 | Kingsland | 19,627 | 1,909 | 9.7% |
| 57 | Conyers | 18,512 | 1,795 | 9.7% |
| 58 | Loganville | 15,527 | 1,488 | 9.6% |
| 59 | Milton | 41,546 | 3,962 | 9.5% |
| 60 | Alpharetta | 66,855 | 6,304 | 9.4% |
| 61 | Holly Springs | 18,627 | 1,751 | 9.4% |
| 62 | Newnan | 44,235 | 4,156 | 9.4% |
| 63 | Brunswick | 15,307 | 1,421 | 9.3% |
| 64 | Suwanee | 22,349 | 2,005 | 9.0% |
| 65 | Peachtree City | 39,576 | 3,544 | 9.0% |
| 66 | Decatur | 24,518 | 2,171 | 8.9% |
| 67 | Warner Robins | 82,990 | 7,296 | 8.8% |
| 68 | Waynesboro | 5,644 | 486 | 8.6% |
| 69 | Columbus | 203,711 | 17,357 | 8.5% |
| 70 | Camilla | 5,124 | 431 | 8.4% |
| 71 | St. Marys | 19,166 | 1,612 | 8.4% |
| 72 | Jonesboro | 6,143 | 495 | 8.1% |
| 73 | Locust Grove | 10,532 | 846 | 8.0% |
| 74 | Covington | 14,584 | 1,153 | 7.9% |
| 75 | Villa Rica | 18,551 | 1,461 | 7.9% |
| 76 | Stockbridge | 35,737 | 2,764 | 7.7% |
| 77 | Douglasville | 37,536 | 2,806 | 7.5% |
| 78 | Savannah | 147,898 | 11,055 | 7.5% |
| 79 | Fairburn | 16,831 | 1,230 | 7.3% |
| 80 | McDonough | 30,947 | 2,191 | 7.1% |
| 81 | Dahlonega | 7,299 | 493 | 6.8% |
| 82 | Monroe | 15,648 | 1,030 | 6.6% |
| 83 | Johns Creek | 81,988 | 5,349 | 6.5% |
| 84 | Waycross | 13,756 | 861 | 6.3% |
| 85 | Atlanta | 505,268 | 31,595 | 6.3% |
| 86 | LaGrange | 32,078 | 2,004 | 6.2% |
| 87 | Centerville | 8,505 | 522 | 6.1% |
| 88 | Jesup | 9,942 | 607 | 6.1% |
| 89 | Pooler | 28,466 | 1,721 | 6.0% |
| 90 | Augusta-Richmond County consolidated government (balance) | 201,528 | 11,829 | 5.9% |
| 91 | Cordele | 9,994 | 570 | 5.7% |
| 92 | Bainbridge | 14,404 | 808 | 5.6% |
| 93 | Valdosta | 55,252 | 3,077 | 5.6% |
| 94 | Statesboro | 34,149 | 1,864 | 5.5% |
| 95 | Perry | 23,001 | 1,239 | 5.4% |
| 96 | Tyrone | 7,896 | 419 | 5.3% |
| 97 | Swainsboro | 7,571 | 401 | 5.3% |
| 98 | Americus | 15,813 | 834 | 5.3% |
| 99 | Fayetteville | 19,719 | 998 | 5.1% |
| 100 | Barnesville | 6,121 | 302 | 4.9% |
Source: U.S. Census ACS 2020-2024. 121 cities with more than 5,000 residents.
Summary
Summary: Hispanic or Latino Populations Across Georgia
According to the most recent data, this is an accurate list if you’re looking for a breakdown of Latino populations for each place across Georgia.
The most Hispanic/Latino cities in Georgia are Dalton, Lilburn, Doraville, Norcross, Gainesville, Chamblee, Buford, Lawrenceville, Morrow, and Cedartown.


