
Sure, a Saturday morning right after a foot of fluffy snow is the best thing ever. But that same amount of snow on Tuesday in Ohio can make a commute last forever. Imagine it’s the dead of winter and the time of year when the ground is frozen, the air is bone-chilling, and there are piles of dirty, nasty, ice-encrusted snow all over the place.
This is about the time of year when you’re just about ready for spring — especially in Conneaut, the snowiest place in Ohio.
So, put on your parkas, snow boots, and gloves, and let’s go outside to see which Ohio cities get dumped on the most every year. After analyzing all the cities in Ohio with Saturday Night Science, we came up with this list as the 10 snowiest cities in Buckeye State.
Table Of Contents: Top Ten | Methodology | Table
The 10 Snowiest Cities In Ohio For 2026
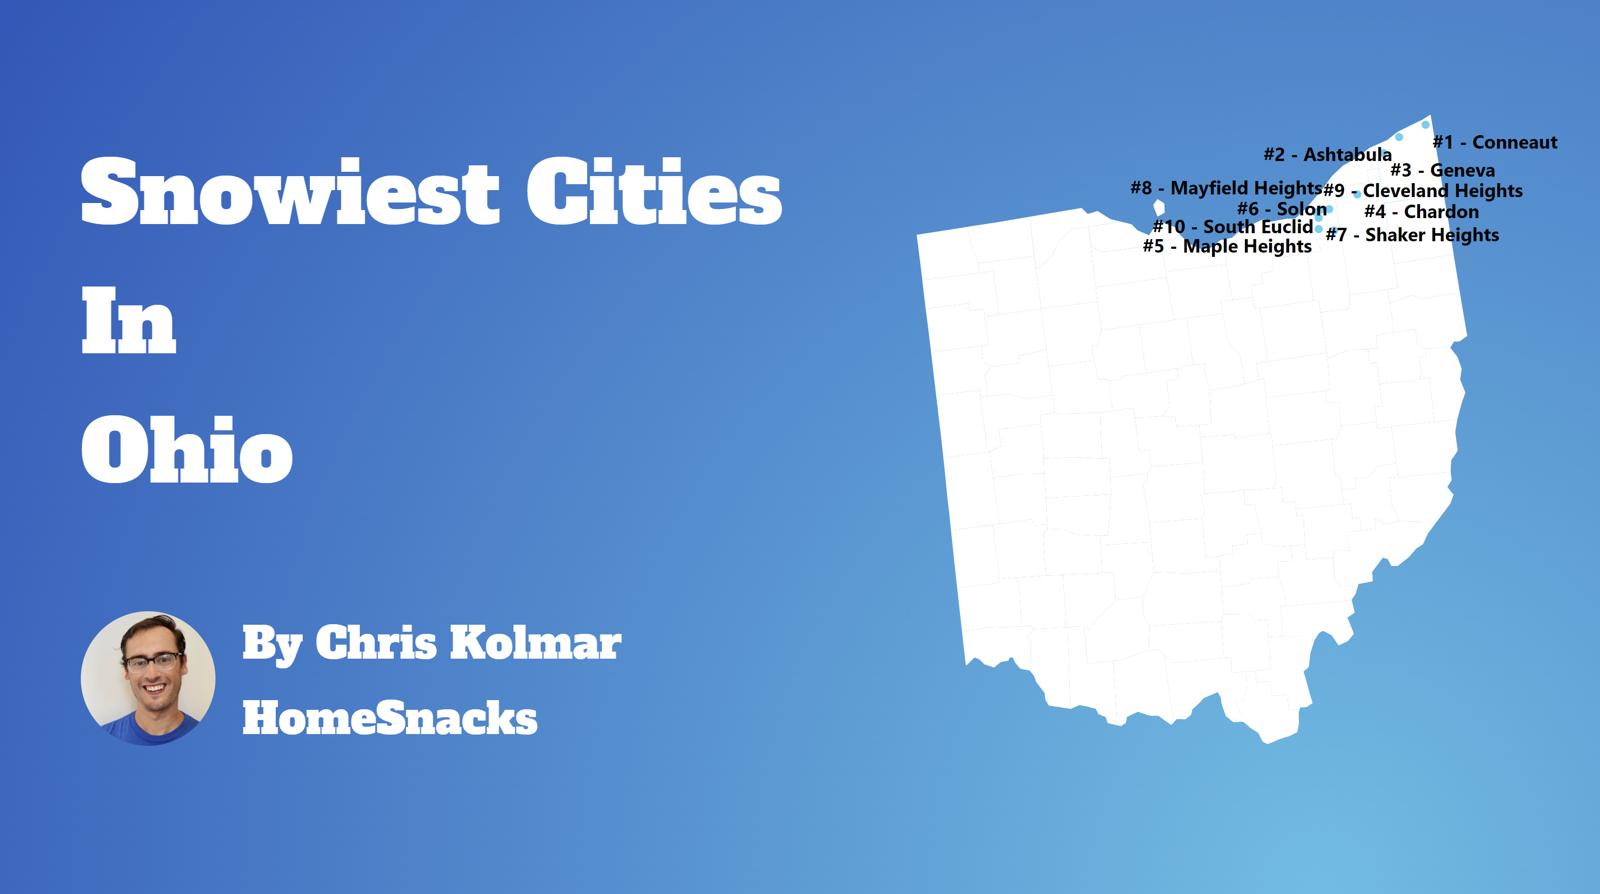
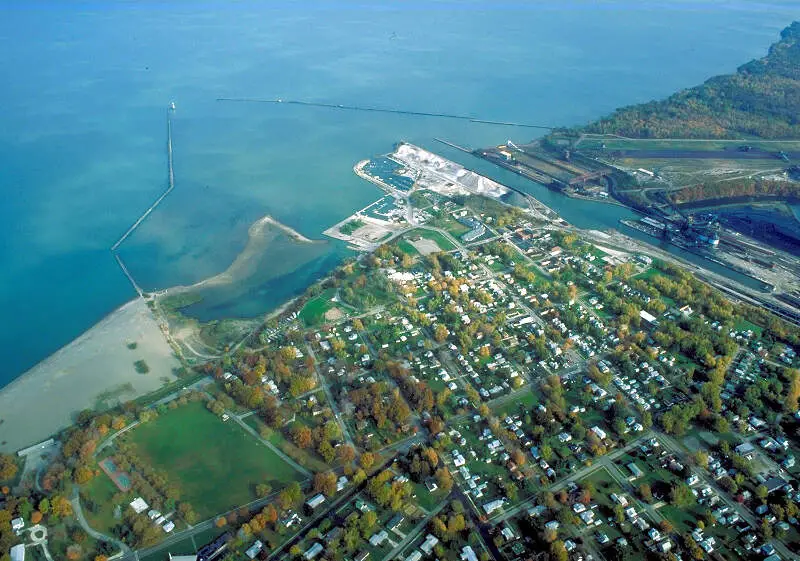
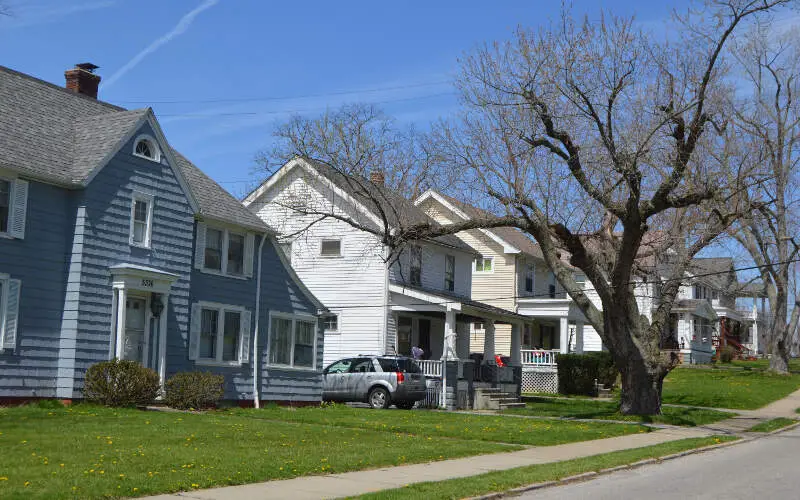
What’s the snowiest place in Ohio with more than 5,000 people? That would be Conneaut with an average annual snowfall of 94.0 inches.
Read on below to see where your town ranked, you snow angels.
And if you already knew these places were snowy, check out the best places to live in Ohio or the cheapest places in Ohio.
The 10 Snowiest Cities In Ohio For 2026

/10
Population: 12,806
Average Annual Snowfall: 94.0 inches
More on Conneaut: Data | Crime | Cost Of Living | Movers

/10
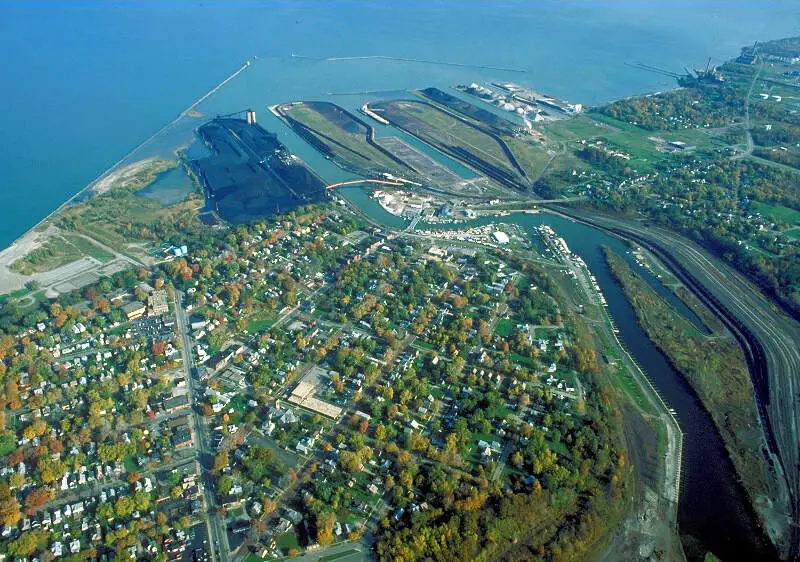
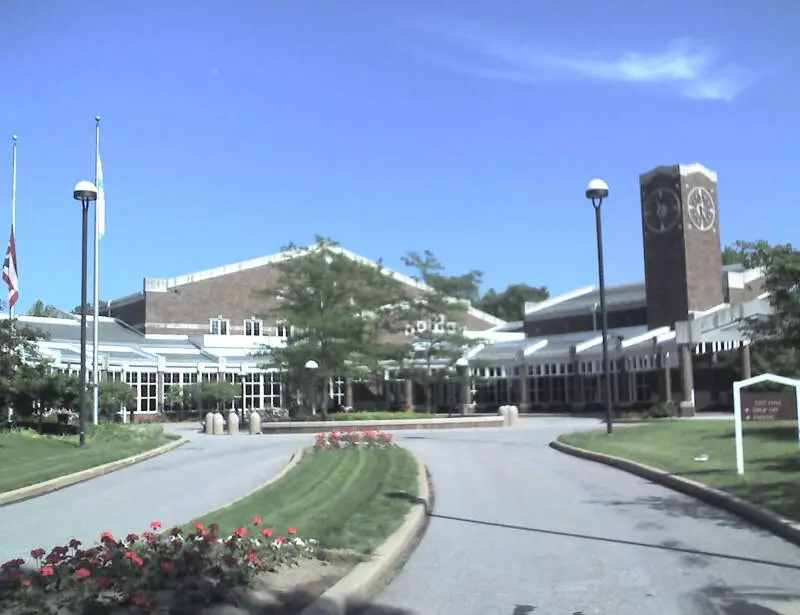
Population: 18,663
Average Annual Snowfall: 81.1 inches
More on Ashtabula: Data | Cost Of Living | Movers

/10
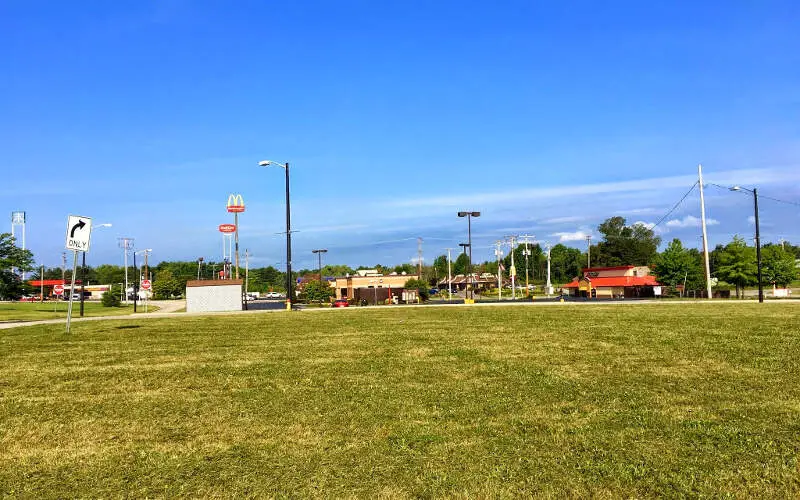
Population: 6,101
Average Annual Snowfall: 81.1 inches
More on Geneva: Data | Cost Of Living | Movers
/10
Population: 5,170
Average Annual Snowfall: 79.5 inches
More on Chardon: Data | Crime | Cost Of Living | Movers

/10
Population: 22,792
Average Annual Snowfall: 73.1 inches
More on Maple Heights: Data | Crime | Cost Of Living | Movers

/10
Population: 23,114
Average Annual Snowfall: 72.3 inches
More on Solon: Data | Crime | Cost Of Living | Movers

/10
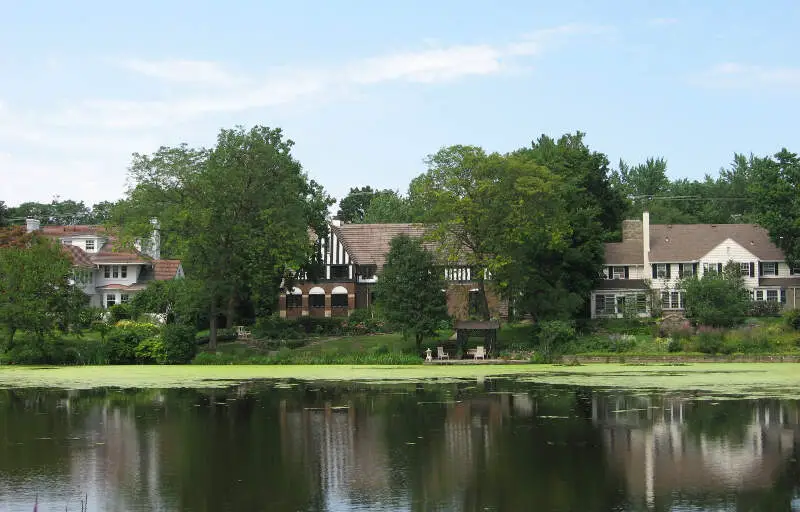
Population: 27,934
Average Annual Snowfall: 71.2 inches
More on Shaker Heights: Data | Cost Of Living | Movers

/10
Population: 18,918
Average Annual Snowfall: 70.7 inches
More on Mayfield Heights: Data | Crime | Cost Of Living | Movers

/10
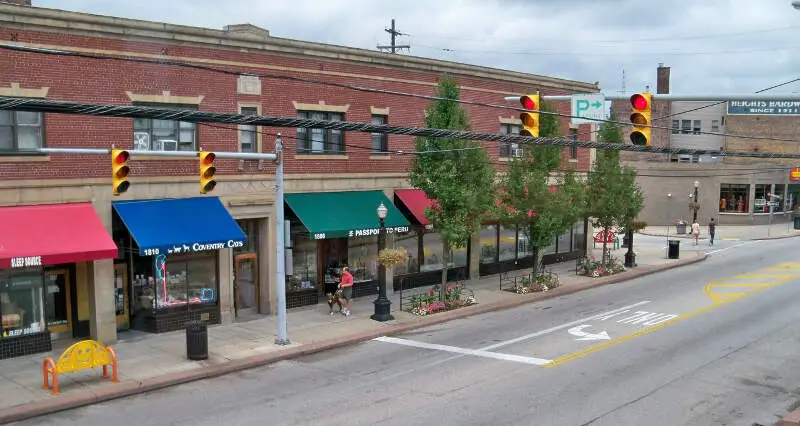
Population: 45,388
Average Annual Snowfall: 70.4 inches
More on Cleveland Heights: Data | Crime | Cost Of Living | Movers

/10
Population: 21,971
Average Annual Snowfall: 70.2 inches
More on South Euclid: Data | Crime | Cost Of Living | Movers
How We Determined The Cities In Ohio With The Most Snow
In order to rank the snowiest cities in Ohio, we used Saturday Night Science and the National Oceanic and Atmospheric Administration (NOAA) database, to see which cities in the Buckeye State get the most annual snowfall.
We updated this article for 2026. This is our second time ranking the snowiest cities in Ohio.
Before we get too far, here are the annual snowfall rates for major cities:
- Columbus — 22.3 inches
- Cleveland — 60.0 inches
- Cincinnati — 14.3 inches
The snowiest cities in Ohio are Conneaut, Ashtabula, Geneva, Chardon, Maple Heights, Solon, Shaker Heights, Mayfield Heights, Cleveland Heights, and South Euclid.
There’s a complete chart at the bottom.
If you’re curious, here are the places that get the least amount of snow in Ohio with at least snow snowfall:
- Portsmouth — 8.8 inches
- Wheelersburg — 10.4 inches
- Middletown — 10.9 inches
For more Ohio reading, check out:
Detailed List Of The Snowiest Places In Ohio
| Rank | City | Snow (Inches) | Population |
|---|---|---|---|
| 1 | Conneaut | 94.0 | 12,806 |
| 2 | Ashtabula | 81.1 | 18,663 |
| 3 | Geneva | 81.1 | 6,101 |
| 4 | Chardon | 79.5 | 5,170 |
| 5 | Maple Heights | 73.1 | 22,792 |
| 6 | Solon | 72.3 | 23,114 |
| 7 | Shaker Heights | 71.2 | 27,934 |
| 8 | Mayfield Heights | 70.7 | 18,918 |
| 9 | Cleveland Heights | 70.4 | 45,388 |
| 10 | South Euclid | 70.2 | 21,971 |
| 11 | Richmond Heights | 70.0 | 10,485 |
| 12 | Twinsburg | 69.8 | 18,820 |
| 13 | East Cleveland | 69.7 | 17,519 |
| 14 | Aurora | 68.6 | 15,663 |
| 15 | Euclid | 68.5 | 48,105 |
| 16 | Wickliffe | 68.3 | 12,629 |
| 17 | Willoughby | 66.3 | 22,433 |
| 18 | Eastlake | 65.3 | 18,380 |
| 19 | Painesville | 63.4 | 19,694 |
| 20 | Willowick | 63.4 | 14,051 |
| 21 | Willoughby Hills | 63.4 | 9,428 |
| 22 | North Madison | 63.4 | 8,961 |
| 23 | Mentor-On-The-Lake | 63.4 | 7,432 |
| 24 | Kirtland | 63.4 | 6,836 |
| 25 | Fairview Park | 63.2 | 16,552 |
| 26 | Middleburg Heights | 61.7 | 15,790 |
| 27 | Lyndhurst | 61.7 | 13,792 |
| 28 | Warrensville Heights | 61.7 | 13,336 |
| 29 | University Heights | 61.7 | 13,331 |
| 30 | Beachwood | 61.7 | 11,801 |
| 31 | Bedford Heights | 61.7 | 10,665 |
| 32 | Olmsted Falls | 61.7 | 8,923 |
| 33 | Highland Heights | 61.7 | 8,337 |
| 34 | Independence | 61.7 | 7,144 |
| 35 | Pepper Pike | 61.7 | 6,115 |
| 36 | Rocky River | 61.1 | 20,187 |
| 37 | Brook Park | 60.9 | 18,956 |
| 38 | Berea | 60.8 | 19,001 |
| 39 | Cleveland | 60.0 | 390,584 |
| 40 | North Olmsted | 59.5 | 32,248 |
| 41 | Bedford | 59.5 | 12,868 |
| 42 | Lakewood | 58.5 | 51,155 |
| 43 | Macedonia | 58.3 | 11,469 |
| 44 | Parma Heights | 58.1 | 20,409 |
| 45 | Mentor | 57.4 | 46,952 |
| 46 | Westlake | 57.4 | 32,469 |
| 47 | Brooklyn | 57.0 | 11,002 |
| 48 | Bay Village | 56.4 | 15,469 |
| 49 | Parma | 56.2 | 80,380 |
| 50 | Strongsville | 55.6 | 44,649 |
| 51 | Garfield Heights | 55.1 | 28,365 |
| 52 | North Royalton | 54.9 | 30,321 |
| 53 | Seven Hills | 54.5 | 11,716 |
| 54 | Broadview Heights | 53.7 | 19,268 |
| 55 | Brecksville | 53.2 | 13,516 |
| 56 | Streetsboro | 52.1 | 16,222 |
| 57 | Brunswick | 51.8 | 34,512 |
| 58 | Avon Lake | 51.8 | 23,052 |
| 59 | Hudson | 51.6 | 22,389 |
| 60 | Stow | 50.6 | 34,765 |
| 61 | Munroe Falls | 50.2 | 5,025 |
| 62 | Avon | 49.6 | 22,046 |
| 63 | Ravenna | 49.6 | 11,642 |
| 64 | Sheffield Lake | 49.2 | 9,063 |
| 65 | Grafton | 49.1 | 6,090 |
| 66 | Kent | 48.8 | 29,563 |
| 67 | Lorain | 48.5 | 63,778 |
| 68 | Amherst | 47.9 | 12,114 |
| 69 | North Ridgeville | 47.8 | 31,240 |
| 70 | Elyria | 46.9 | 54,050 |
| 71 | Niles | 46.7 | 18,886 |
| 72 | Girard | 46.7 | 9,716 |
| 73 | Hubbard | 46.7 | 7,745 |
| 74 | Howland Center | 46.7 | 6,812 |
| 75 | Champion Heights | 46.7 | 6,494 |
| 76 | Green | 45.5 | 25,868 |
| 77 | Norton | 45.5 | 12,054 |
| 78 | Fairlawn | 45.5 | 7,429 |
| 79 | Portage Lakes | 45.5 | 7,038 |
| 80 | Cortland | 45.0 | 7,001 |
| 81 | Oberlin | 44.0 | 8,356 |
| 82 | Youngstown | 43.8 | 65,573 |
| 83 | Campbell | 43.8 | 8,075 |
| 84 | Medina | 43.7 | 26,529 |
| 85 | Tallmadge | 43.6 | 17,459 |
| 86 | Struthers | 43.1 | 10,515 |
| 87 | Cuyahoga Falls | 42.8 | 49,287 |
| 88 | Akron | 42.7 | 198,329 |
| 89 | Mansfield | 41.6 | 46,998 |
| 90 | Vermilion | 40.2 | 10,462 |
| 91 | Massillon | 39.7 | 32,215 |
| 92 | Boardman | 39.6 | 34,794 |
| 93 | Austintown | 39.6 | 28,759 |
| 94 | Canfield | 39.6 | 7,424 |
| 95 | Ontario | 39.6 | 6,142 |
| 96 | Lexington | 39.6 | 5,712 |
| 97 | Canton | 39.3 | 72,463 |
| 98 | Barberton | 39.0 | 26,340 |
| 99 | New Franklin | 39.0 | 14,258 |
| 100 | North Canton | 38.1 | 17,431 |