
Are you looking for love in California?
Or are you just hoping to hook up with a hot Californian?
Either way, we’ve got you covered here.
If you live in California, there’s a pretty good chance there are a lot of singles in your area. The Golden State has plenty of people over 18 who aren’t married or in a serious relationship.
That’s great news for people who are single and looking to mingle.
So, where are the best cities for singles in California? We used Saturday Night Science to find out.
Table Of Contents: Top Ten | Methodology | Summary | Table
The 10 Best Cities For Singles In California For 2026
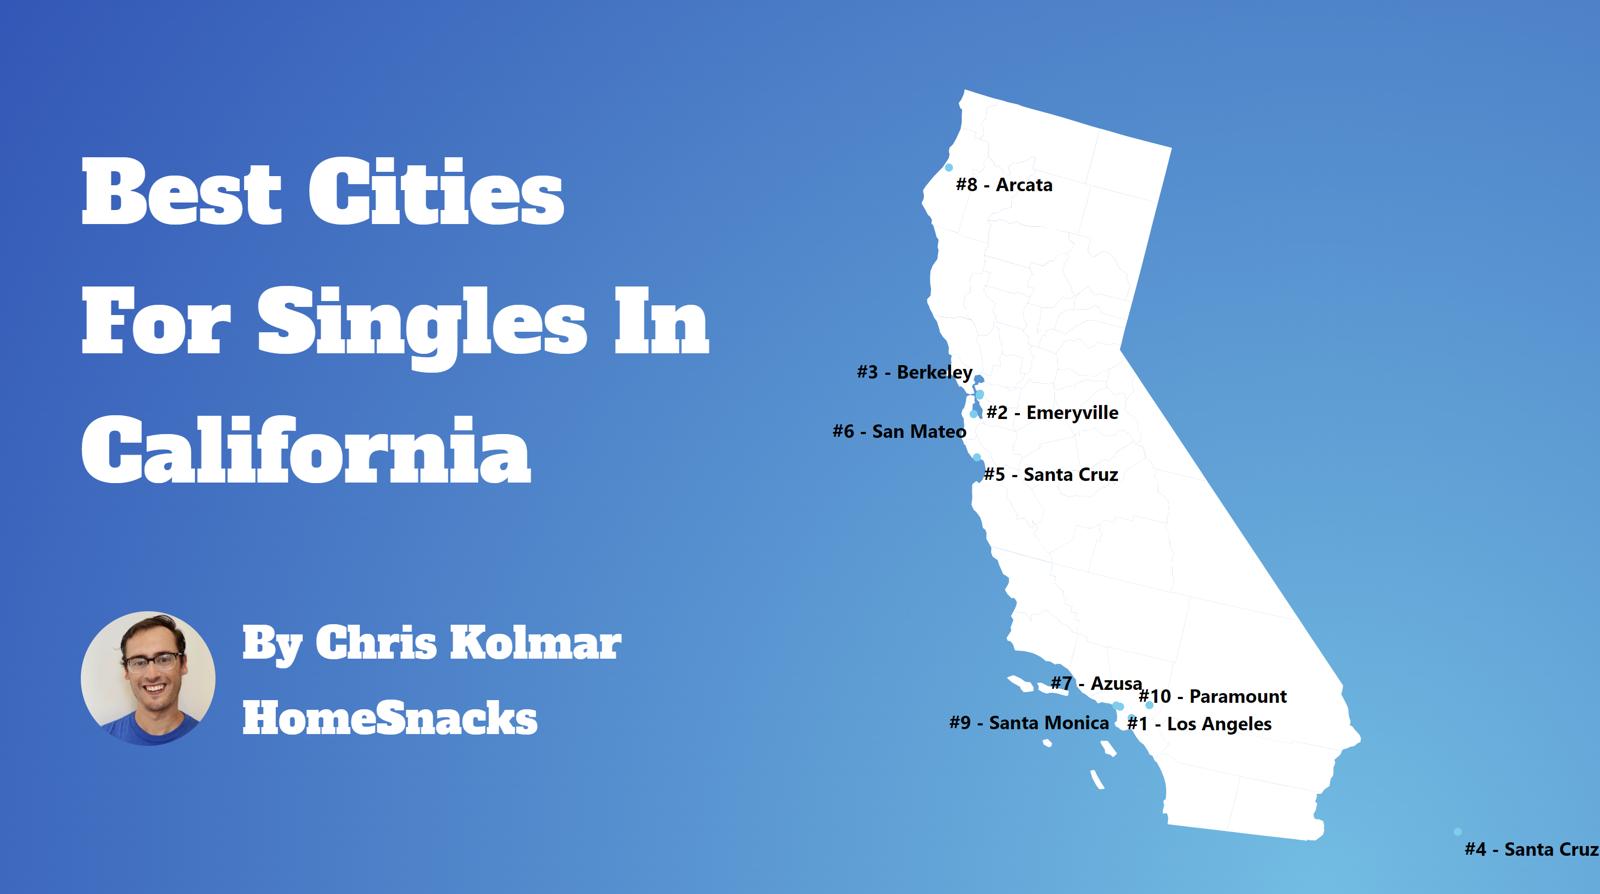
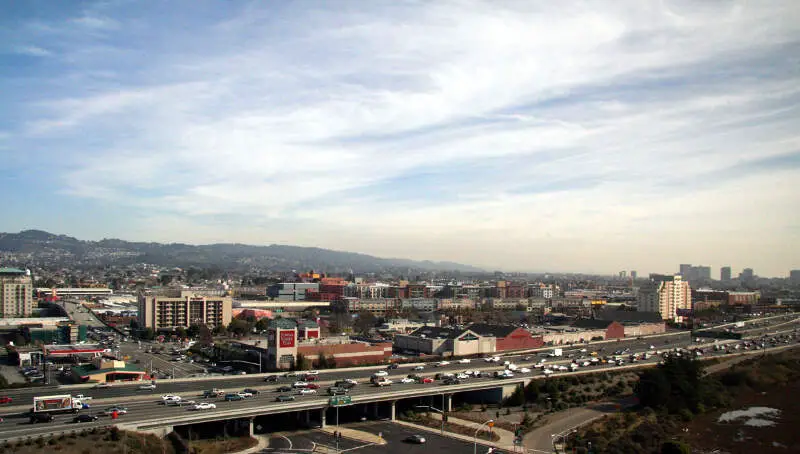
So, what was the best city for singles in California? Emeryville ranks as the best place for singles in California if you care about things singles care about, like nightlife, affordable housing, and other singles.
Read below to see how we crunched the numbers and how each city ranked. If you live in or are close to one of these cities and are single, you should probably get out more often.
Just saying.
For more California reading, check out:
- Best Places To Live In California
- Cheapest Places To Live In California
- Most Dangerous Cities In California
The 10 Best Cities For Singles In California For 2026

/10
Population: 13,081
Median Age: 34.5
Married households: 8.0%
Households with kids: 9.5%
More on Emeryville: Data | Crime | Cost Of Living | Movers

/10
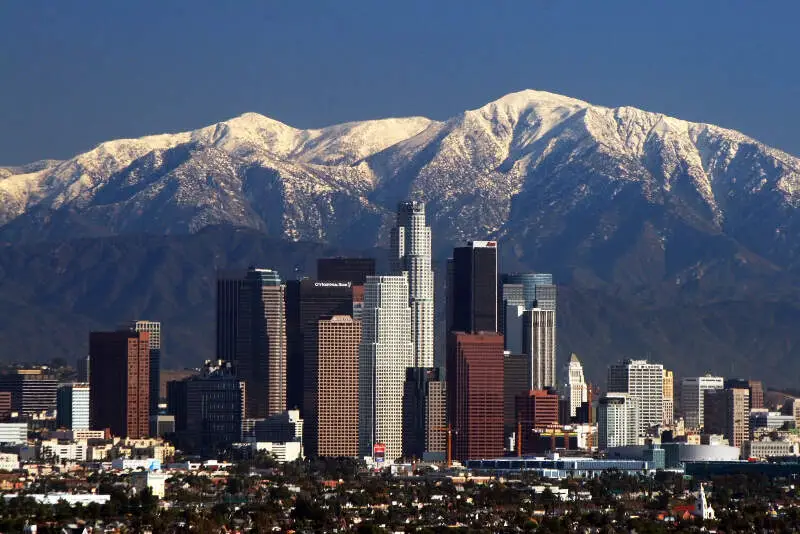
Population: 3,857,263
Median Age: 37.2
Married households: 10.0%
Households with kids: 26.5%
More on Los Angeles: Data | Crime | Cost Of Living | Movers

I hated being LA. The people in the city are awful, it’s hot, it stinks. I can go on and on. There’s nice places with jerky people. There’s scummy places with even worse people. Trash in the streets everywhere. Everything is expensive.
Watch out for people trying to hustle you for money and people trying to sell you drugs.

/10
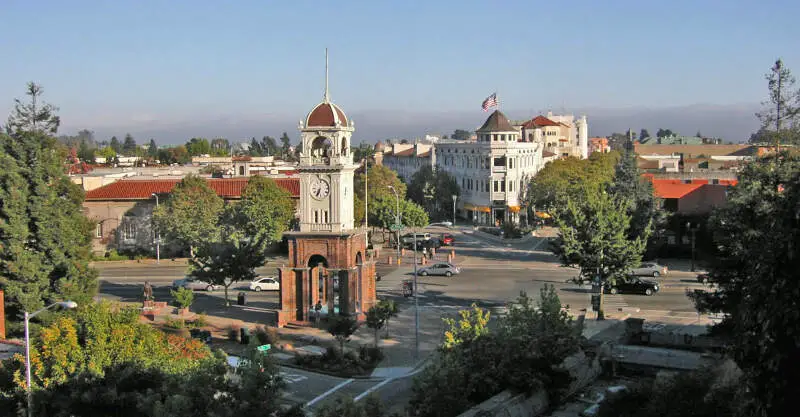
Population: 61,607
Median Age: 31.1
Married households: 14.0%
Households with kids: 20.1%
More on Santa Cruz: Data | Crime | Cost Of Living | Movers
Lived here my whole life and it was as fine until the 2000’s after which the homeless population sprouted yet was supported with needle exchange and medical marijuana.
Can’t beat twin lakes beach st the harbor- 3 great restaurants on the water, breakfast at the Palo mar or cross nest is great.
Crackheads everywhere and people smoking weed next to cops on the street

/10
Population: 13,691
Median Age: 34.8
Married households: 10.0%
Households with kids: 38.2%
More on Hawaiian Gardens: Data | Crime | Cost Of Living | Movers

/10
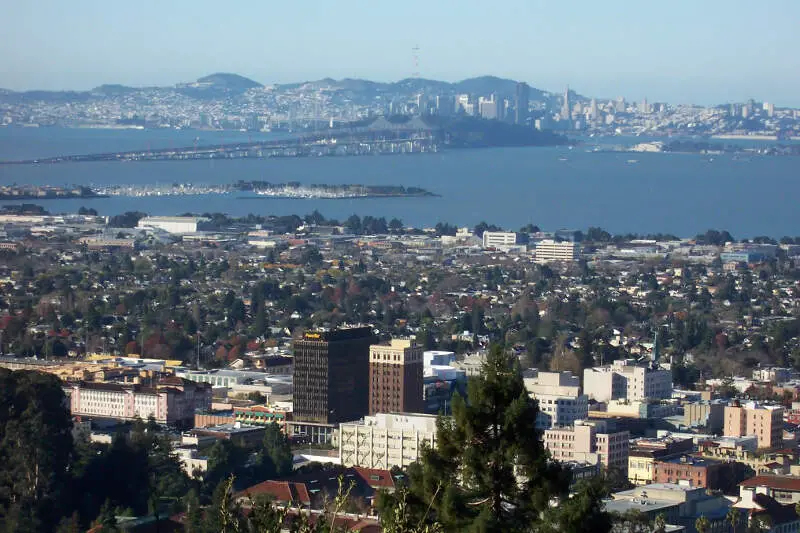
Population: 120,257
Median Age: 33.2
Married households: 10.0%
Households with kids: 18.9%
More on Berkeley: Data | Crime | Cost Of Living | Movers
Berkeley welcomes all homeless, does nothing to dissuade transient crime, bums are deeply comfortable strewing their trash and feces all over the streets and have taken over downtown.
Berkeley is the perfect college town! There are so many amazing places to eat and hangout, and the weather is usually pretty nice.
Berkeley is a wonderful city full of an interesting, open-minded and intelligent group of people. The city is very culturally diverse and open to accepting anyone from anywhere. The food scene is to die for and if organically grown is what you live by, look no further than Berkeley grocery stores, farmers markets and more.

/10
Population: 52,050
Median Age: 33.4
Married households: 9.0%
Households with kids: 43.2%
More on Paramount: Data | Crime | Cost Of Living | Movers

/10
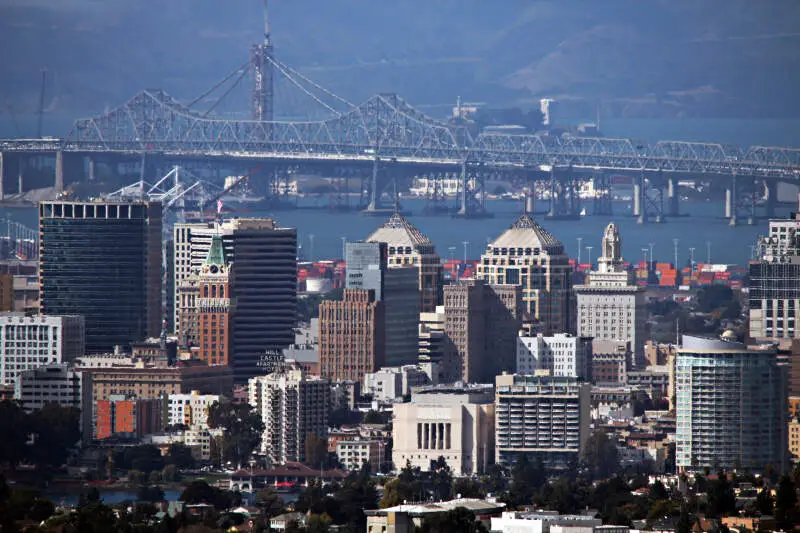
Population: 439,418
Median Age: 37.9
Married households: 12.0%
Households with kids: 26.0%
More on Oakland: Data | Crime | Cost Of Living | Movers
To everybody thinking about moving to Oakland : It’s dreadful, horrible chaos. Please just stay where you are.
Actually, Oakland s a wonderful place to live. We just don’t need any more people here. Really.
Bad: weather. Bad: diverse, fun population. You’ve been warned. Lol

/10
Population: 53,108
Median Age: 34.6
Married households: 7.0%
Households with kids: 45.4%
More on Huntington Park: Data | Crime | Cost Of Living | Movers

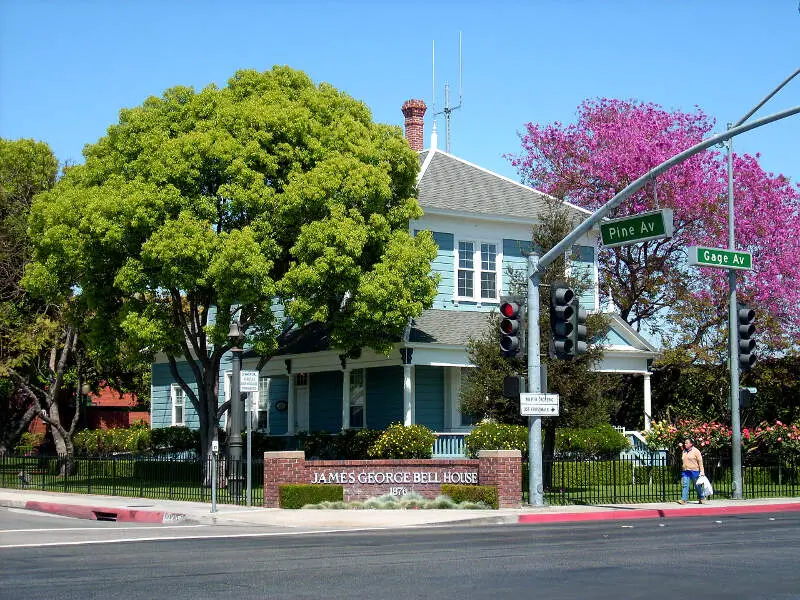
/10
Population: 32,476
Median Age: 34.3
Married households: 7.0%
Households with kids: 43.4%
More on Bell: Data | Crime | Cost Of Living | Movers

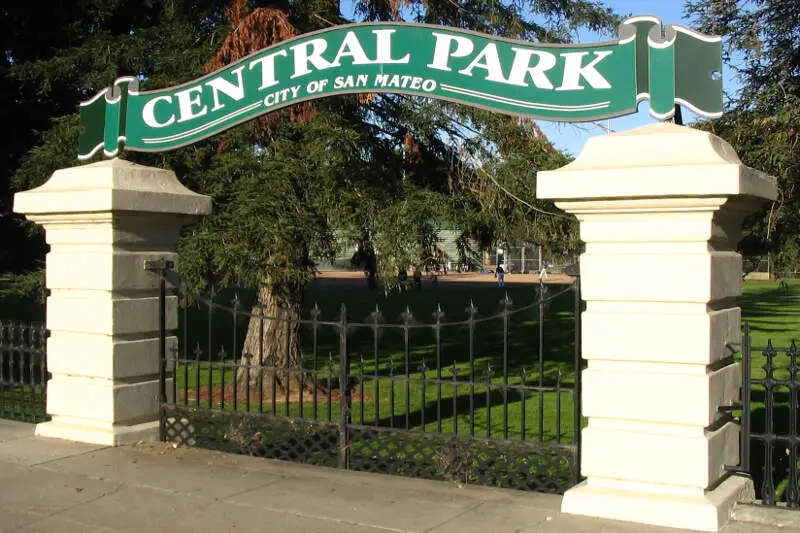
/10
Population: 103,105
Median Age: 38.3
Married households: 15.0%
Households with kids: 27.7%
More on San Mateo: Data | Crime | Cost Of Living | Movers
Methodology: How do you determine which city is best for singles in California anyways?
To give you the places in California which are best for singles to find one another, we used Saturday Night Science to look at a handful of metrics. Of course, we want to measure the type of people who live in each city and make some assumptions about what single people like.
So we researched the internet for a database that contains all that information.
We threw a lot of criteria at this one to get the best, most complete results possible. Using the 2020-2024 American Community Survey Census data produced for the state of California, we looked at every single city in the state. We paid particular attention to:
- Population density
- % of population that’s male vs. female (closer to a 50-50 ratio is better)
- % of households with kids
- Median age
- Number of unmarried people in each city
We then gave each city a “Singles Score.”
The higher the score, the better the city is for singles to find one another. We also limited our results to cities with over 10,000 people. For California, that meant a total of 361 cities.
We updated this article for 2026. This is our eleventh time ranking the best cities for singles in California.
Read on to see why Emeryville is the talk of the town while Norco is probably a bit on the bland side.
Summary: The Best Cities for Singles in California for 2026
If you’re looking for a breakdown of cities in California ranked by criteria that most agree make a place a great spot for finding a single person (and potentially love), this is an accurate list.
The best cities for singles in California are Emeryville, Los Angeles, Santa Cruz, Hawaiian Gardens, Berkeley, Paramount, Oakland, Huntington Park, Bell, and San Mateo.
Here’s a look at the most boring cities in California according to the data:
- Norco
- Lafayette
- Lincoln
For more California reading, check out:
- Best Places To Raise A Family In California
- Safest Places In California
- Worst Places To Live In California
Best Cities For Singles In California
| Rank | City | Population | Median Age | % Married Households | % Households /w Kids |
|---|---|---|---|---|---|
| 1 | Emeryville, CA | 13,081 | 34.5 | 8.0% | 9.5% |
| 2 | Los Angeles, CA | 3,857,263 | 37.2 | 10.0% | 26.5% |
| 3 | Santa Cruz, CA | 61,607 | 31.1 | 14.0% | 20.1% |
| 4 | Hawaiian Gardens, CA | 13,691 | 34.8 | 10.0% | 38.2% |
| 5 | Berkeley, CA | 120,257 | 33.2 | 10.0% | 18.9% |
| 6 | Paramount, CA | 52,050 | 33.4 | 9.0% | 43.2% |
| 7 | Oakland, CA | 439,418 | 37.9 | 12.0% | 26.0% |
| 8 | Huntington Park, CA | 53,108 | 34.6 | 7.0% | 45.4% |
| 9 | Bell, CA | 32,476 | 34.3 | 7.0% | 43.4% |
| 10 | San Mateo, CA | 103,105 | 38.3 | 15.0% | 27.7% |
| 11 | Bell Gardens, CA | 38,229 | 32.3 | 8.0% | 49.8% |
| 12 | San Francisco, CA | 830,235 | 40.0 | 10.0% | 18.1% |
| 13 | Davis, CA | 66,978 | 26.4 | 15.0% | 20.1% |
| 14 | Watsonville, CA | 51,712 | 33.8 | 13.0% | 41.7% |
| 15 | Long Beach, CA | 455,548 | 37.1 | 15.0% | 27.3% |
| 16 | Garden Grove, CA | 170,964 | 40.2 | 10.0% | 36.9% |
| 17 | San Diego, CA | 1,389,526 | 36.2 | 13.0% | 26.1% |
| 18 | San Pablo, CA | 31,720 | 34.6 | 9.0% | 43.7% |
| 19 | Pomona, CA | 147,943 | 36.0 | 14.0% | 38.0% |
| 20 | Seaside, CA | 31,814 | 34.0 | 13.0% | 34.6% |
| 21 | San Luis Obispo, CA | 48,491 | 26.3 | 16.0% | 13.9% |
| 22 | Hawthorne, CA | 85,191 | 33.9 | 10.0% | 37.0% |
| 23 | Salinas, CA | 161,761 | 32.4 | 13.0% | 46.6% |
| 24 | Mountain View, CA | 83,732 | 35.5 | 8.0% | 27.1% |
| 25 | Pasadena, CA | 136,969 | 40.1 | 14.0% | 22.2% |
| 26 | Santa Clara, CA | 130,256 | 34.6 | 11.0% | 27.6% |
| 27 | Baldwin Park, CA | 70,138 | 38.2 | 9.0% | 40.8% |
| 28 | South El Monte, CA | 19,287 | 37.2 | 9.0% | 41.3% |
| 29 | West Hollywood, CA | 34,884 | 40.0 | 6.0% | 3.4% |
| 30 | Redondo Beach, CA | 69,291 | 41.1 | 17.0% | 29.6% |
| 31 | South San Francisco, CA | 64,305 | 43.2 | 16.0% | 28.8% |
| 32 | Santa Maria, CA | 110,462 | 29.3 | 13.0% | 47.0% |
| 33 | San Bruno, CA | 42,307 | 39.8 | 20.0% | 26.5% |
| 34 | Montebello, CA | 61,045 | 40.1 | 15.0% | 34.2% |
| 35 | Alhambra, CA | 81,022 | 41.5 | 12.0% | 25.9% |
| 36 | Lynwood, CA | 64,578 | 33.6 | 9.0% | 50.1% |
| 37 | Norwalk, CA | 99,789 | 37.3 | 17.0% | 40.3% |
| 38 | Westminster, CA | 89,860 | 43.2 | 12.0% | 33.6% |
| 39 | Cudahy, CA | 22,087 | 30.7 | 9.0% | 47.2% |
| 40 | South Gate, CA | 91,483 | 36.3 | 11.0% | 41.6% |
| 41 | Sunnyvale, CA | 154,236 | 35.2 | 9.0% | 29.0% |
| 42 | Torrance, CA | 142,130 | 43.2 | 18.0% | 29.2% |
| 43 | East Palo Alto, CA | 29,069 | 36.3 | 9.0% | 32.9% |
| 44 | Arcata, CA | 18,607 | 28.1 | 10.0% | 18.4% |
| 45 | El Cajon, CA | 104,449 | 36.1 | 15.0% | 37.6% |
| 46 | Azusa, CA | 49,031 | 34.4 | 14.0% | 34.0% |
| 47 | Hermosa Beach, CA | 19,063 | 42.7 | 15.0% | 21.7% |
| 48 | Lawndale, CA | 30,781 | 36.9 | 11.0% | 35.2% |
| 49 | Oxnard, CA | 200,928 | 34.4 | 14.0% | 43.3% |
| 50 | Buena Park, CA | 82,871 | 37.3 | 16.0% | 39.0% |
| 51 | Fountain Valley, CA | 56,258 | 44.4 | 16.0% | 28.9% |
| 52 | Fullerton, CA | 140,968 | 36.9 | 18.0% | 32.2% |
| 53 | Escondido, CA | 149,668 | 36.9 | 16.0% | 34.8% |
| 54 | Sacramento, CA | 528,706 | 36.0 | 18.0% | 29.5% |
| 55 | El Monte, CA | 106,109 | 37.8 | 8.0% | 39.0% |
| 56 | Maywood, CA | 24,317 | 33.4 | 7.0% | 48.3% |
| 57 | Covina, CA | 49,888 | 38.2 | 21.0% | 32.8% |
| 58 | Lemon Grove, CA | 27,686 | 37.1 | 19.0% | 31.7% |
| 59 | El Cerrito, CA | 25,994 | 41.8 | 14.0% | 26.0% |
| 60 | San Bernardino, CA | 222,724 | 32.2 | 16.0% | 43.3% |
| 61 | Anaheim, CA | 344,521 | 36.2 | 14.0% | 35.8% |
| 62 | Inglewood, CA | 104,569 | 38.6 | 11.0% | 29.6% |
| 63 | Tustin, CA | 78,981 | 37.5 | 15.0% | 33.2% |
| 64 | Costa Mesa, CA | 110,330 | 36.7 | 19.0% | 26.2% |
| 65 | Santa Ana, CA | 312,534 | 34.7 | 11.0% | 42.1% |
| 66 | San Leandro, CA | 87,826 | 41.9 | 15.0% | 29.1% |
| 67 | Merced, CA | 91,953 | 30.0 | 17.0% | 42.0% |
| 68 | San Jose, CA | 990,138 | 38.2 | 12.0% | 33.5% |
| 69 | Santa Monica, CA | 91,169 | 42.7 | 10.0% | 14.5% |
| 70 | Santa Barbara, CA | 87,779 | 39.7 | 17.0% | 23.4% |
| 71 | Compton, CA | 92,698 | 33.3 | 12.0% | 45.6% |
| 72 | Hayward, CA | 158,801 | 38.6 | 11.0% | 34.6% |
| 73 | Fresno, CA | 545,970 | 32.8 | 21.0% | 37.7% |
| 74 | Rosemead, CA | 50,013 | 44.6 | 6.0% | 30.9% |
| 75 | Cerritos, CA | 47,867 | 47.7 | 13.0% | 29.8% |
| 76 | Glendale, CA | 190,748 | 41.4 | 9.0% | 27.5% |
| 77 | Oceanside, CA | 172,242 | 38.9 | 18.0% | 28.5% |
| 78 | South Pasadena, CA | 26,068 | 40.5 | 21.0% | 33.6% |
| 79 | La Habra, CA | 61,970 | 38.3 | 24.0% | 33.9% |
| 80 | El Centro, CA | 44,240 | 31.0 | 16.0% | 41.5% |
| 81 | Belmont, CA | 27,337 | 39.8 | 18.0% | 35.6% |
| 82 | Montclair, CA | 37,810 | 33.7 | 16.0% | 40.2% |
| 83 | Monterey, CA | 29,613 | 37.5 | 18.0% | 20.3% |
| 84 | Huntington Beach, CA | 195,240 | 44.0 | 23.0% | 23.9% |
| 85 | Imperial Beach, CA | 25,764 | 35.1 | 16.0% | 31.9% |
| 86 | Bellflower, CA | 76,819 | 36.0 | 16.0% | 38.3% |
| 87 | Menlo Park, CA | 32,727 | 39.5 | 14.0% | 31.2% |
| 88 | Selma, CA | 24,659 | 32.9 | 17.0% | 43.7% |
| 89 | Chico, CA | 102,188 | 31.1 | 21.0% | 24.5% |
| 90 | Marina, CA | 22,563 | 36.9 | 18.0% | 29.8% |
| 91 | Vista, CA | 99,114 | 35.9 | 18.0% | 35.5% |
| 92 | Orange, CA | 138,266 | 37.2 | 22.0% | 31.6% |
| 93 | Port Hueneme, CA | 21,582 | 37.8 | 14.0% | 31.9% |
| 94 | Richmond, CA | 115,505 | 37.9 | 11.0% | 32.7% |
| 95 | Commerce, CA | 11,993 | 35.6 | 11.0% | 37.0% |
| 96 | San Buenaventura (Ventura), CA | 109,857 | 41.3 | 24.0% | 27.0% |
| 97 | Goleta, CA | 32,685 | 36.9 | 20.0% | 27.5% |
| 98 | Irvine, CA | 311,690 | 34.0 | 11.0% | 33.6% |
| 99 | Parlier, CA | 14,507 | 26.6 | 8.0% | 59.6% |
| 100 | Campbell, CA | 42,781 | 39.9 | 17.0% | 29.5% |