Everyone wants a bit of a blissful breeze or a scoop of sunny sanctuary when looking for a place to live in Michigan.
The more sun, the more you can go outside. The more you go outside, the more you’ll feel at peace. The more you’ll feel at peace, the more you’ll enjoy where you live.
So it makes sense to try and find the places with the best weather in Michigan. We used Saturday Night Science to compare the number of sunny days, total precipitation, and the deviation from the ideal 70-degree weather for 104 places in Michigan over 10,000 people.
Grab your shades and put away your raincoat as we look at the cities with the best weather in Michigan.
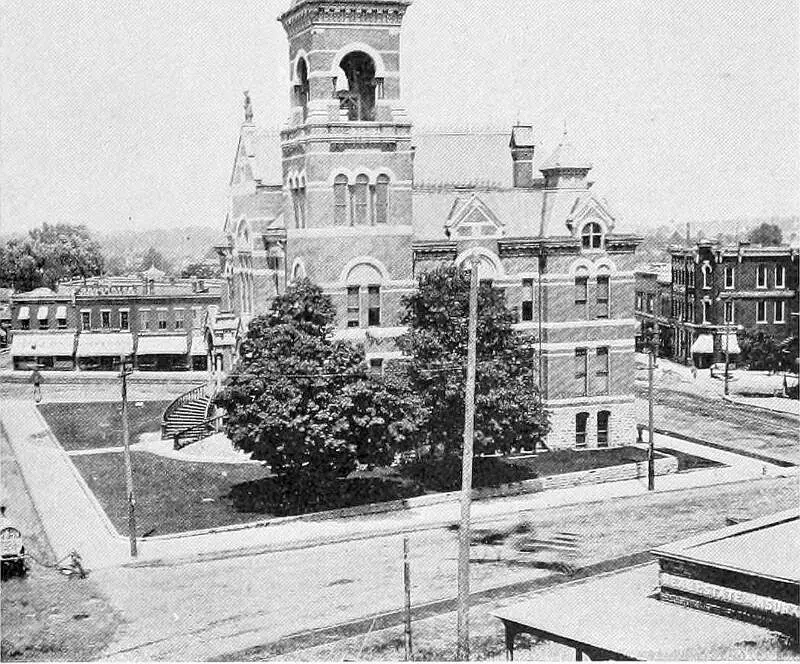
297.1 sunny days · 58.6 degree average high
Mount Clemens is a city in the U.S. state of Michigan. The population was 16,314 at the 2010 census. It is the county seat of Macomb County.
Data | Crime | Cost of living | Movers
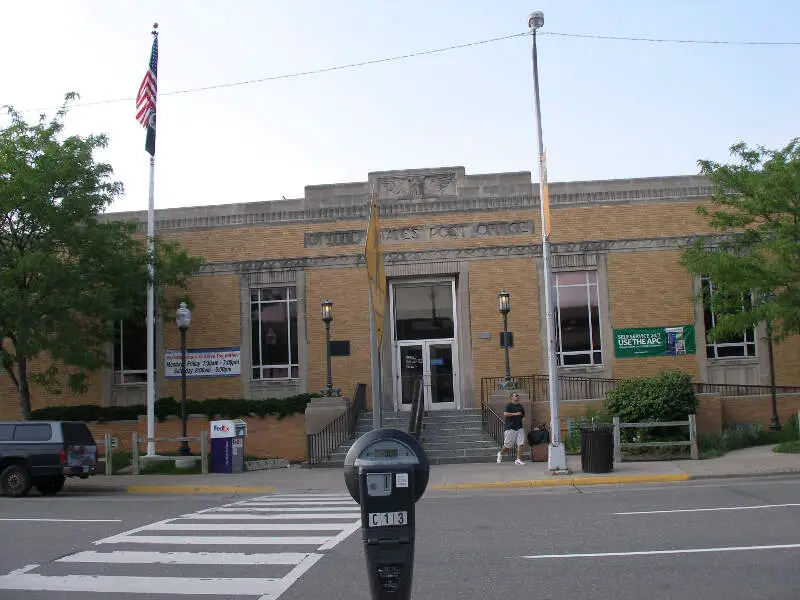
294.1 sunny days · 58.9 degree average high
Hazel Park is a city in Oakland County of the U.S. state of Michigan. As of the 2010 census, the city population was 16,422. Hazel Park was incorporated in 1941 and bills itself as “The Friendly City”.
Data | Crime | Cost of living | Movers

295.6 sunny days · 58.9 degree average high
Madison Heights is a city in Oakland County of the U.S. state of Michigan. It is a suburb of Detroit. As of the 2010 census, its population was 29,694.
Data | Crime | Cost of living | Movers
295.6 sunny days · 58.8 degree average high
Royal Oak is a city in Oakland County of the U.S. state of Michigan. It is a suburb of Detroit. As of the 2010 census, the city had a population of 57,236. It is the 8th-largest municipality in Oakland County and the 27th-largest municipality in Michigan by population.
Data | Crime | Cost of living | Movers

295.6 sunny days · 58.8 degree average high
Clawson is a city in Oakland County in the U.S. state of Michigan. It is part of the Detroit metropolitan area. At the 2010 census, its population was 11,825.
Data | Crime | Cost of living | Movers
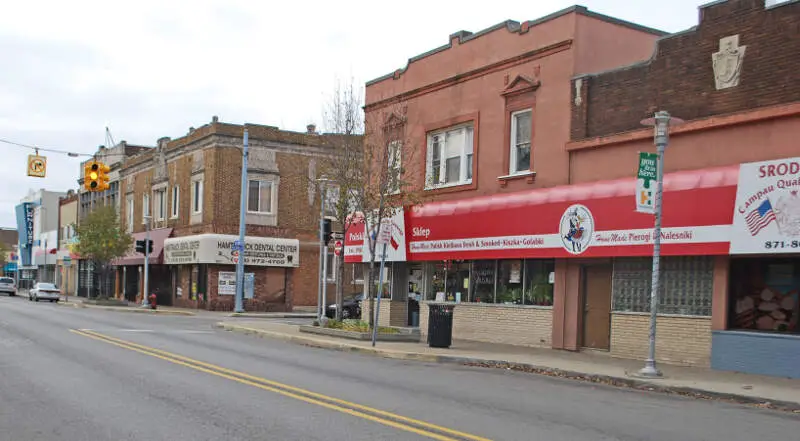
291.1 sunny days · 58.7 degree average high
Hamtramck is a city in Wayne County of the U.S. state of Michigan. As of the 2010 census, the city population was 22,423. Hamtramck is surrounded by the city of Detroit except for a small portion of the western border that touches the similarly surrounded city of Highland Park.
Data | Crime | Cost of living | Movers
287.8 sunny days · 58.9 degree average high
Fraser is a city in Macomb County of the U.S. state of Michigan. The population was 14,480 at the 2010 census. The city is part of the Metro Detroit region.
Data | Crime | Cost of living | Movers
287.8 sunny days · 58.8 degree average high
Eastpointe is a city in Macomb County of the U.S. state of Michigan. As of the 2010 census, the city population was 32,442. Eastpointe forms a part of the Metro Detroit area. It borders 8 Mile Road on the northern edge of Detroit.
Data | Crime | Cost of living | Movers
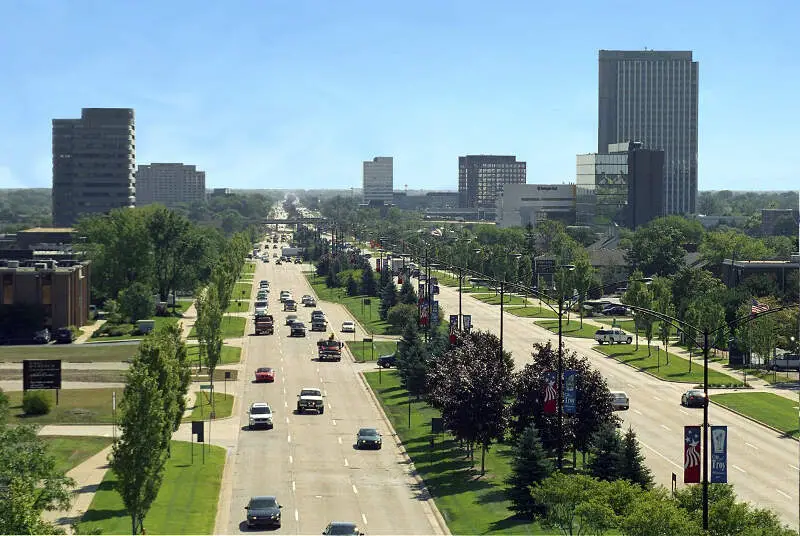
295.6 sunny days · 58.6 degree average high
Troy is a city located in Metropolitan Detroit’s northern suburbs in Oakland County in the U.S. state of Michigan. The population was 80,980 at the 2010 census, making it the 11th-largest city in Michigan by population, and the largest city in Oakland County. Troy has become a business and shopping destination in the Metro Detroit area, with numerous office centers and the upscale Somerset Collection mall.
Data | Crime | Cost of living | Movers
287.8 sunny days · 58.9 degree average high
Roseville is a city in Macomb County in the U.S. state of Michigan, and is a part of the Metro Detroit area. The population was 47,299 at the 2010 census. Until 1958, Roseville was a part of Erin Township.
Data | Crime | Cost of living | Movers
The receipts
Compare the top ten
Pick a metric. The bars rescale. The red line is Michigan’s statewide median.
On the map
Where Michigan’s best weather is
Saturday Night Science
How We Determined The Cities In Michigan With The Best Weather
To rank the most fair weather cities in Michigan, we used Saturday Night Science and the National Oceanic and Atmospheric Administration (NOAA) database, to see which cities in the Wolverine State get the best weather.
We used the following criteria to find the best weather:
- Number of sunny days
- Highest average low
- Average high deviation from 70 degrees
- Least amount of rain
- Least amount of snow
We ranked each city of over 10,000 people in Michigan from best to worst on each criterion. We then averaged each ranking into a weather quality index. The city with the best index, Mount Clemens, was anointed the city with the best weather in Michigan.
Before we get too far, here are the annual precipitation rates for major cities: Detroit (33.4 inches), Grand Rapids (36.4 inches), and Warren (32.5 inches).
The cities with the best weather in Michigan are Mount Clemens, Hazel Park, Madison Heights, Royal Oak, Clawson, Hamtramck, Fraser, Eastpointe, Troy, and Roseville.
There’s a complete chart at the bottom.
The full plate
Detailed List Of Places With The Best Weather In Michigan
Click any column to sort. Search by city name.
| Rank | City | Population | Sunny Days | Avg. High | Precipitation (Inches) | Snow (Inches) |
|---|---|---|---|---|---|---|
| 1 | Mount Clemens | 16,381 | 297.1 | 58.6 | 32.1 | 31.7 |
| 2 | Hazel Park | 16,600 | 294.1 | 58.9 | 32.6 | 31.8 |
| 3 | Madison Heights | 30,123 | 295.6 | 58.9 | 32.9 | 32.2 |
| 4 | Royal Oak | 58,689 | 295.6 | 58.8 | 32.8 | 32.6 |
| 5 | Clawson | 11,988 | 295.6 | 58.8 | 32.8 | 32.9 |
| 6 | Hamtramck | 22,150 | 291.1 | 58.7 | 32.2 | 31.2 |
| 7 | Fraser | 14,582 | 287.8 | 58.9 | 32.8 | 31.3 |
| 8 | Eastpointe | 32,585 | 287.8 | 58.8 | 32.8 | 29.8 |
| 9 | Troy | 82,542 | 295.6 | 58.6 | 32.7 | 33.3 |
| 10 | Roseville | 47,529 | 287.8 | 58.9 | 32.9 | 30.8 |
| 11 | Sterling Heights | 131,139 | 294.0 | 58.9 | 33.3 | 32.2 |
| 12 | Warren | 134,857 | 287.8 | 58.8 | 32.5 | 31.3 |
| 13 | Ferndale | 20,160 | 291.1 | 58.9 | 32.9 | 32.1 |
| 14 | Berkley | 15,178 | 295.6 | 58.7 | 32.8 | 35.8 |
| 15 | Dearborn | 96,069 | 291.1 | 59.0 | 33.6 | 33.8 |
| 16 | Birmingham | 20,489 | 295.6 | 58.4 | 32.5 | 36.0 |
| 17 | Allen Park | 27,676 | 291.1 | 59.0 | 33.7 | 34.8 |
| 18 | Melvindale | 10,510 | 291.1 | 59.0 | 33.8 | 33.9 |
| 19 | Dearborn Heights | 56,656 | 291.1 | 59.0 | 33.5 | 35.2 |
| 20 | Lincoln Park | 37,362 | 291.1 | 58.9 | 34.0 | 34.6 |
| 21 | New Baltimore | 12,212 | 293.5 | 58.5 | 33.2 | 31.9 |
| 22 | Garden City | 27,161 | 291.7 | 59.0 | 33.4 | 37.1 |
| 23 | St. Clair Shores | 59,888 | 290.9 | 58.2 | 33.2 | 30.2 |
| 24 | Oak Park | 29,727 | 291.1 | 58.8 | 33.0 | 35.7 |
| 25 | Detroit | 690,074 | 289.2 | 58.8 | 33.4 | 32.5 |
| 26 | Southfield | 72,859 | 292.7 | 58.6 | 32.9 | 35.9 |
| 27 | Rochester Hills | 72,643 | 295.6 | 57.8 | 32.8 | 34.2 |
| 28 | Auburn Hills | 22,085 | 295.6 | 57.4 | 32.1 | 35.4 |
| 29 | Inkster | 24,897 | 291.7 | 58.9 | 33.4 | 37.3 |
| 30 | Harper Woods | 13,964 | 287.8 | 58.6 | 33.5 | 29.4 |
| 31 | Southgate | 29,518 | 291.1 | 58.7 | 34.0 | 35.5 |
| 32 | Riverview | 12,266 | 291.7 | 58.5 | 34.2 | 35.8 |
| 33 | Taylor | 62,021 | 291.7 | 58.8 | 33.5 | 37.9 |
| 34 | Grosse Pointe Park | 11,343 | 287.8 | 58.5 | 34.0 | 29.2 |
| 35 | Wyandotte | 25,376 | 291.1 | 58.5 | 34.3 | 34.9 |
| 36 | Livonia | 95,312 | 291.3 | 58.8 | 33.3 | 36.6 |
| 37 | Pontiac | 59,928 | 295.6 | 57.2 | 32.1 | 35.8 |
| 38 | Rochester | 12,909 | 294.5 | 57.6 | 32.7 | 36.4 |
| 39 | Farmington | 10,509 | 294.5 | 57.6 | 32.7 | 36.4 |
| 40 | Beverly Hills | 10,403 | 294.5 | 57.6 | 32.7 | 36.4 |
| 41 | Woodhaven | 12,645 | 290.4 | 58.7 | 33.5 | 35.2 |
| 42 | Highland Park | 11,102 | 290.4 | 58.7 | 33.5 | 35.2 |
| 43 | Farmington Hills | 80,971 | 294.5 | 57.9 | 33.0 | 36.3 |
| 44 | Westland | 82,642 | 291.7 | 58.8 | 33.4 | 39.1 |
| 45 | Midland | 41,995 | 297.6 | 57.5 | 32.0 | 40.8 |
| 46 | Grosse Pointe Woods | 15,859 | 287.8 | 58.2 | 34.4 | 28.9 |
| 47 | Jackson | 33,255 | 296.2 | 57.6 | 32.6 | 37.4 |
| 48 | Trenton | 18,522 | 291.7 | 58.3 | 34.3 | 36.2 |
| 49 | Wayne | 17,251 | 291.7 | 58.8 | 33.4 | 41.2 |
| 50 | Romulus | 23,557 | 291.7 | 58.8 | 33.5 | 41.7 |
| 51 | Monroe | 20,335 | 291.4 | 58.9 | 34.1 | 40.7 |
| 52 | Flint | 99,802 | 296.5 | 57.3 | 31.7 | 38.2 |
| 53 | Burton | 29,223 | 295.8 | 57.3 | 31.9 | 37.6 |
| 54 | Beecher | 10,184 | 296.4 | 57.2 | 32.0 | 37.3 |
| 55 | Adrian | 20,878 | 288.8 | 59.1 | 36.0 | 28.8 |
| 56 | Fenton | 11,538 | 295.8 | 56.7 | 32.5 | 37.3 |
| 57 | Novi | 57,577 | 295.6 | 57.4 | 33.1 | 39.8 |
| 58 | Wixom | 13,690 | 295.6 | 57.4 | 32.8 | 45.4 |
| 59 | Sturgis | 10,916 | 291.3 | 58.3 | 38.6 | 29.6 |
| 60 | Owosso | 14,826 | 294.7 | 57.4 | 32.5 | 37.5 |
| 61 | Bay City | 34,402 | 294.9 | 57.0 | 31.2 | 41.2 |
| 62 | Mount Pleasant | 26,134 | 298.7 | 56.5 | 32.1 | 41.9 |
| 63 | East Lansing | 48,669 | 296.9 | 57.1 | 32.8 | 43.4 |
| 64 | Saginaw | 50,288 | 292.7 | 57.6 | 32.8 | 41.7 |
| 65 | Escanaba | 12,468 | 299.9 | 51.0 | 28.5 | 49.1 |
| 66 | Haslett | 20,057 | 296.9 | 57.0 | 33.0 | 42.8 |
| 67 | Holt | 24,289 | 295.2 | 57.1 | 33.2 | 43.1 |
| 68 | Okemos | 22,073 | 295.2 | 57.1 | 33.2 | 43.1 |
| 69 | Lansing | 114,485 | 295.1 | 57.1 | 33.0 | 46.6 |
| 70 | Battle Creek | 51,830 | 294.2 | 58.3 | 35.7 | 57.0 |
| 71 | Holland | 33,526 | 293.7 | 57.7 | 36.0 | 75.8 |
| 72 | Alpena | 10,273 | 292.2 | 53.1 | 29.5 | 78.7 |
| 73 | South Lyon | 11,616 | 283.4 | 57.7 | 33.3 | 44.7 |
| 74 | Portage | 47,496 | 285.6 | 58.8 | 38.7 | 46.2 |
| 75 | Ypsilanti | 19,874 | 286.8 | 58.7 | 34.9 | 46.7 |
| 76 | Marquette | 21,444 | 293.3 | 50.8 | 29.7 | 128.0 |
| 77 | Port Huron | 29,508 | 288.5 | 55.9 | 34.8 | 37.0 |
| 78 | Kalamazoo | 75,499 | 283.3 | 58.9 | 38.8 | 57.4 |
| 79 | Waverly | 24,535 | 290.4 | 57.4 | 34.4 | 47.7 |
| 80 | Ann Arbor | 116,194 | 283.4 | 58.6 | 35.9 | 52.8 |
| 81 | Norton Shores | 23,982 | 290.9 | 56.0 | 33.7 | 88.5 |
| 82 | Allendale | 18,456 | 290.6 | 57.3 | 35.9 | 72.6 |
| 83 | Jenison | 17,004 | 290.6 | 57.3 | 35.9 | 72.6 |
| 84 | Grand Haven | 10,819 | 290.6 | 57.3 | 35.9 | 72.6 |
| 85 | Muskegon Heights | 10,809 | 290.9 | 56.5 | 33.9 | 89.7 |
| 86 | Traverse City | 15,168 | 289.6 | 54.9 | 31.9 | 113.5 |
| 87 | Niles | 11,450 | 284.5 | 58.4 | 38.2 | 73.1 |
| 88 | Benton Harbor | 10,014 | 284.5 | 58.4 | 38.2 | 73.1 |
| 89 | Muskegon | 37,861 | 290.9 | 56.5 | 34.2 | 86.1 |
| 90 | Coldwater | 10,866 | 286.0 | 57.8 | 38.0 | 49.5 |
| 91 | Ionia | 11,384 | 290.8 | 57.0 | 35.6 | 56.8 |
| 92 | Kentwood | 50,286 | 287.5 | 57.2 | 36.8 | 72.5 |
| 93 | Grandville | 15,739 | 287.5 | 57.0 | 36.4 | 69.2 |
| 94 | Wyoming | 74,105 | 287.5 | 57.0 | 36.3 | 70.8 |
| 95 | Northview | 15,278 | 287.5 | 57.2 | 36.5 | 64.8 |
| 96 | Grand Rapids | 192,416 | 287.5 | 57.1 | 36.4 | 65.7 |
| 97 | Forest Hills | 27,415 | 287.5 | 57.1 | 36.9 | 71.2 |
| 98 | Walker | 24,242 | 285.5 | 57.2 | 36.4 | 63.7 |
| 99 | Cutlerville | 15,142 | 287.1 | 57.2 | 36.4 | 66.4 |
| 100 | East Grand Rapids | 11,128 | 287.1 | 57.2 | 36.4 | 66.4 |
Source: NOAA climate data. 104 Michigan cities with more than 10,000 residents.
Summary
Summary: The Cities With The Best Weather In Michigan For 2026
If you’re looking for the Michigan cities with the most sunny days, the least rain and snow, and highs closest to a perfect 70 degrees, this is an accurate list.
The cities with the best weather in Michigan are Mount Clemens, Hazel Park, Madison Heights, Royal Oak, Clawson, Hamtramck, Fraser, Eastpointe, Troy, and Roseville. Not sold on Michigan? Take the two-minute Find Your Place quiz and see which state actually fits you.


