

Most African American cities in Virginia research summary. We used Saturday Night Science to analyze Virginia’s most recent Census data to determine the cities with the largest Black population, based on the percentage of Black residents.
The city with the largest African American population in Virginia is Petersburg (74.2% Black); the least is Richlands (0.1%). Statewide, Virginia is 18.3% Black — the 9th blackest state in the country.
Roughly 42 million people identifying as Black or African American live in the United States, about 12% of the total population. In Virginia, the Black population is 1,589,523, at 18.3% of the state total.
We broke down the most recent Census data to determine the cities in Virginia with the largest African American population in 2026.
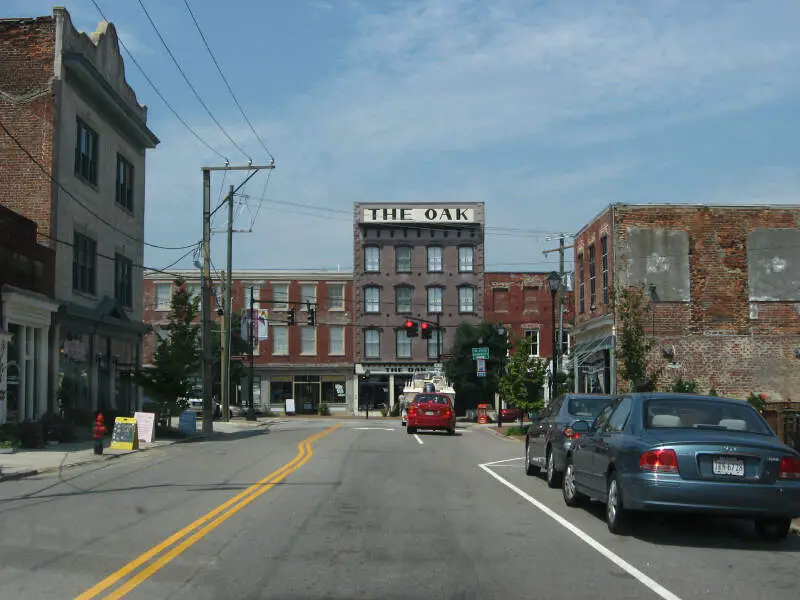
#1 most African American in Virginia
 Located in
Petersburg city, Virginia
Located in
Petersburg city, Virginia
Petersburg is an independent city in the U.S. state of Virginia. As of the 2010 census, the population was 32,420. The Bureau of Economic Analysis combines Petersburg with Dinwiddie County for statistical purposes. It is located on the Appomattox River and 21 miles south of the state capital of Richmond. The city’s unique industrial past and its location as a transportation hub combined to create wealth for Virginia and the region.
Data | Crime | Cost of living | Movers
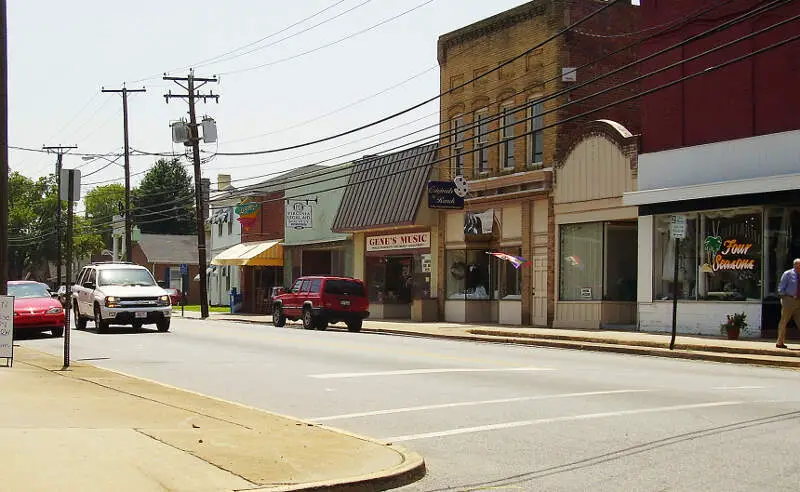
#2 most African American in Virginia
 Located in
Emporia city, Virginia
Located in
Emporia city, Virginia
Emporia is an independent city located within the confines of Greensville County, Virginia, United States. It and a predecessor town have been the county seat of Greensville County since 1791. As of the 2010 census, the population was 5,927, making it the second-least populous city in Virginia. The Bureau of Economic Analysis combines the city of Emporia with surrounding Greensville county for statistical purposes.
Data | Crime | Cost of living | Movers
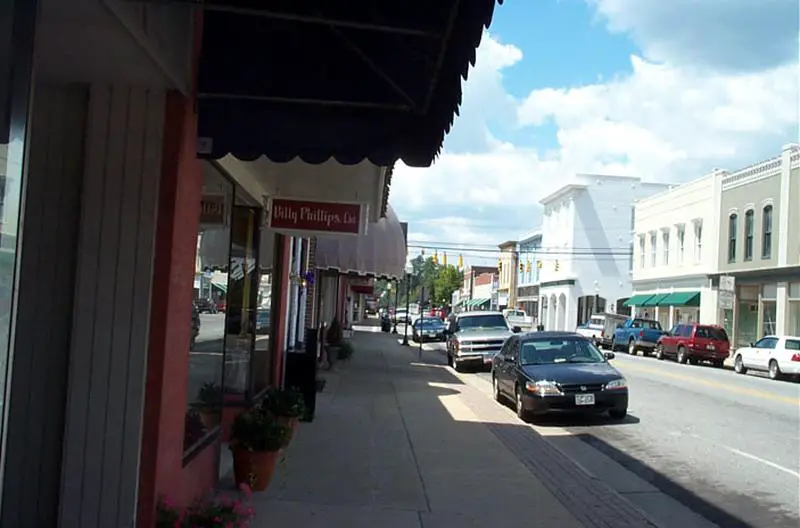
#3 most African American in Virginia
 Located in
Franklin city, Virginia
Located in
Franklin city, Virginia
Franklin is an independent city in the Commonwealth of Virginia. As of the 2010 census, the population was 8,582. The Bureau of Economic Analysis combines the city of Franklin with Southampton County for statistical purposes.
Data | Crime | Cost of living | Movers
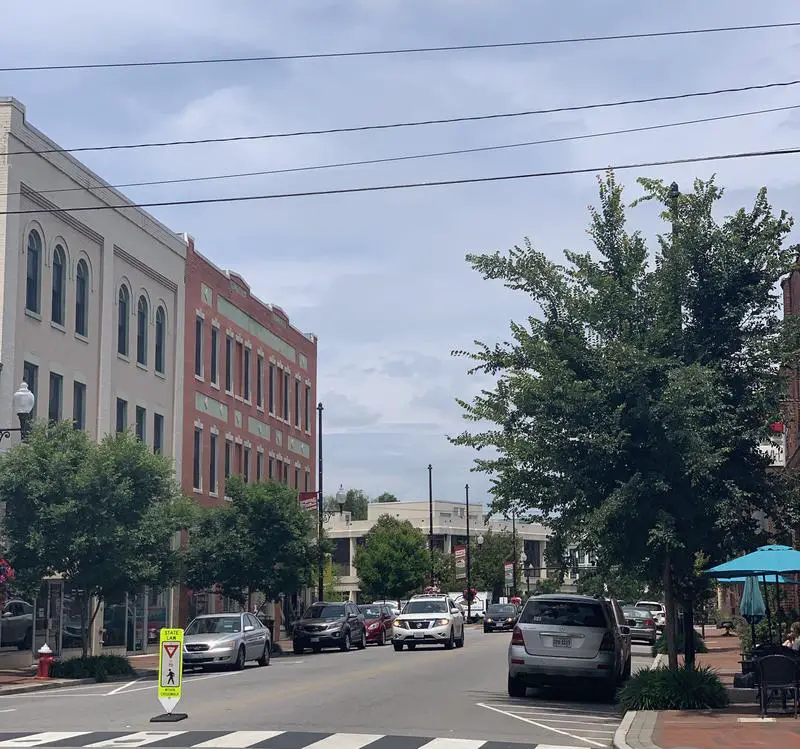
#4 most African American in Virginia
 Located in
Danville city, Virginia
Located in
Danville city, Virginia
Danville is an independent city in the Commonwealth of Virginia. As of the 2010 census, the population was 43,055. It is bounded by Pittsylvania County, Virginia and Caswell County, North Carolina. It hosts the Danville Braves baseball club of the Appalachian League.
Data | Crime | Cost of living | Movers
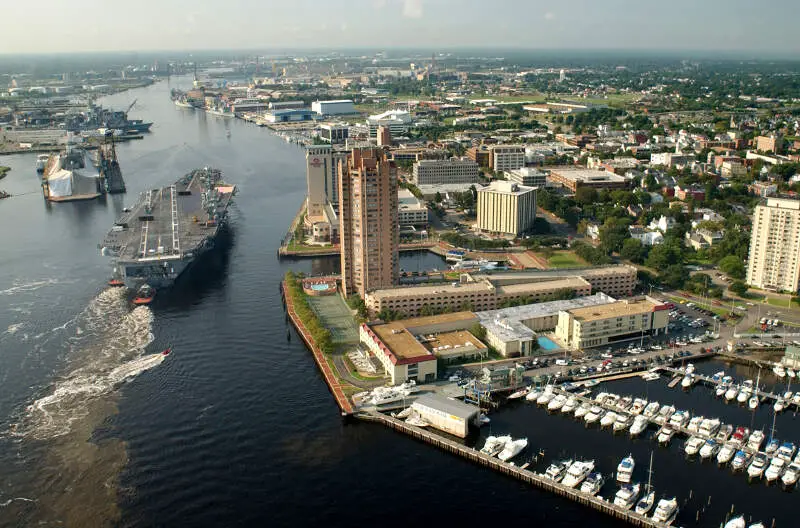
#5 most African American in Virginia
 Located in
Portsmouth city, Virginia
Located in
Portsmouth city, Virginia
Portsmouth is an independent city in the Commonwealth of Virginia. As of the 2010 census, the population was 95,535. It is part of the Hampton Roads metropolitan area.
Data | Crime | Cost of living | Movers
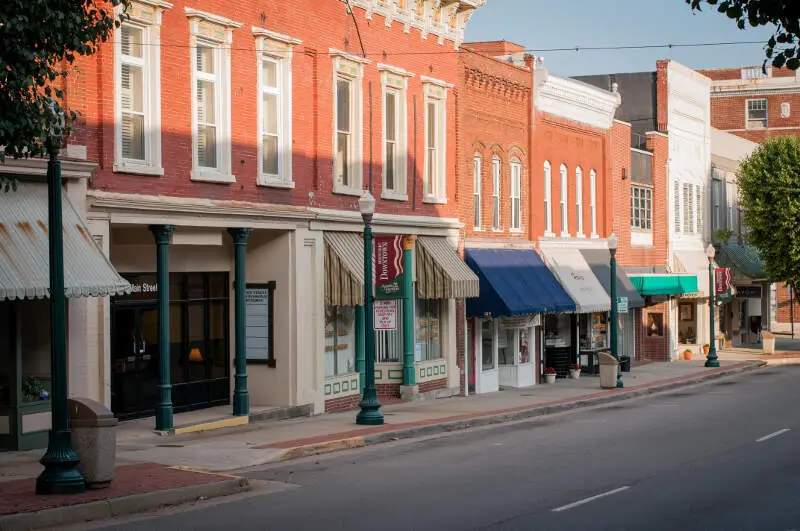
#6 most African American in Virginia
 Located in
Halifax County, Virginia
Located in
Halifax County, Virginia
South Boston, formerly Boyd’s Ferry, is a town in Halifax County, Virginia, United States. The population was 8,142 at the 2010 census.
Data | Crime | Cost of living | Movers
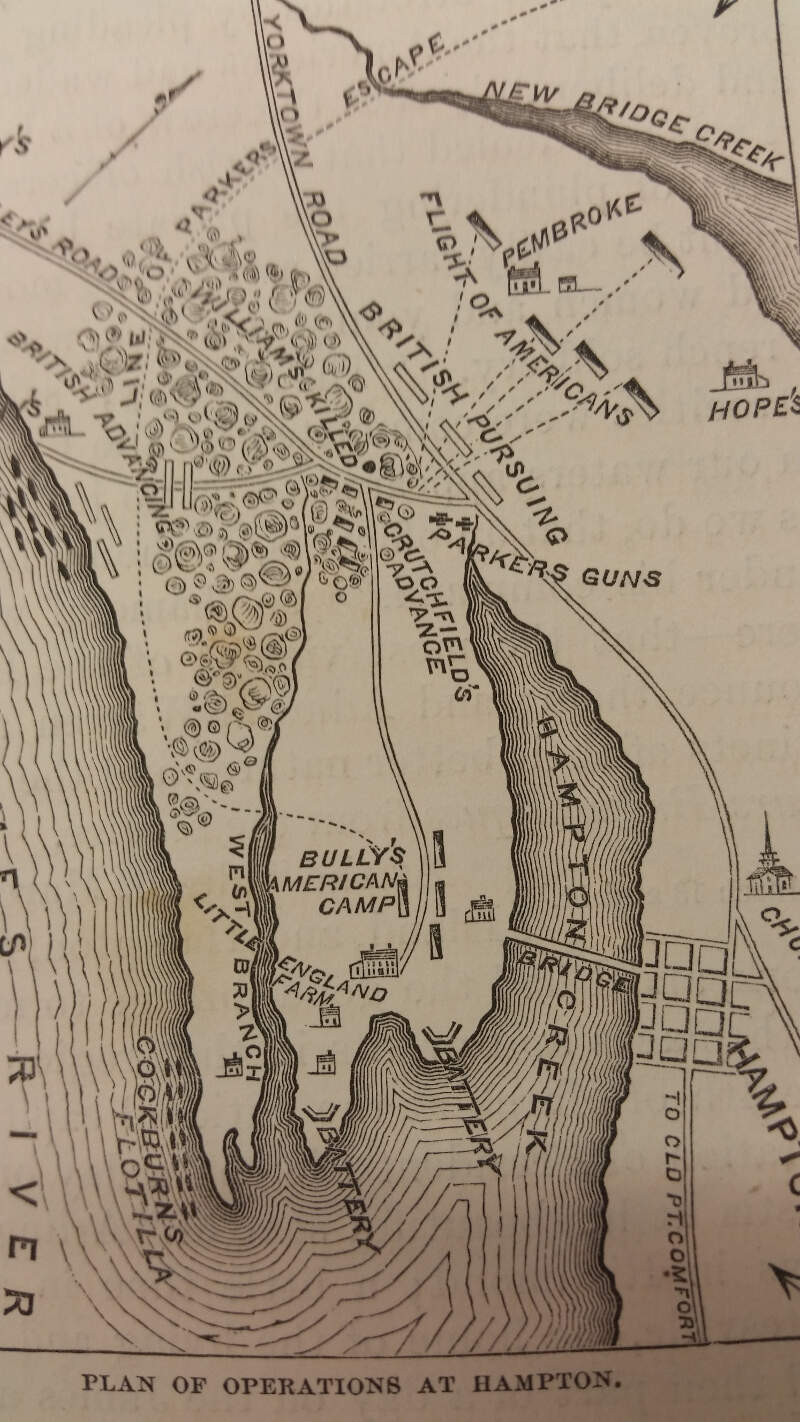
#7 most African American in Virginia
 Located in
Hampton city, Virginia
Located in
Hampton city, Virginia
Hampton is an independent city in the Commonwealth of Virginia, United States of America. As of the 2010 census, the population was 137,436.
Data | Crime | Cost of living | Movers
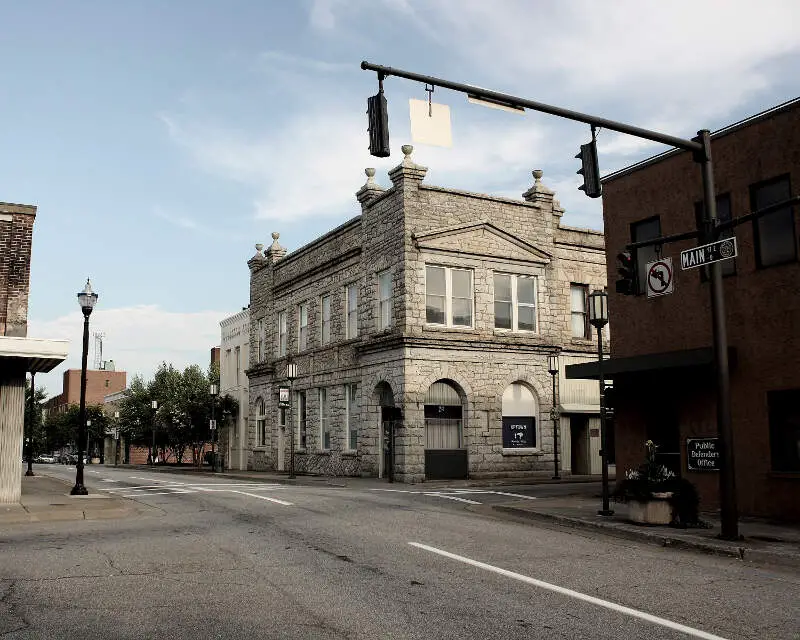
#8 most African American in Virginia
 Located in
Martinsville city, Virginia
Located in
Martinsville city, Virginia
Martinsville is an independent city near the southern border of the Commonwealth of Virginia. As of the 2010 census, the population was 13,821. It is the county seat of Henry County, although the two are separate jurisdictions. The Bureau of Economic Analysis combines the city of Martinsville with Henry County for statistical purposes.
Data | Crime | Cost of living | Movers
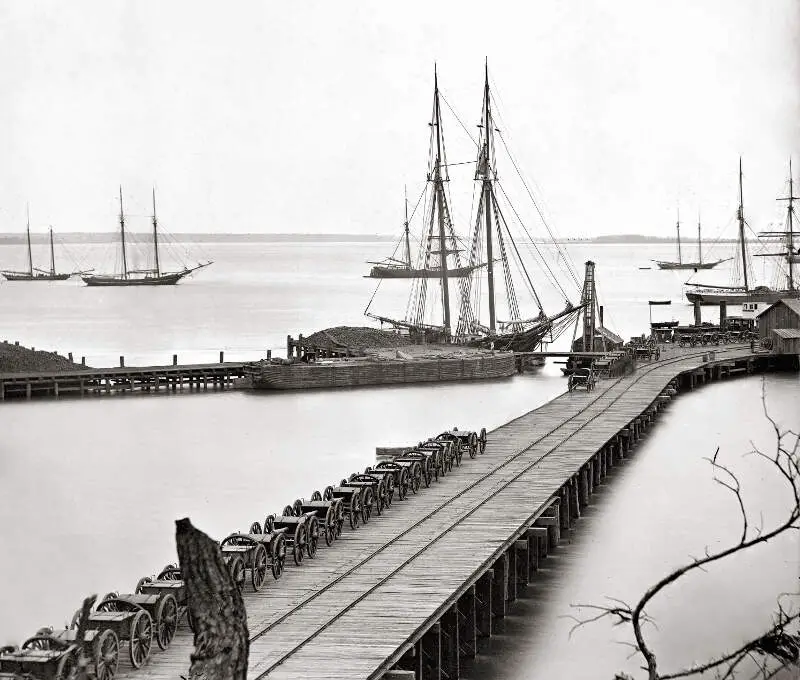
#9 most African American in Virginia
 Located in
Hopewell city, Virginia
Located in
Hopewell city, Virginia
Hopewell is an independent city within Prince George County in the Commonwealth of Virginia. As of the 2010 census, the population was 22,591. The Bureau of Economic Analysis combines the city of Hopewell with Prince George County for statistical purposes.
Data | Crime | Cost of living | Movers
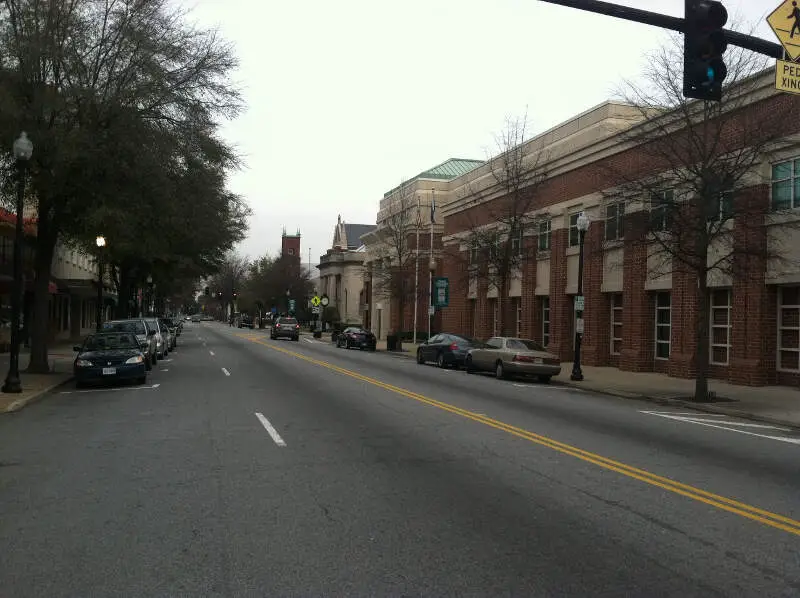
#10 most African American in Virginia
 Located in
Suffolk city, Virginia
Located in
Suffolk city, Virginia
Suffolk is an independent city in the Commonwealth of Virginia. As of the 2014 census, the estimated population was 86,806 It is the largest city in Virginia by area as well as the 14th largest in the country.
Data | Crime | Cost of living | Movers | Compare
The receipts
Compare the top ten
Pick a metric. The bars rescale. The red line is Virginia’s statewide median.
On the map
Where Virginia’s Black communities live
Saturday Night Science
Methodology: How We Determined The Cities In Virginia With The Largest Black Population For 2026
We still believe in the accuracy of data — especially from the Census. So that’s where we went to get the race breakdown across Virginia.
That leads us to the Census’s most recently available data, the 2020-2024 American Community Survey data from the US Census.
Specifically, we looked at table B03002: Hispanic OR LATINO ORIGIN BY RACE. Here are the category names as defined by the Census:
- Hispanic or Latino
- White alone*
- Black or African American alone*
- American Indian and Alaska Native alone*
- Asian alone*
- Native Hawaiian and Other Pacific Islander alone*
- Some other race alone*
- Two or more races*
Our particular column of interest was the number of people who identified as Black or African American.
We limited our analysis to non-CDPs with a population greater than 5,000 people in Virginia. That left us with 59 cities.
We then calculated the percentage of residents that are Black or African American. The percentages ranked from 74.2% to 0.1%.
Finally, we ranked each city based on the percentage of the Black population, with a higher score being more Black than a lower score. Petersburg took the distinction of being the most Black, while Richlands was the least African American city.
We updated this article for 2026. This is our eleventh time ranking the cities in Virginia with the largest African American population.
The full plate
African American Population By City In Virginia
Click any column to sort. Search by city name.
| Rank | City | Population | African American Population | % African American |
|---|---|---|---|---|
| 1 | Petersburg | 33,537 | 24,890 | 74.2% |
| 2 | Emporia | 5,547 | 3,569 | 64.3% |
| 3 | Franklin | 8,250 | 4,524 | 54.8% |
| 4 | Danville | 42,214 | 21,304 | 50.5% |
| 5 | Portsmouth | 97,190 | 48,784 | 50.2% |
| 6 | South Boston | 7,853 | 3,923 | 50.0% |
| 7 | Hampton | 137,557 | 66,188 | 48.1% |
| 8 | Martinsville | 13,658 | 5,999 | 43.9% |
| 9 | Hopewell | 22,959 | 9,545 | 41.6% |
| 10 | Suffolk | 98,796 | 41,068 | 41.6% |
| 11 | Newport News | 184,216 | 74,745 | 40.6% |
| 12 | Richmond | 229,359 | 93,026 | 40.6% |
| 13 | Norfolk | 233,596 | 90,856 | 38.9% |
| 14 | Chesapeake | 252,583 | 71,944 | 28.5% |
| 15 | Roanoke | 98,355 | 27,236 | 27.7% |
| 16 | Lynchburg | 79,497 | 21,483 | 27.0% |
| 17 | Farmville | 7,774 | 1,993 | 25.6% |
| 18 | Alexandria | 156,976 | 32,969 | 21.0% |
| 19 | Fredericksburg | 28,873 | 5,603 | 19.4% |
| 20 | Ashland | 7,772 | 1,494 | 19.2% |
| 21 | Colonial Heights | 18,352 | 3,432 | 18.7% |
| 22 | Virginia Beach | 456,349 | 82,972 | 18.2% |
| 23 | Smithfield | 8,834 | 1,557 | 17.6% |
| 24 | Culpeper | 20,794 | 3,489 | 16.8% |
| 25 | Big Stone Gap | 5,162 | 835 | 16.2% |
| 26 | Charlottesville | 45,437 | 7,026 | 15.5% |
| 27 | Williamsburg | 15,798 | 2,258 | 14.3% |
| 28 | Manassas Park | 16,798 | 2,282 | 13.6% |
| 29 | Covington | 5,680 | 720 | 12.7% |
| 30 | Manassas | 42,976 | 5,058 | 11.8% |
| 31 | Waynesboro | 22,841 | 2,491 | 10.9% |
| 32 | Staunton | 25,948 | 2,662 | 10.3% |
| 33 | Warrenton | 10,176 | 1,007 | 9.9% |
| 34 | Radford | 16,726 | 1,544 | 9.2% |
| 35 | Front Royal | 15,296 | 1,380 | 9.0% |
| 36 | Salem | 25,618 | 2,217 | 8.7% |
| 37 | Leesburg | 49,171 | 4,247 | 8.6% |
| 38 | Herndon | 24,672 | 2,007 | 8.1% |
| 39 | Winchester | 27,913 | 2,156 | 7.7% |
| 40 | Harrisonburg | 51,392 | 3,685 | 7.2% |
| 41 | Purcellville | 8,973 | 641 | 7.1% |
| 42 | Marion | 5,670 | 385 | 6.8% |
| 43 | Fairfax | 25,026 | 1,585 | 6.3% |
| 44 | Christiansburg | 22,720 | 1,347 | 5.9% |
| 45 | Lexington | 7,525 | 437 | 5.8% |
| 46 | Bristol | 16,849 | 969 | 5.8% |
| 47 | Strasburg | 7,214 | 408 | 5.7% |
| 48 | Galax | 6,726 | 331 | 4.9% |
| 49 | Vienna | 16,412 | 733 | 4.5% |
| 50 | Pulaski | 8,893 | 380 | 4.3% |
| 51 | Bridgewater | 6,708 | 281 | 4.2% |
| 52 | Abingdon | 8,330 | 337 | 4.0% |
| 53 | Blacksburg | 45,446 | 1,779 | 3.9% |
| 54 | Falls Church | 14,710 | 520 | 3.5% |
| 55 | Wytheville | 8,202 | 271 | 3.3% |
| 56 | Buena Vista | 6,593 | 134 | 2.0% |
| 57 | Poquoson | 12,639 | 238 | 1.9% |
| 58 | Vinton | 8,056 | 132 | 1.6% |
| 59 | Richlands | 5,171 | 3 | 0.1% |
Source: U.S. Census ACS 2020-2024. 59 cities with more than 5,000 residents.
Summary
Summary: Black Populations Across Virginia
If you’re looking for a breakdown of African American populations across Virginia according to the most recent data, this is an accurate list.
The blackest cities in Virginia are Petersburg, Emporia, Franklin, Danville, Portsmouth, South Boston, Hampton, Martinsville, Hopewell, and Suffolk. Not sold on Virginia? Take the two-minute Find Your Place quiz and see which state actually fits you.
Questions and answers
Cities In Virginia With The Largest Black Population FAQs
What city in Virginia has the largest Black population share?
Petersburg has the largest Black population share in Virginia for 2026, at 74.2% of residents. Emporia and Franklin are next.
What are the most African American cities in Virginia?
The Virginia cities with the largest Black population shares are Petersburg, Emporia, Franklin, Danville, Portsmouth, South Boston, Hampton, Martinsville, Hopewell, and Suffolk. We ranked all 59 places with more than 5,000 residents by their Black share of the population.
What percent of Virginia is Black?
Virginia is 18.3% Black, which works out to 1,589,523 residents. That makes it the 9th blackest state in the country.
What is the least African American city in Virginia?
Richlands has the smallest Black population share in Virginia, at 0.1%. It sits at the opposite end of the same ranking.
Where does this data come from?
Every share is calculated from the Census Bureau’s American Community Survey (2020-2024), based on residents identifying as Black or African American. We rank each Virginia place with more than 5,000 residents.



