Most Asian cities in New Jersey research summary. We analyzed New Jersey’s most recent Census data to determine the most Asian cities in New Jersey based on the percentage of Asian residents.
62.2% Asian · #1 most Asian in New Jersey
Data | Crime | Cost of living | Movers
61.4% Asian · #2 most Asian in New Jersey
Data | Crime | Cost of living | Movers
54.5% Asian · #3 most Asian in New Jersey
Data | Crime | Cost of living | Movers
50.9% Asian · #4 most Asian in New Jersey
Data | Crime | Cost of living | Movers
48.3% Asian · #5 most Asian in New Jersey
Data | Crime | Cost of living | Movers
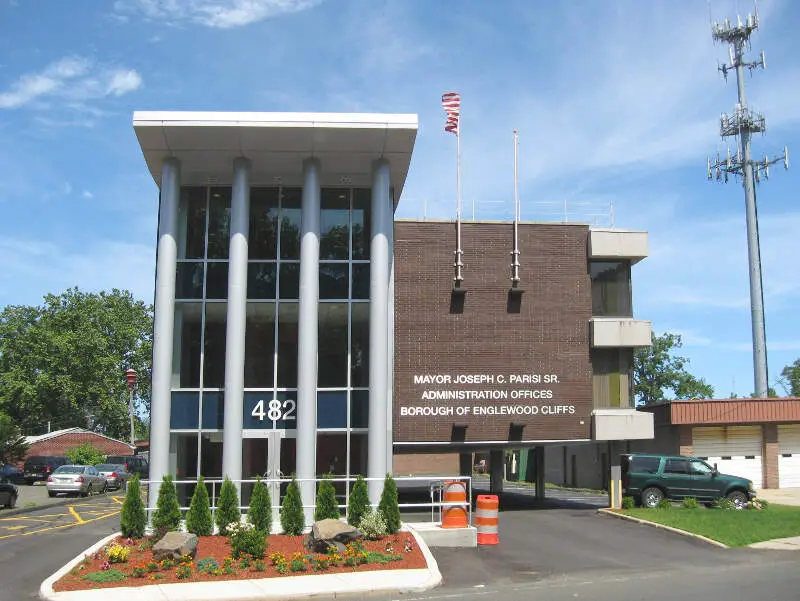
47.3% Asian · #6 most Asian in New Jersey
Data | Crime | Cost of living | Movers
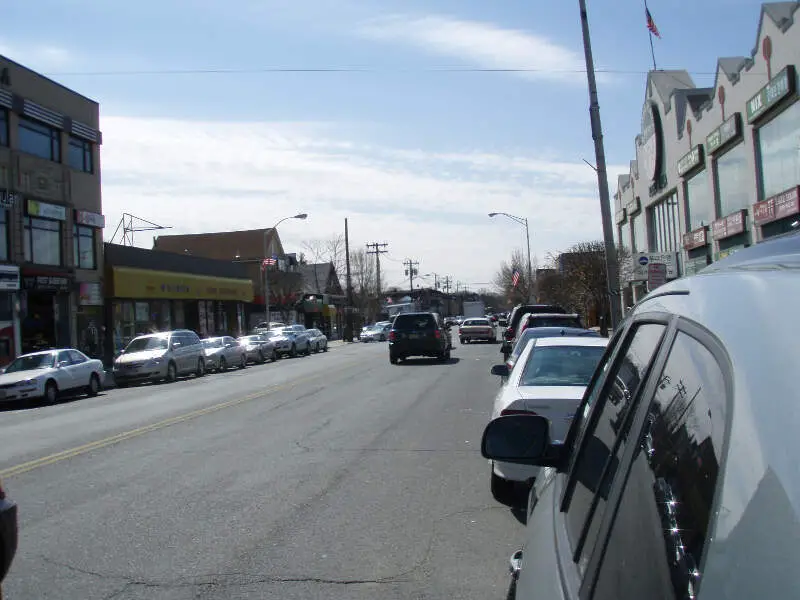
43.6% Asian · #7 most Asian in New Jersey
Fort Lee is a borough at the eastern border of Bergen County, New Jersey, United States, in the New York City Metropolitan Area, situated atop the Hudson Palisades. As of the 2010 United States Census, the borough’s population was 35,345, reflecting a decline of 116 from the 35,461 counted in the 2000 Census, which had in turn increased by 3,464 from the 31,997 counted in the 1990 Census. The borough is the western terminus of the George Washington Bridge and is located across the Hudson River from the Manhattan borough of New York City. Named for the site of an early American Revolutionary War military encampment, it later became the birthplace of the American film industry.
Data | Crime | Cost of living | Movers
41.1% Asian · #8 most Asian in New Jersey
Data | Crime | Cost of living | Movers
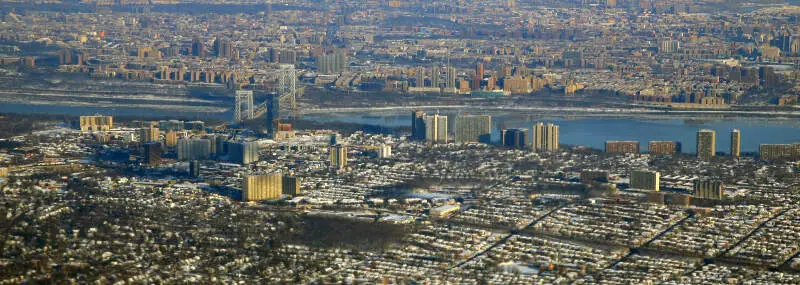
40.3% Asian · #9 most Asian in New Jersey
Short Hills is an unincorporated community and census-designated place located within Millburn Township, in Essex County, New Jersey, United States. It is a popular commuter town for residents who work in New York City.
Data | Crime | Cost of living | Movers
40.3% Asian · #10 most Asian in New Jersey
Franklin Park is an unincorporated community and census-designated place located within Franklin Township, in Somerset County, New Jersey, United States. As of the 2010 United States Census, the CDP’s population was 13,295. Route 27 bisects the village and serves as the dividing line between the two counties. The adjacent sections of South Brunswick and North Brunswick, Middlesex County on the east side of Route 27 are also known as Franklin Park, but are not included within the CDP’s boundaries.
Data | Crime | Cost of living | Movers
The receipts
Compare the top ten
Pick a metric. The bars rescale. The red line is New Jersey’s statewide median.
On the map
Where New Jersey’s Asian communities live
Saturday Night Science
Methodology: How We Determined The Cities In New Jersey With The Largest Asian Population For 2026
We used Saturday Night Science to compare Census data on race across every place in New Jersey.
The Census’s most recently available data comes from the 2020-2024 American Community Survey.
Specifically, we looked at table B03002: Hispanic OR LATINO ORIGIN BY RACE. Here are the category names as defined by the Census:
- Hispanic or Latino
- White alone*
- Black or African American alone*
- American Indian and Alaska Native alone*
- Asian alone*
- Native Hawaiian and Other Pacific Islander alone*
- Some other race alone*
- Two or more races*
Our particular column of interest here was the number of people who identified as Asian alone.
We limited our analysis to cities with a population greater than 5,000 people. That left us with 251 cities.
We then calculated the percentage of residents that are Asian. The percentages ranked from 62.2% to 0.0%.
Finally, we ranked each city based on the percentage of Asian population, with a higher percentage being more Asian. Heathcote took the distinction of being the most Asian, while Clementon was the least Asian city.
We updated this article for 2026. This report reflects our eleventh time ranking the cities in New Jersey with the largest Asian population.
The full plate
Cities In New Jersey By Asian Population
Click any column to sort. Search by city name.
| Rank | City | Population | Asian Population | % Asian |
|---|---|---|---|---|
| 1 | Heathcote | 7,717 | 4,799 | 62.2% |
| 2 | Princeton Meadows | 15,561 | 9,551 | 61.4% |
| 3 | Palisades Park | 20,290 | 11,062 | 54.5% |
| 4 | Dayton | 7,952 | 4,045 | 50.9% |
| 5 | Iselin | 19,551 | 9,444 | 48.3% |
| 6 | Englewood Cliffs | 5,362 | 2,536 | 47.3% |
| 7 | Fort Lee | 40,067 | 17,464 | 43.6% |
| 8 | Old Tappan | 6,008 | 2,469 | 41.1% |
| 9 | Short Hills | 14,923 | 6,016 | 40.3% |
| 10 | Franklin Park | 13,211 | 5,321 | 40.3% |
| 11 | Edgewater | 14,759 | 5,718 | 38.7% |
| 12 | Bradley Gardens | 14,165 | 5,421 | 38.3% |
| 13 | Leonia | 9,336 | 3,490 | 37.4% |
| 14 | Secaucus | 21,778 | 7,867 | 36.1% |
| 15 | Tenafly | 15,319 | 5,520 | 36.0% |
| 16 | Kendall Park | 10,011 | 3,534 | 35.3% |
| 17 | Closter | 8,606 | 2,672 | 31.0% |
| 18 | Norwood | 5,724 | 1,736 | 30.3% |
| 19 | River Edge | 12,091 | 3,599 | 29.8% |
| 20 | Cresskill | 9,174 | 2,671 | 29.1% |
| 21 | Jersey City | 294,078 | 77,831 | 26.5% |
| 22 | Pomona | 7,995 | 2,090 | 26.1% |
| 23 | Carteret | 25,496 | 6,556 | 25.7% |
| 24 | Paramus | 26,568 | 6,821 | 25.7% |
| 25 | Echelon | 13,284 | 3,384 | 25.5% |
| 26 | Woodbridge | 20,756 | 5,228 | 25.2% |
| 27 | Bergenfield | 28,450 | 7,017 | 24.7% |
| 28 | Somerset | 22,720 | 5,249 | 23.1% |
| 29 | Ridgefield | 11,498 | 2,532 | 22.0% |
| 30 | Harrison | 20,369 | 4,473 | 22.0% |
| 31 | Wood-Ridge | 10,218 | 2,239 | 21.9% |
| 32 | Raritan | 8,368 | 1,818 | 21.7% |
| 33 | Green Knoll | 6,789 | 1,471 | 21.7% |
| 34 | South Plainfield | 24,473 | 5,217 | 21.3% |
| 35 | Highland Park | 15,121 | 3,188 | 21.1% |
| 36 | Little Ferry | 10,996 | 2,254 | 20.5% |
| 37 | New Milford | 16,995 | 3,447 | 20.3% |
| 38 | Kingston Estates | 6,668 | 1,319 | 19.8% |
| 39 | Greentree | 11,537 | 2,241 | 19.4% |
| 40 | Madison Park | 9,124 | 1,764 | 19.3% |
| 41 | Finderne | 6,489 | 1,204 | 18.6% |
| 42 | Dumont | 18,279 | 3,340 | 18.3% |
| 43 | Allendale | 6,865 | 1,244 | 18.1% |
| 44 | Metuchen | 15,144 | 2,706 | 17.9% |
| 45 | East Rutherford | 10,313 | 1,809 | 17.5% |
| 46 | Maywood | 10,093 | 1,727 | 17.1% |
| 47 | Fords | 12,771 | 2,149 | 16.8% |
| 48 | Martinsville | 11,559 | 1,940 | 16.8% |
| 49 | Avenel | 17,121 | 2,772 | 16.2% |
| 50 | Sayreville | 45,838 | 7,376 | 16.1% |
| 51 | Ridgewood | 26,308 | 4,162 | 15.8% |
| 52 | Colonia | 18,587 | 2,891 | 15.6% |
| 53 | Emerson | 7,305 | 1,136 | 15.6% |
| 54 | Atlantic City | 38,632 | 5,964 | 15.4% |
| 55 | Glen Rock | 12,154 | 1,819 | 15.0% |
| 56 | Englewood | 29,638 | 4,402 | 14.9% |
| 57 | New Providence | 13,727 | 2,033 | 14.8% |
| 58 | Carlstadt | 6,378 | 939 | 14.7% |
| 59 | Eato | 13,575 | 1,970 | 14.5% |
| 60 | Cliffside Park | 25,781 | 3,706 | 14.4% |
| 61 | Upper Saddle River | 8,439 | 1,210 | 14.3% |
| 62 | Fair Lawn | 35,610 | 5,083 | 14.3% |
| 63 | Springdale | 15,173 | 2,145 | 14.1% |
| 64 | Roseland | 6,268 | 882 | 14.1% |
| 65 | Roselle Park | 14,093 | 1,971 | 14.0% |
| 66 | Robertsville | 12,035 | 1,673 | 13.9% |
| 67 | Caldwell | 9,003 | 1,251 | 13.9% |
| 68 | Middlesex | 14,645 | 2,028 | 13.8% |
| 69 | Hackensack | 46,057 | 6,375 | 13.8% |
| 70 | Montvale | 8,901 | 1,228 | 13.8% |
| 71 | Old Bridge | 28,236 | 3,687 | 13.1% |
| 72 | Oradell | 8,235 | 1,061 | 12.9% |
| 73 | Franklin Lakes | 11,084 | 1,410 | 12.7% |
| 74 | Hoboken | 58,668 | 7,368 | 12.6% |
| 75 | Rutherford | 18,894 | 2,321 | 12.3% |
| 76 | Watchung | 6,485 | 781 | 12.0% |
| 77 | Brookdale | 9,960 | 1,185 | 11.9% |
| 78 | Chatham | 9,407 | 1,095 | 11.6% |
| 79 | Mountainside | 7,049 | 804 | 11.4% |
| 80 | Florham Park | 13,564 | 1,497 | 11.0% |
| 81 | Cherry Hill Mall | 14,541 | 1,576 | 10.8% |
| 82 | Somerville | 13,410 | 1,449 | 10.8% |
| 83 | Bogota | 9,360 | 929 | 9.9% |
| 84 | Hasbrouck Heights | 12,115 | 1,165 | 9.6% |
| 85 | North Caldwell | 6,656 | 626 | 9.4% |
| 86 | Woodcliff Lake | 6,152 | 573 | 9.3% |
| 87 | Elmwood Park | 21,412 | 1,994 | 9.3% |
| 88 | Bayonne | 71,553 | 6,509 | 9.1% |
| 89 | Northfield | 8,456 | 758 | 9.0% |
| 90 | Westfield | 31,111 | 2,740 | 8.8% |
| 91 | North Arlington | 16,461 | 1,440 | 8.7% |
| 92 | Jamesburg | 5,770 | 502 | 8.7% |
| 93 | Ramsey | 14,805 | 1,288 | 8.7% |
| 94 | Clifton | 89,379 | 7,412 | 8.3% |
| 95 | New Brunswick | 56,345 | 4,453 | 7.9% |
| 96 | West New York | 52,004 | 4,087 | 7.9% |
| 97 | Hillsdale | 10,144 | 795 | 7.8% |
| 98 | Westwood | 11,283 | 842 | 7.5% |
| 99 | Budd Lake | 10,650 | 792 | 7.4% |
| 100 | Guttenberg | 11,754 | 871 | 7.4% |
Source: U.S. Census ACS 2020-2024. 251 cities with more than 5,000 residents.
Summary
Summary: Asian Populations Across New Jersey
If you’re looking for a breakdown of Asian populations across New Jersey according to the most recent data, this is an accurate list.
The most Asian cities in New Jersey are Heathcote, Princeton Meadows, Palisades Park, Dayton, Iselin, Englewood Cliffs, Fort Lee, Old Tappan, Short Hills, and Franklin Park.