Most Asian cities in Pennsylvania research summary. We analyzed Pennsylvania’s most recent Census data to determine the most Asian cities in Pennsylvania based on the percentage of Asian residents.
15.3% Asian · #1 most Asian in Pennsylvania
Data | Crime | Cost of living | Movers
15.3% Asian · #2 most Asian in Pennsylvania
Lansdale is a borough in Montgomery County, Pennsylvania, 28 miles northwest of Philadelphia. Early in the 20th century, its industries included agricultural implement works, a canning factory, foundries, brickyards, a silk mill, and manufacturers of cigars, stoves, shirts, rope, iron drain pipe, and glue. In 1900, 2,754 people lived here; in 1910, 3,551; and in 1940, 9,316 people were inhabitants of Lansdale. The population was 16,269 at the time of the 2010 census.
Data | Crime | Cost of living | Movers
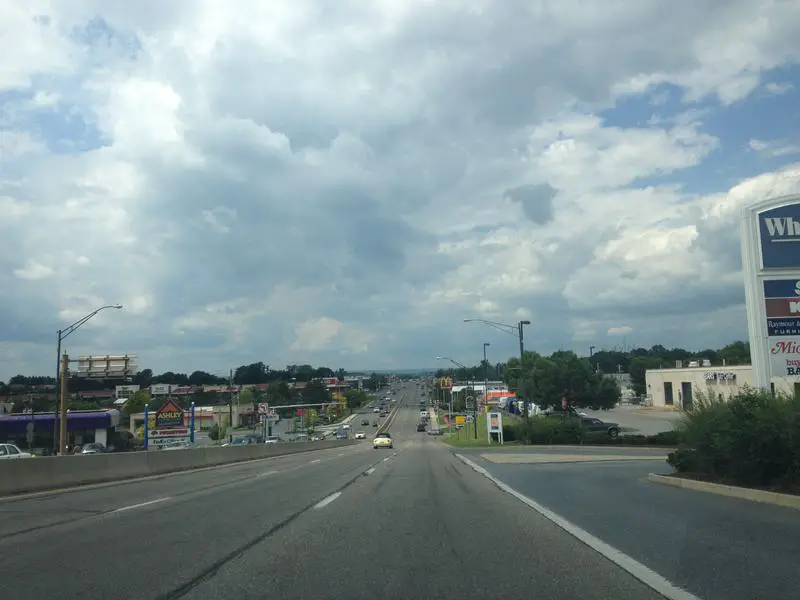
14.4% Asian · #3 most Asian in Pennsylvania
Data | Crime | Cost of living | Movers
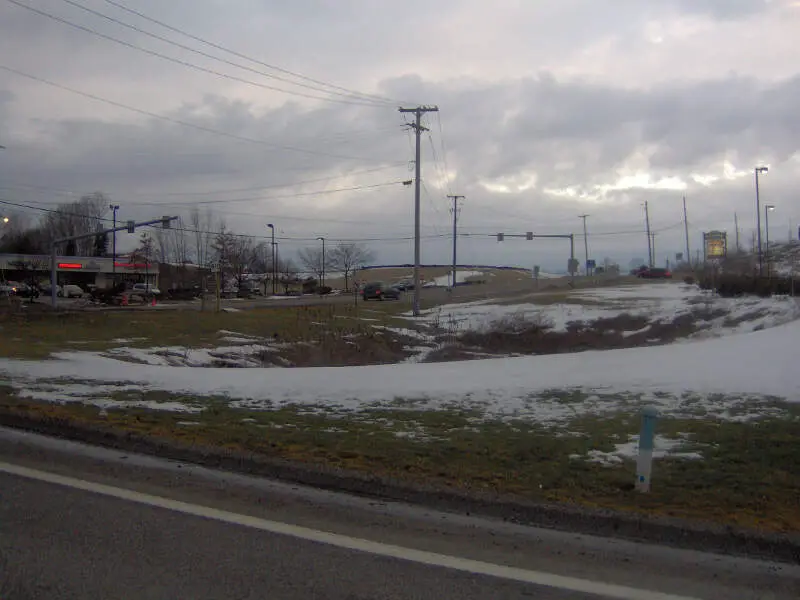
13.6% Asian · #4 most Asian in Pennsylvania
Franklin Park is a borough in Allegheny County, Pennsylvania, United States. The population was 13,470 at the 2010 census.
Data | Crime | Cost of living | Movers
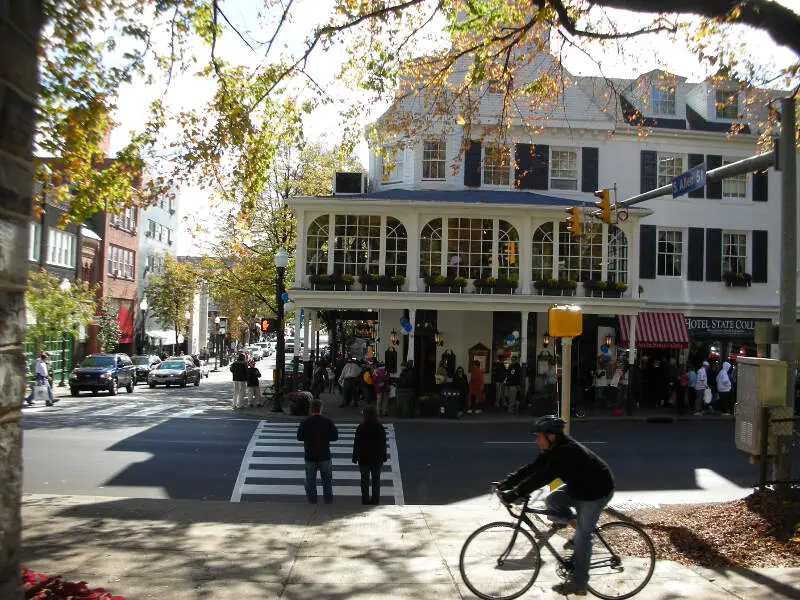
9.4% Asian · #5 most Asian in Pennsylvania
State College is a home rule municipality in Centre County in the Commonwealth of Pennsylvania. It is the largest designated borough in Pennsylvania. It is the principal borough of the six municipalities that make up the State College Metropolitan Statistical Area, the largest settlement in Centre County and one of the principal cities of the greater State College-DuBois Combined Statistical Area with a combined population of 236,577 as of the 2010 United States Census. In the 2010 census, the borough population was 42,034 with approximately 105,000 living in the borough plus the surrounding townships often referred to locally as the “Centre Region.” Many of these Centre Region communities also carry a “State College, PA” address although are not part of the borough of State College.
Data | Crime | Cost of living | Movers
8.4% Asian · #6 most Asian in Pennsylvania
Baldwin is a borough in Allegheny County, Pennsylvania, United States,, and is part of the Pittsburgh Metro Area. The population was 19,767 at the 2010 census.
Data | Crime | Cost of living | Movers
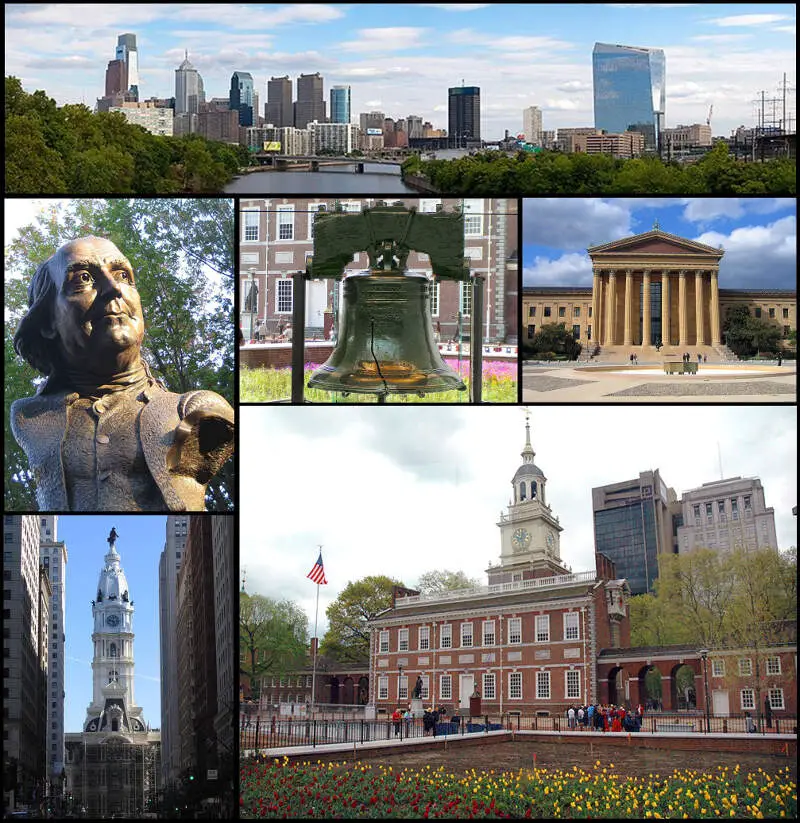
7.9% Asian · #7 most Asian in Pennsylvania
Philadelphia is the largest city in the Commonwealth of Pennsylvania and the sixth-most populous city in the United States, with an estimated population of 1,567,872 and more than 6million in the seventh-largest metropolitan statistical area, as of 2016. Philadelphia is the economic and cultural anchor of the Delaware Valley region, located along the lower Delaware and Schuylkill Rivers. The region’s population of 7.2million ranks it as the eighth-largest combined statistical area in the United States.
Data | Crime | Cost of living | Movers
6.8% Asian · #8 most Asian in Pennsylvania
Collegeville, sometimes referred to as “Little Philly” is a borough in Montgomery County, Pennsylvania, a suburb of Philadelphia on the Perkiomen Creek. Collegeville was incorporated in 1896. It is the location of Ursinus College, opened in 1869. The population was 5,089 at the 2010 census.
Data | Crime | Cost of living | Movers
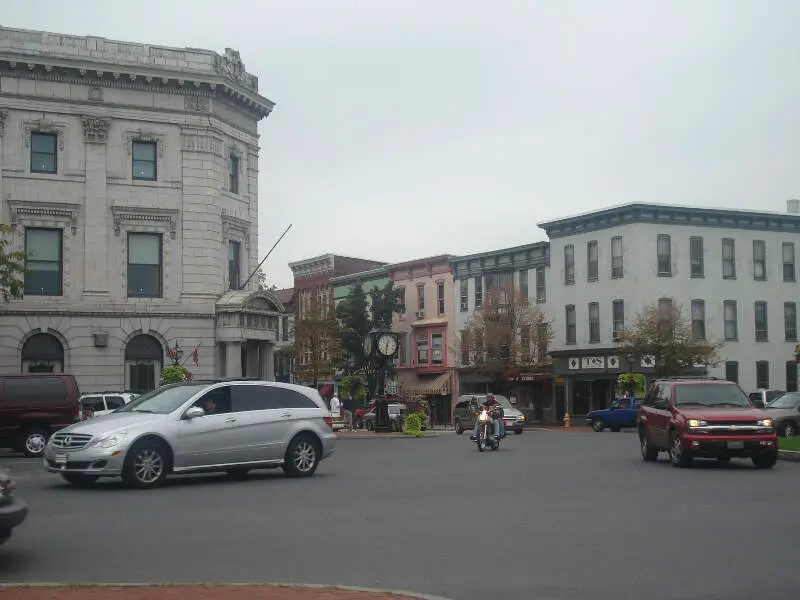
6.8% Asian · #9 most Asian in Pennsylvania
Gettysburg is a borough and the county seat of Adams County in the U.S. state of Pennsylvania. The Battle of Gettysburg and President Abraham Lincoln’s Gettysburg Address are named for this town. The town hosts visitors to the Gettysburg National Battlefield in the Gettysburg National Military Park. As of the 2010 census, the borough had a population of 7,620 people.
Data | Crime | Cost of living | Movers
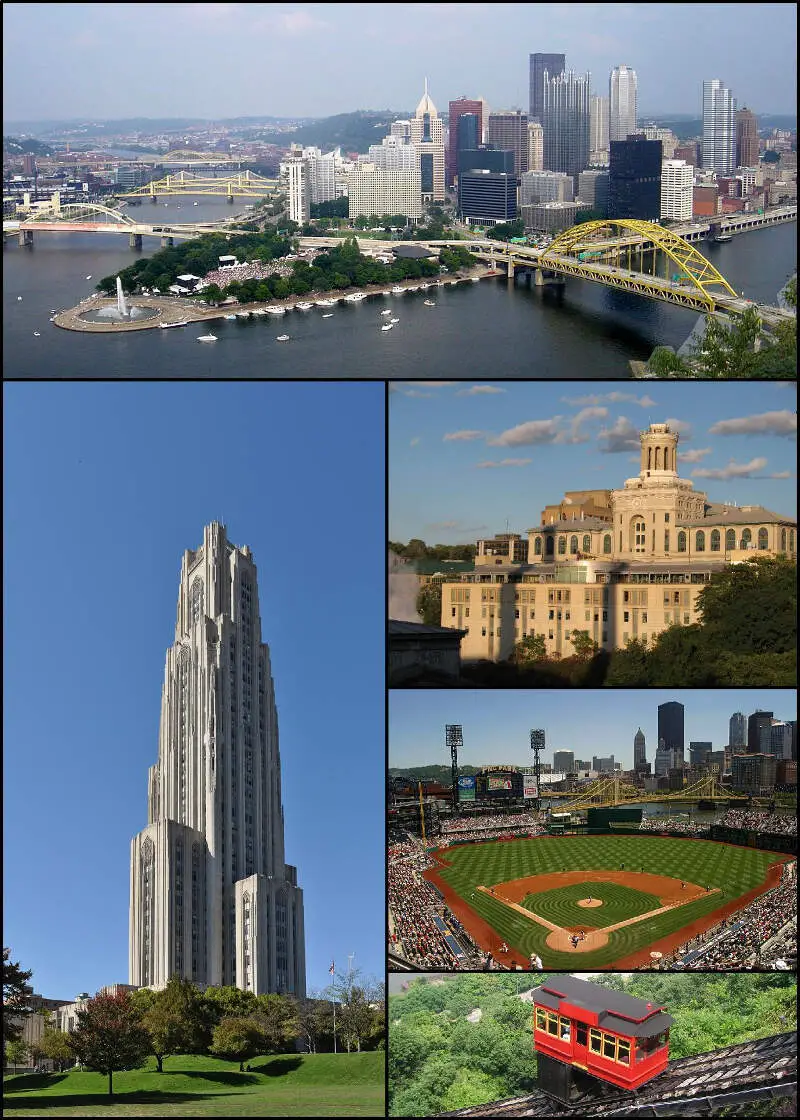
6.1% Asian · #10 most Asian in Pennsylvania
Pittsburgh is a city in the Commonwealth of Pennsylvania in the United States, and is the county seat of Allegheny County. As of 2017, a total population of 305,704 lives within the city limits, making it the 63rd-largest city in the U.S. The metropolitan population of 2,353,045 is the largest in both the Ohio Valley and Appalachia, the second-largest in Pennsylvania, and the 26th-largest in the U.S.
Data | Crime | Cost of living | Movers
The receipts
Compare the top ten
Pick a metric. The bars rescale. The red line is Pennsylvania’s statewide median.
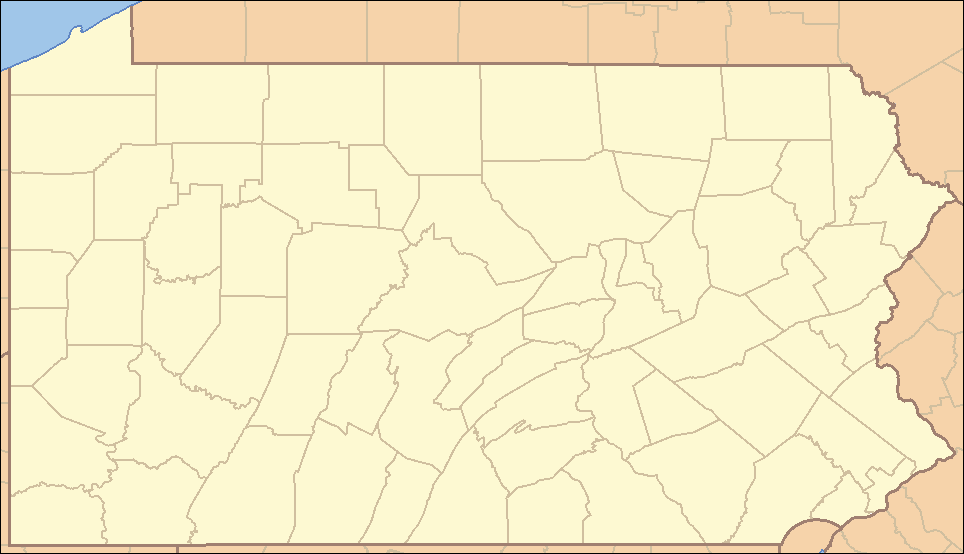
On the map
Where Pennsylvania’s Asian communities live
Saturday Night Science
Methodology: How We Determined The Cities In Pennsylvania With The Largest Asian Population For 2026
We used Saturday Night Science to compare Census data on race across every place in Pennsylvania.
The Census’s most recently available data comes from the 2020-2024 American Community Survey.
Specifically, we looked at table B03002: Hispanic OR LATINO ORIGIN BY RACE. Here are the category names as defined by the Census:
- Hispanic or Latino
- White alone*
- Black or African American alone*
- American Indian and Alaska Native alone*
- Asian alone*
- Native Hawaiian and Other Pacific Islander alone*
- Some other race alone*
- Two or more races*
Our particular column of interest here was the number of people who identified as Asian alone.
We limited our analysis to cities with a population greater than 5,000 people. That left us with 184 cities.
We then calculated the percentage of residents that are Asian. The percentages ranked from 15.3% to 0.0%.
Finally, we ranked each city based on the percentage of Asian population, with a higher percentage being more Asian. Downin took the distinction of being the most Asian, while Franklin was the least Asian city.
We updated this article for 2026. This report reflects our eleventh time ranking the cities in Pennsylvania with the largest Asian population.
The full plate
Cities In Pennsylvania By Asian Population
Click any column to sort. Search by city name.
| Rank | City | Population | Asian Population | % Asian |
|---|---|---|---|---|
| 1 | Downin | 8,255 | 1,263 | 15.3% |
| 2 | Lansdale | 19,011 | 2,906 | 15.3% |
| 3 | Whitehall | 14,811 | 2,130 | 14.4% |
| 4 | Franklin Park | 15,235 | 2,071 | 13.6% |
| 5 | State College | 41,050 | 3,841 | 9.4% |
| 6 | Baldwin | 21,057 | 1,773 | 8.4% |
| 7 | Philadelphia | 1,579,706 | 124,921 | 7.9% |
| 8 | Collegeville | 5,247 | 358 | 6.8% |
| 9 | Gettysburg | 8,254 | 561 | 6.8% |
| 10 | Pittsburgh | 304,759 | 18,635 | 6.1% |
| 11 | Swarthmore | 6,550 | 392 | 6.0% |
| 12 | Canonsburg | 9,675 | 533 | 5.5% |
| 13 | Scranton | 76,033 | 3,999 | 5.3% |
| 14 | Norwood | 5,934 | 306 | 5.2% |
| 15 | Fox Chapel | 5,246 | 262 | 5.0% |
| 16 | Media | 5,870 | 290 | 4.9% |
| 17 | Hatboro | 8,283 | 394 | 4.8% |
| 18 | Morrisville | 9,752 | 460 | 4.7% |
| 19 | Souderton | 7,181 | 331 | 4.6% |
| 20 | New Holland | 5,780 | 261 | 4.5% |
| 21 | Quake | 9,319 | 418 | 4.5% |
| 22 | Exeter | 5,541 | 241 | 4.3% |
| 23 | Collingdale | 8,897 | 385 | 4.3% |
| 24 | Camp Hill | 8,169 | 353 | 4.3% |
| 25 | Jefferson Hills | 12,317 | 511 | 4.1% |
| 26 | Red Lion | 6,516 | 270 | 4.1% |
| 27 | Millersville | 8,982 | 370 | 4.1% |
| 28 | Phoenixville | 19,452 | 799 | 4.1% |
| 29 | Wilson | 8,183 | 329 | 4.0% |
| 30 | Lewisburg | 5,257 | 199 | 3.8% |
| 31 | Middl | 9,632 | 341 | 3.5% |
| 32 | Swissvale | 8,418 | 290 | 3.4% |
| 33 | Pott | 23,476 | 785 | 3.3% |
| 34 | Castle Shannon | 8,209 | 245 | 3.0% |
| 35 | Emmaus | 11,889 | 352 | 3.0% |
| 36 | Lancaster | 57,719 | 1,697 | 2.9% |
| 37 | Crafton | 5,961 | 174 | 2.9% |
| 38 | New Cumberland | 7,580 | 218 | 2.9% |
| 39 | Moosic | 5,973 | 171 | 2.9% |
| 40 | Milton | 6,534 | 187 | 2.9% |
| 41 | Taylor | 6,265 | 179 | 2.9% |
| 42 | Prospect Park | 6,417 | 183 | 2.9% |
| 43 | Bethlehem | 77,956 | 2,177 | 2.8% |
| 44 | Pleasant Hills | 8,399 | 233 | 2.8% |
| 45 | Dickson City | 6,023 | 166 | 2.8% |
| 46 | Erie | 93,850 | 2,586 | 2.8% |
| 47 | Carnegie | 7,978 | 218 | 2.7% |
| 48 | Carlisle | 21,852 | 579 | 2.6% |
| 49 | Doyle | 8,341 | 219 | 2.6% |
| 50 | East Stroudsburg | 9,319 | 239 | 2.6% |
| 51 | Ambler | 6,847 | 173 | 2.5% |
| 52 | South Williamsport | 6,211 | 154 | 2.5% |
| 53 | Lititz | 9,619 | 235 | 2.4% |
| 54 | Dunmore | 14,181 | 334 | 2.4% |
| 55 | Wilkinsburg | 14,027 | 322 | 2.3% |
| 56 | Mechanicsburg | 9,720 | 222 | 2.3% |
| 57 | Clifton Heights | 6,832 | 154 | 2.3% |
| 58 | Harrisburg | 50,287 | 1,110 | 2.2% |
| 59 | Norri | 35,893 | 753 | 2.1% |
| 60 | West Chester | 20,666 | 432 | 2.1% |
| 61 | Brentwood | 9,866 | 204 | 2.1% |
| 62 | Bradford | 7,683 | 158 | 2.1% |
| 63 | Wyomissing | 11,172 | 225 | 2.0% |
| 64 | Palmyra | 7,755 | 153 | 2.0% |
| 65 | Nazareth | 6,043 | 119 | 2.0% |
| 66 | Bellefonte | 6,009 | 118 | 2.0% |
| 67 | Allentown | 125,976 | 2,419 | 1.9% |
| 68 | Washington | 13,368 | 247 | 1.8% |
| 69 | Conshohocken | 9,282 | 168 | 1.8% |
| 70 | Grove City | 7,830 | 140 | 1.8% |
| 71 | Selinsgrove | 5,593 | 98 | 1.8% |
| 72 | Old Forge | 8,573 | 149 | 1.7% |
| 73 | Elizabet | 11,925 | 199 | 1.7% |
| 74 | Folcroft | 6,772 | 113 | 1.7% |
| 75 | Easton | 29,739 | 477 | 1.6% |
| 76 | Wilkes-Barre | 44,423 | 712 | 1.6% |
| 77 | Lansdowne | 11,122 | 177 | 1.6% |
| 78 | Kingston | 13,397 | 210 | 1.6% |
| 79 | Clearfield | 5,873 | 92 | 1.6% |
| 80 | Meadville | 12,577 | 194 | 1.5% |
| 81 | Turtle Creek | 5,007 | 76 | 1.5% |
| 82 | Ephrata | 13,772 | 204 | 1.5% |
| 83 | Hanover | 16,584 | 244 | 1.5% |
| 84 | Edinboro | 5,440 | 80 | 1.5% |
| 85 | Huntingdon | 6,897 | 100 | 1.4% |
| 86 | Williamsport | 27,612 | 392 | 1.4% |
| 87 | Plum | 26,723 | 359 | 1.3% |
| 88 | Glenolden | 7,220 | 96 | 1.3% |
| 89 | Bristol | 9,902 | 131 | 1.3% |
| 90 | Pittston | 7,626 | 100 | 1.3% |
| 91 | Beaver Falls | 8,850 | 111 | 1.3% |
| 92 | Lehighton | 5,268 | 65 | 1.2% |
| 93 | Waynesboro | 11,047 | 134 | 1.2% |
| 94 | Connellsville | 6,849 | 83 | 1.2% |
| 95 | Lebanon | 26,536 | 316 | 1.2% |
| 96 | Hollidaysburg | 5,558 | 64 | 1.2% |
| 97 | Mount Joy | 8,344 | 94 | 1.1% |
| 98 | Greensburg | 14,741 | 166 | 1.1% |
| 99 | Lewi | 8,479 | 89 | 1.0% |
| 100 | Jeannette | 8,657 | 90 | 1.0% |
Source: U.S. Census ACS 2020-2024. 184 cities with more than 5,000 residents.
Summary
Summary: Asian Populations Across Pennsylvania
If you’re looking for a breakdown of Asian populations across Pennsylvania according to the most recent data, this is an accurate list.
The most Asian cities in Pennsylvania are Downin, Lansdale, Whitehall, Franklin Park, State College, Baldwin, Philadelphia, Collegeville, Gettysburg, and Pittsburgh.