Racial diversity in Georgia is a mixed bag.
There are parts of Georgia where there’s a high level of diversity. But where will you find the most diverse places in Georgia?
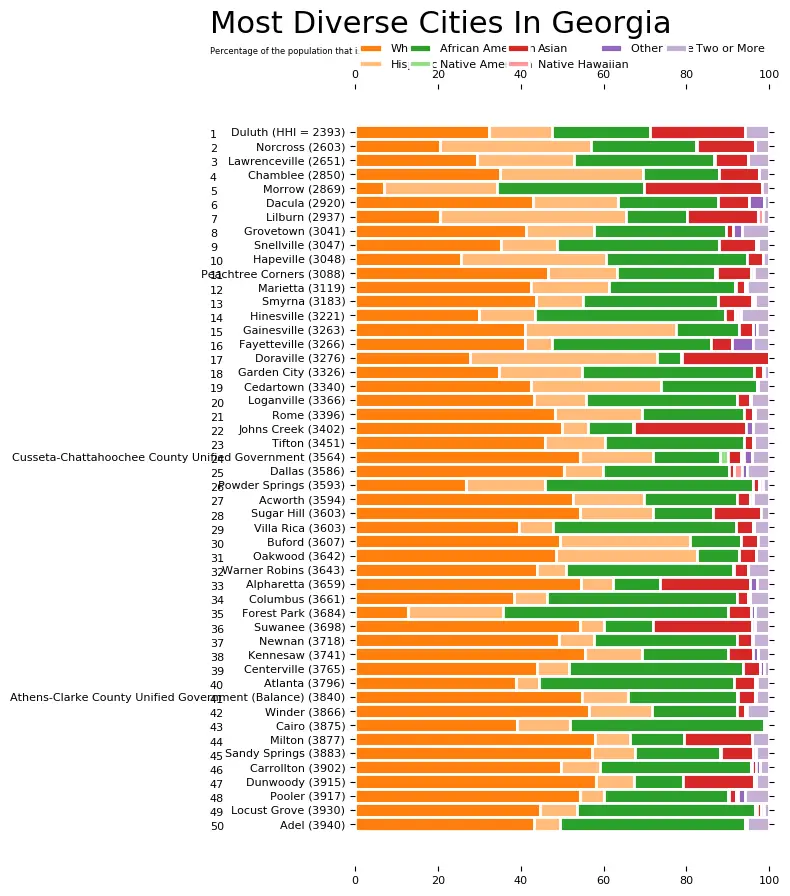
To answer that question, we went to the US Census data. Using Saturday Night Science, we measured the Gini coefficient for all 134 cities in Georgia to rank them from most to least diverse.
Table Of Contents: Top Ten | Methodology | Summary | Table
Here are the 10 most diverse places in Georgia for 2026:
So what city is the most diverse in Georgia? According to the most Census data, Duluth took the number one over all spot for diversity in Georgia.
Read on below to see how we crunched the numbers and how your town ranked. To see where Georgia ranked as a state, we have a ranking of the most diverse states in Ameria.
For more Georgia reading:
The 10 Most Diverse Places In Georgia For 2026

/10
Population: 32,426
HHI: 2,406
% White: 32.6%
% African American: 23.7%
% Hispanic: 16.3%
% Asian: 22.1%
More on Duluth: Data | Crime | Cost Of Living | Movers

/10
Population: 30,954
HHI: 2,532
% White: 26.2%
% African American: 27.6%
% Hispanic: 31.3%
% Asian: 7.1%
More on Lawrenceville: Data | Crime | Cost Of Living | Movers

/10
Population: 18,007
HHI: 2,688
% White: 24.2%
% African American: 15.2%
% Hispanic: 40.1%
% Asian: 15.5%
More on Norcross: Data | Crime | Cost Of Living | Movers

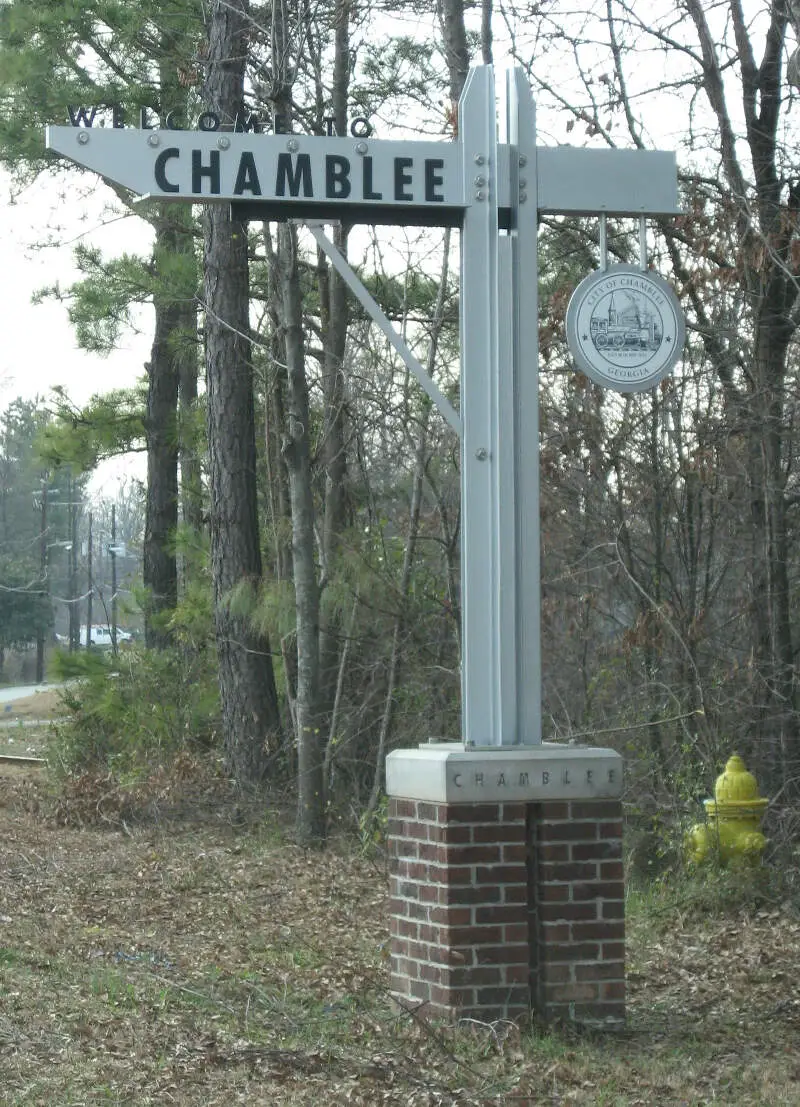
/10
Population: 30,895
HHI: 2,796
% White: 31.5%
% African American: 18.3%
% Hispanic: 36.8%
% Asian: 10.3%
More on Chamblee: Data | Crime | Cost Of Living | Movers

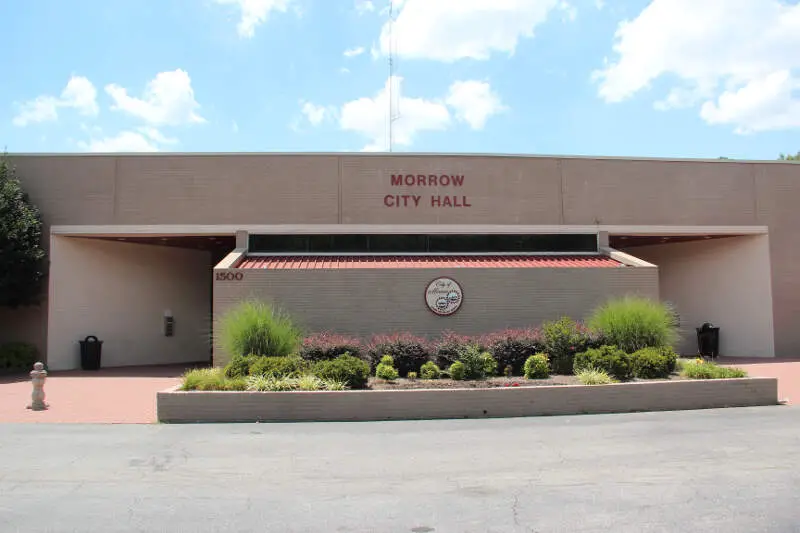
/10
Population: 6,364
HHI: 2,819
% White: 8.7%
% African American: 31.4%
% Hispanic: 30.0%
% Asian: 29.2%
More on Morrow: Data | Crime | Cost Of Living | Movers
/10

/10
Population: 21,620
HHI: 2,932
% White: 31.2%
% African American: 39.9%
% Hispanic: 15.7%
% Asian: 10.5%
More on Snellville: Data | Crime | Cost Of Living | Movers

/10
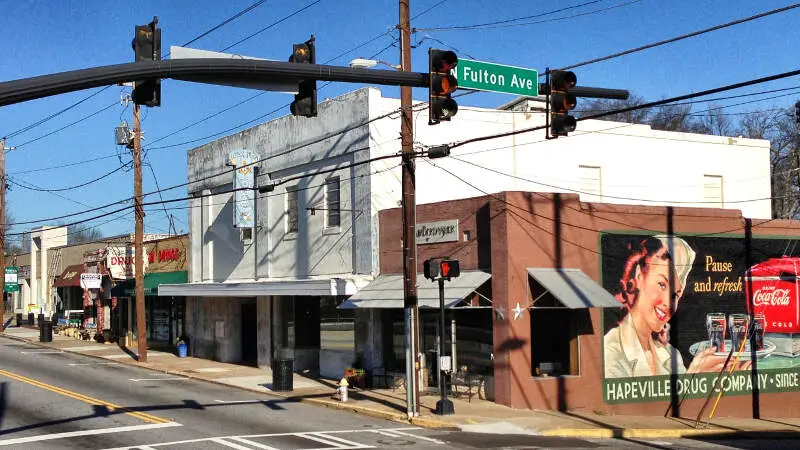
Population: 6,630
HHI: 2,942
% White: 29.8%
% African American: 35.9%
% Hispanic: 27.1%
% Asian: 4.9%
More on Hapeville: Data | Cost Of Living | Movers


/10
Population: 56,633
HHI: 3,015
% White: 42.0%
% African American: 31.6%
% Hispanic: 12.9%
% Asian: 7.8%
More on Smyrna: Data | Crime | Cost Of Living | Movers

/10
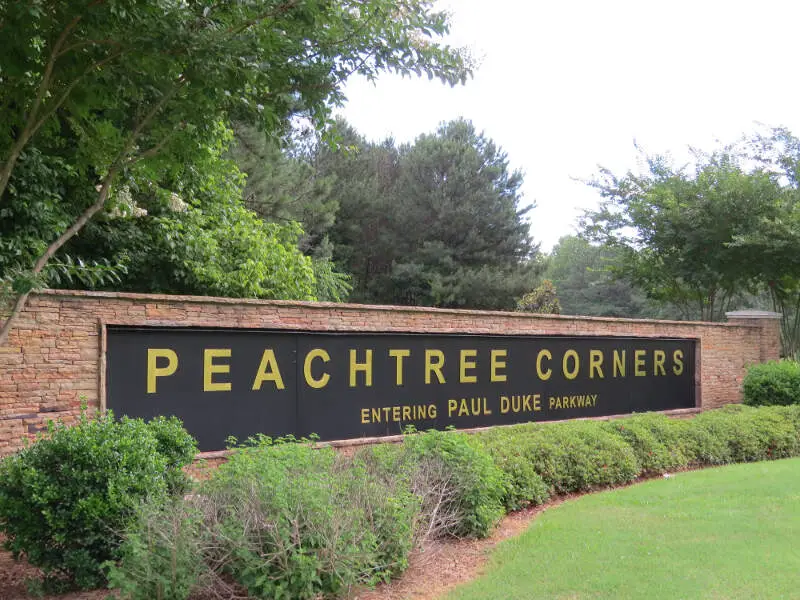
Population: 42,373
HHI: 3,032
% White: 45.3%
% African American: 22.5%
% Hispanic: 19.6%
% Asian: 8.8%
More on Peachtree Corners: Data | Cost Of Living | Movers
Methodology: How we determined the most diverse cities in Georgia for 2026
We still believe in the accuracy of data — especially from the Census — and Saturday Night Science. So that’s where we went to get the race breakdown across Georgia.
That leads us to the Census’s most recently available data, the 2020-2024 American Community Survey data from the US Census.
Specifically, we looked at table B03002: HISPANIC OR LATINO ORIGIN BY RACE. Here are the category names as defined by the Census:
- White alone*
- Black or African American alone*
- American Indian and Alaska Native alone*
- Asian alone*
- Native Hawaiian and Other Pacific Islander alone*
- Some other race alone*
- Two or more races*
- Hispanic or Latino
We limited our analysis to non-CDPs with a population greater than 5,000 people. That left us with 134 cities.
We then calculated the HHI for each city by finding the racial breakdown of a city in percent terms, squaring them, and then adding the squares together. This left us with scores ranging from 2,406 (Duluth) to 8,179 (Bremen).
Finally, we ranked each city based on the HHI, with a lower score being more diverse than a high score. Duluth took the distinction of being the most diverse, while Bremen was the least diverse city.
We updated this article for 2026. This report is our eleventh time ranking the most diverse places in Georgia.
Summary: Diversity Across Georgia
If you’re looking for a scientific breakdown of diversity across Georgia, this is an accurate list.
The most diverse cities in Georgia are Duluth, Lawrenceville, Norcross, Chamblee, Morrow, Hiram, Snellville, Hapeville, Smyrna, and Peachtree Corners.
If you’re curious enough, here are the least diverse places in Georgia:
- Bremen
- Fort Oglethorpe
- Dahlonega
For more Georgia reading, check out:
- Best Places To Live In Georgia
- Cheapest Places To Live In Georgia
- Most Dangerous Places In Georgia
- Best Places To Raise A Family In Georgia
- Safest Places In Georgia
- Worst Places To Live In Georgia
Race By City In Georgia For 2026
| Rank | City | Population | HHI | % White | % Black | % Hispanic | % Asian |
|---|---|---|---|---|---|---|---|
| 1 | Duluth, GA | 32,426 | 2,406 | 32.6% | 23.7% | 16.3% | 22.1% |
| 2 | Lawrenceville, GA | 30,954 | 2,532 | 26.2% | 27.6% | 31.3% | 7.1% |
| 3 | Norcross, GA | 18,007 | 2,688 | 24.2% | 15.2% | 40.1% | 15.5% |
| 4 | Chamblee, GA | 30,895 | 2,796 | 31.5% | 18.3% | 36.8% | 10.3% |
| 5 | Morrow, GA | 6,364 | 2,819 | 8.7% | 31.4% | 30.0% | 29.2% |
| 6 | Hiram, GA | 5,231 | 2,873 | 25.9% | 43.7% | 13.2% | 6.1% |
| 7 | Snellville, GA | 21,620 | 2,932 | 31.2% | 39.9% | 15.7% | 10.5% |
| 8 | Hapeville, GA | 6,630 | 2,942 | 29.8% | 35.9% | 27.1% | 4.9% |
| 9 | Smyrna, GA | 56,633 | 3,015 | 42.0% | 31.6% | 12.9% | 7.8% |
| 10 | Peachtree Corners, GA | 42,373 | 3,032 | 45.3% | 22.5% | 19.6% | 8.8% |
| 11 | Marietta, GA | 62,263 | 3,039 | 41.4% | 30.8% | 18.1% | 2.2% |
| 12 | Fayetteville, GA | 19,719 | 3,114 | 38.2% | 39.1% | 5.1% | 5.5% |
| 13 | Dacula, GA | 7,444 | 3,142 | 38.5% | 37.4% | 14.9% | 4.9% |
| 14 | Doraville, GA | 11,134 | 3,145 | 18.5% | 11.3% | 46.1% | 23.5% |
| 15 | Lilburn, GA | 15,390 | 3,156 | 21.0% | 14.2% | 48.2% | 13.5% |
| 16 | Suwanee, GA | 22,349 | 3,203 | 48.4% | 13.6% | 9.0% | 24.0% |
| 17 | Buford, GA | 17,997 | 3,203 | 44.8% | 8.3% | 31.9% | 8.9% |
| 18 | Garden City, GA | 10,426 | 3,215 | 36.2% | 39.3% | 18.6% | 1.6% |
| 19 | Sugar Hill, GA | 26,128 | 3,218 | 49.8% | 15.8% | 16.8% | 13.9% |
| 20 | Johns Creek, GA | 81,988 | 3,223 | 46.6% | 10.4% | 6.5% | 29.4% |
| 21 | Hinesville, GA | 35,679 | 3,259 | 26.5% | 48.1% | 13.1% | 2.1% |
| 22 | Grovetown, GA | 17,014 | 3,289 | 39.9% | 39.3% | 10.9% | 2.5% |
| 23 | Cedartown, GA | 10,227 | 3,341 | 45.1% | 20.8% | 29.4% | 0.9% |
| 24 | Gainesville, GA | 45,032 | 3,368 | 42.1% | 14.3% | 37.0% | 2.9% |
| 25 | Dallas, GA | 14,714 | 3,369 | 39.3% | 39.9% | 14.7% | 1.0% |
| 26 | Alpharetta, GA | 66,855 | 3,384 | 52.2% | 11.2% | 9.4% | 20.4% |
| 27 | Cairo, GA | 10,055 | 3,387 | 36.1% | 40.4% | 21.2% | 0.2% |
| 28 | Forest Park, GA | 19,504 | 3,409 | 12.9% | 49.5% | 27.5% | 4.7% |
| 29 | Brookhaven, GA | 57,855 | 3,426 | 52.0% | 14.3% | 21.0% | 7.4% |
| 30 | Warner Robins, GA | 82,990 | 3,466 | 41.5% | 40.3% | 8.8% | 3.4% |
| 31 | Dunwoody, GA | 51,758 | 3,471 | 53.7% | 15.4% | 11.0% | 14.7% |
| 32 | Tifton, GA | 17,210 | 3,490 | 45.7% | 34.1% | 15.0% | 1.9% |
| 33 | Eatonton, GA | 6,515 | 3,494 | 35.5% | 44.7% | 14.8% | 1.0% |
| 34 | Centerville, GA | 8,505 | 3,520 | 40.0% | 42.8% | 6.1% | 5.3% |
| 35 | Rome, GA | 38,189 | 3,535 | 51.1% | 22.1% | 20.5% | 2.2% |
| 36 | Powder Springs, GA | 18,009 | 3,537 | 24.5% | 51.2% | 17.3% | 1.5% |
| 37 | Newnan, GA | 44,235 | 3,560 | 48.2% | 33.4% | 9.4% | 4.3% |
| 38 | Kennesaw, GA | 34,605 | 3,561 | 53.1% | 22.3% | 13.6% | 5.1% |
| 39 | Sandy Springs, GA | 107,087 | 3,570 | 54.0% | 20.9% | 11.8% | 7.5% |
| 40 | Columbus, GA | 203,711 | 3,584 | 36.7% | 46.1% | 8.5% | 2.6% |
| 41 | Carrollton, GA | 27,392 | 3,597 | 47.7% | 34.1% | 11.8% | 1.3% |
| 42 | Atlanta, GA | 505,268 | 3,598 | 38.1% | 45.4% | 6.3% | 5.2% |
| 43 | Acworth, GA | 22,473 | 3,611 | 54.1% | 21.4% | 13.1% | 4.0% |
| 44 | Cusseta-Chattahoochee County Unified Government, GA | 8,887 | 3,639 | 54.1% | 19.3% | 17.9% | 3.1% |
| 45 | Pooler, GA | 28,466 | 3,643 | 50.7% | 31.2% | 6.0% | 4.1% |
| 46 | Milton, GA | 41,546 | 3,688 | 56.2% | 12.5% | 9.5% | 16.1% |
| 47 | Port Wentworth, GA | 12,892 | 3,690 | 39.6% | 44.1% | 13.2% | 0.5% |
| 48 | Adel, GA | 5,641 | 3,692 | 35.9% | 46.1% | 16.8% | 0.0% |
| 49 | Villa Rica, GA | 18,551 | 3,693 | 37.8% | 46.3% | 7.9% | 0.7% |
| 50 | Winder, GA | 19,437 | 3,709 | 55.2% | 19.1% | 16.1% | 3.1% |
| 51 | Athens-Clarke County Unified Government (Balance), GA | 127,345 | 3,726 | 53.8% | 25.7% | 11.9% | 4.2% |
| 52 | Jonesboro, GA | 6,143 | 3,732 | 21.3% | 56.0% | 8.1% | 6.6% |
| 53 | Loganville, GA | 15,527 | 3,735 | 37.3% | 47.2% | 9.6% | 1.0% |
| 54 | Moultrie, GA | 14,588 | 3,786 | 39.1% | 45.9% | 12.2% | 1.3% |
| 55 | Savannah, GA | 147,898 | 3,861 | 34.6% | 50.9% | 7.5% | 2.9% |
| 56 | Vidalia, GA | 10,752 | 3,877 | 46.5% | 40.5% | 3.7% | 1.3% |
| 57 | Oakwood, GA | 5,862 | 3,908 | 54.0% | 10.9% | 29.3% | 1.7% |
| 58 | Monroe, GA | 15,648 | 3,919 | 46.8% | 40.7% | 6.6% | 0.0% |
| 59 | Byron, GA | 5,971 | 3,951 | 48.5% | 39.1% | 4.8% | 0.3% |
| 60 | Lagrange, GA | 32,078 | 3,975 | 36.5% | 50.9% | 6.2% | 3.7% |
| 61 | Locust Grove, GA | 10,532 | 3,978 | 37.0% | 50.4% | 8.0% | 1.1% |
| 62 | Glennville, GA | 5,179 | 3,986 | 48.4% | 40.0% | 3.8% | 1.6% |
| 63 | Auburn, GA | 8,711 | 3,992 | 58.7% | 10.7% | 18.6% | 8.8% |
| 64 | Statesboro, GA | 34,149 | 3,993 | 46.7% | 42.1% | 5.5% | 1.6% |
| 65 | Covington, GA | 14,584 | 4,027 | 39.3% | 49.1% | 7.9% | 0.4% |
| 66 | Canton, GA | 35,741 | 4,050 | 56.1% | 13.0% | 26.9% | 0.7% |
| 67 | Milledgeville, GA | 16,748 | 4,083 | 48.3% | 41.5% | 4.3% | 3.4% |
| 68 | Swainsboro, GA | 7,571 | 4,091 | 33.2% | 54.1% | 5.3% | 2.4% |
| 69 | Kingsland, GA | 19,627 | 4,092 | 59.5% | 19.9% | 9.7% | 2.3% |
| 70 | Cumming, GA | 8,469 | 4,102 | 60.4% | 7.0% | 16.1% | 10.9% |
| 71 | Griffin, GA | 23,761 | 4,107 | 38.3% | 50.9% | 4.9% | 1.0% |
| 72 | Roswell, GA | 92,621 | 4,109 | 60.4% | 11.6% | 16.3% | 4.7% |
| 73 | Jackson, GA | 5,741 | 4,120 | 51.2% | 37.9% | 7.5% | 0.0% |
| 74 | Barnesville, GA | 6,121 | 4,147 | 42.8% | 47.7% | 4.9% | 1.4% |
| 75 | Augusta-Richmond County Consolidated Government (Balance), GA | 201,528 | 4,172 | 30.9% | 56.2% | 5.9% | 1.6% |
| 76 | Hampton, GA | 8,687 | 4,173 | 37.1% | 52.5% | 4.5% | 2.4% |
| 77 | Dalton, GA | 34,538 | 4,214 | 34.3% | 6.3% | 54.7% | 2.2% |
| 78 | Brunswick, GA | 15,307 | 4,295 | 29.5% | 57.7% | 9.3% | 0.1% |
| 79 | Douglas, GA | 11,749 | 4,300 | 32.6% | 56.0% | 9.8% | 0.2% |
| 80 | Valdosta, GA | 55,252 | 4,324 | 34.9% | 55.4% | 5.6% | 1.2% |
| 81 | Richmond Hill, GA | 18,181 | 4,327 | 62.2% | 13.9% | 14.6% | 2.7% |
| 82 | Waycross, GA | 13,756 | 4,329 | 35.5% | 55.0% | 6.3% | 0.7% |
| 83 | Perry, GA | 23,001 | 4,356 | 57.1% | 32.5% | 5.4% | 1.6% |
| 84 | Thomaston, GA | 9,831 | 4,357 | 54.9% | 36.1% | 3.9% | 0.3% |
| 85 | Tyrone, GA | 7,896 | 4,361 | 53.8% | 37.8% | 5.3% | 0.4% |
| 86 | Thomasville, GA | 18,666 | 4,437 | 39.6% | 53.5% | 2.1% | 0.6% |
| 87 | Jesup, GA | 9,942 | 4,462 | 57.4% | 33.5% | 6.1% | 2.0% |
| 88 | Fort Valley, GA | 8,858 | 4,473 | 23.5% | 61.5% | 11.5% | 0.2% |
| 89 | Social Circle, GA | 5,217 | 4,493 | 56.2% | 36.2% | 3.5% | 0.0% |
| 90 | Americus, GA | 15,813 | 4,504 | 28.2% | 60.5% | 5.3% | 1.7% |
| 91 | Commerce, GA | 8,013 | 4,508 | 62.3% | 19.1% | 16.0% | 0.9% |
| 92 | Bainbridge, GA | 14,404 | 4,517 | 32.2% | 58.7% | 5.6% | 1.2% |
| 93 | Sylvester, GA | 5,489 | 4,523 | 36.3% | 56.5% | 1.9% | 1.2% |
| 94 | Conyers, GA | 18,512 | 4,625 | 17.2% | 64.8% | 9.7% | 2.2% |
| 95 | Fitzgerald, GA | 8,918 | 4,648 | 45.2% | 51.0% | 2.5% | 0.8% |
| 96 | Decatur, GA | 24,518 | 4,651 | 65.9% | 12.3% | 8.9% | 4.8% |
| 97 | Stockbridge, GA | 35,737 | 4,733 | 15.5% | 66.2% | 7.7% | 6.8% |
| 98 | Cartersville, GA | 24,074 | 4,747 | 65.5% | 14.5% | 15.2% | 1.8% |
| 99 | Calhoun, GA | 18,183 | 4,772 | 64.0% | 6.6% | 24.8% | 0.7% |
| 100 | Douglasville, GA | 37,536 | 4,794 | 20.1% | 65.7% | 7.5% | 1.8% |


