Racial diversity in Georgia is a mixed bag.
There are parts of Georgia where there’s a high level of diversity. But where will you find the most diverse places in Georgia?
To answer that question, we went to the US Census data. Using Saturday Night Science, we measured the Gini coefficient for all 134 cities in Georgia to rank them from most to least diverse.
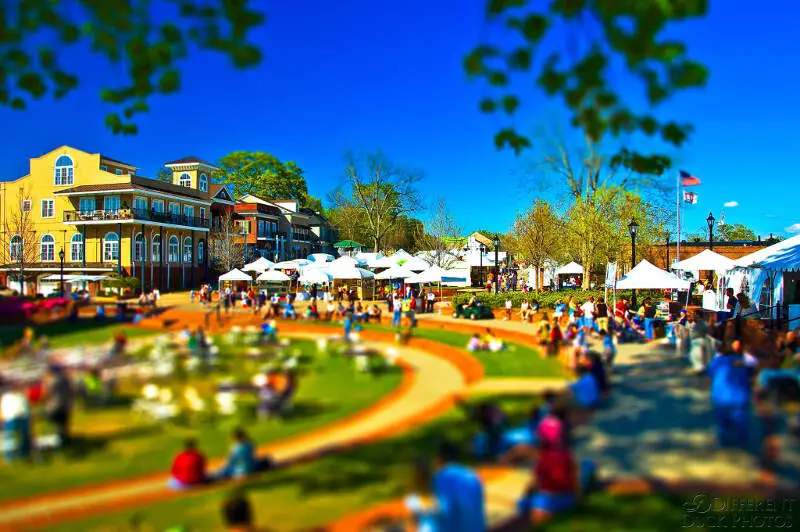
#1 most diverse in Georgia
Duluth is a city in Gwinnett County, Georgia, United States. It is a suburb of Atlanta. As of the 2010 census, Duluth had a population of 26,600, and the U.S. Census Bureau estimated the population to be 29,331 as of 2016.
Data | Crime | Cost of living | Movers
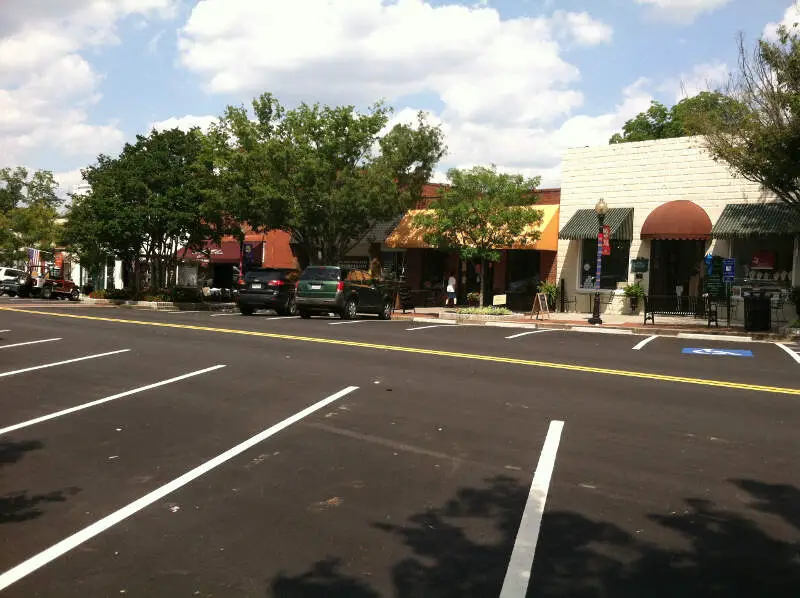
#2 most diverse in Georgia
Lawrenceville is a city in and the county seat of Gwinnett County, Georgia, United States. It is a suburb of Atlanta, located approximately 30 miles northeast of downtown. As of the 2010 census, the population of Lawrenceville was 28,546. In 2015, the U.S. Census Bureau estimated the city population to be 30,493. Lawrenceville has six ZIP codes, and it is part of the 678404 telephone area code, which is used throughout metropolitan Atlanta.
Data | Crime | Cost of living | Movers
#3 most diverse in Georgia
Norcross is a city in Gwinnett County, Georgia, United States. The population as of the 2010 census was 9,116, while in 2015 the estimated population was 16,634. It is included in the Atlanta-Sandy Springs-Marietta metropolitan statistical area, which is included in the Atlanta-Sandy Springs-Gainesville combined statistical area.
Data | Crime | Cost of living | Movers
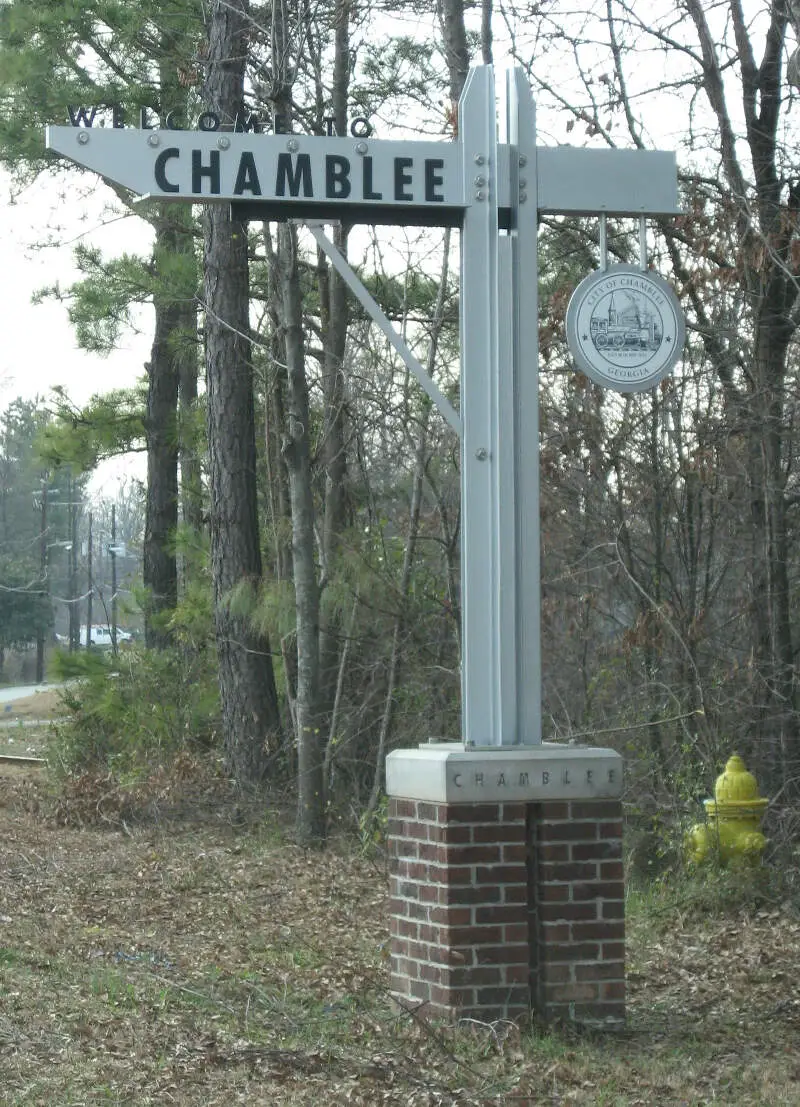
#4 most diverse in Georgia
Chamblee is a city in northern DeKalb County, Georgia, United States, northeast of Atlanta. The population was 9,892 at the 2010 census.
Data | Crime | Cost of living | Movers
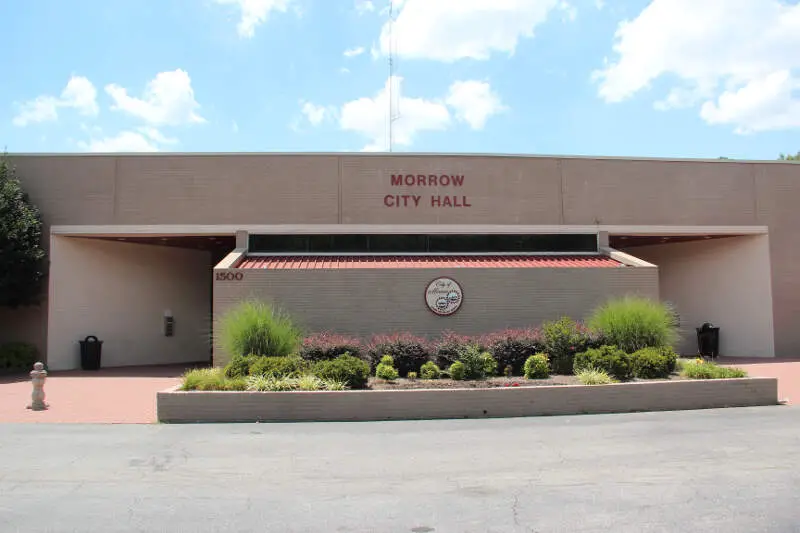
#5 most diverse in Georgia
Morrow is a city in Clayton County, Georgia, United States. The population was 6,445 at the 2010 census, up from 4,882 in 2000. It is the home of Clayton State University.
Data | Crime | Cost of living | Movers
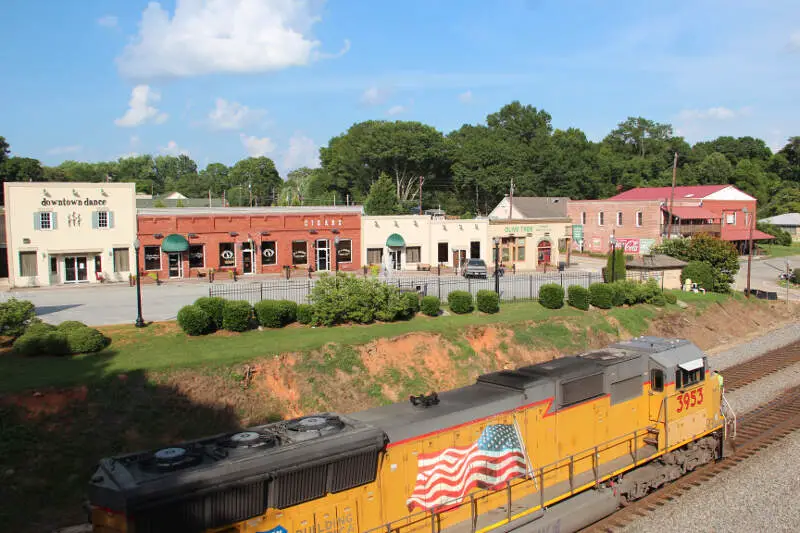
#6 most diverse in Georgia
Data | Crime | Cost of living | Movers
#7 most diverse in Georgia
Snellville is a city in Gwinnett County, Georgia, United States, east of Atlanta. The population was 18,242 at the 2010 census, and in 2015 the estimated population was 19,733.
Data | Crime | Cost of living | Movers
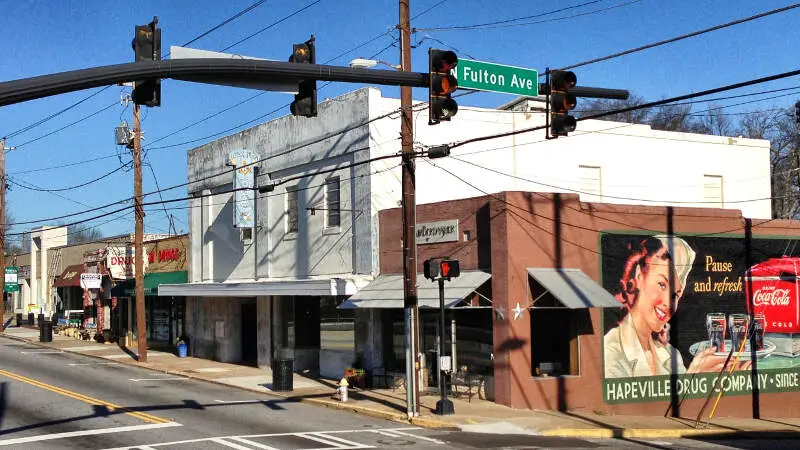
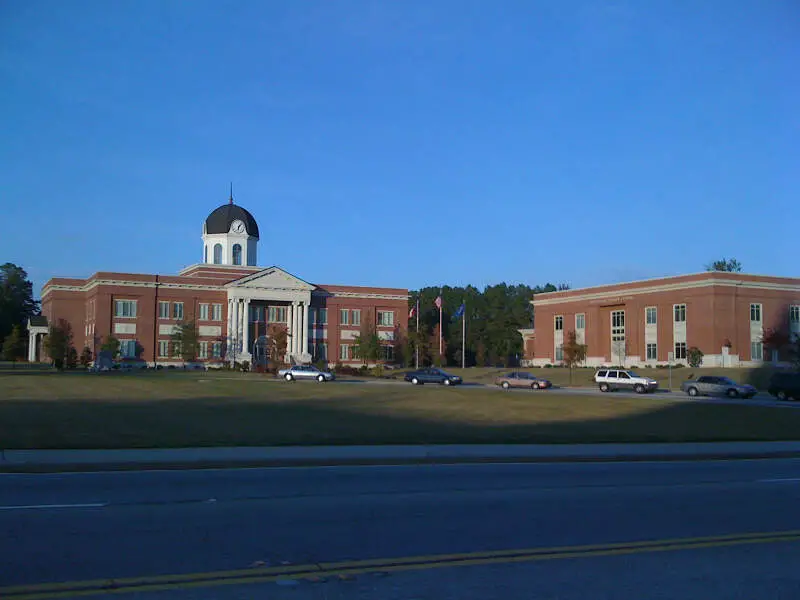
#8 most diverse in Georgia
Hapeville is a city in Fulton County, Georgia, United States, located adjacent to the city of Atlanta. The population was 6,373 at the 2010 census. It is named for Dr. Samuel Hape, one of the area’s original landowners and its first mayor.
Data | Crime | Cost of living | Movers
#9 most diverse in Georgia
Smyrna is a city northwest of the neighborhoods of Atlanta. It is in the inner ring of the Atlanta Metropolitan Area. As of the 2010 census, the city had a population of 51,271. The U.S. Census Bureau estimated the population in 2013 to be 53,438. It is included in the Atlanta-Sandy Springs-Roswell MSA, which is included in the Atlanta-Athens-Clarke-Sandy Springs CSA. Smyrna grew by 28% between the years 2000 and 2012. It is historically one of the fastest growing cities in the State of Georgia, and one of the most densely populated cities in the metro area.
Data | Crime | Cost of living | Movers
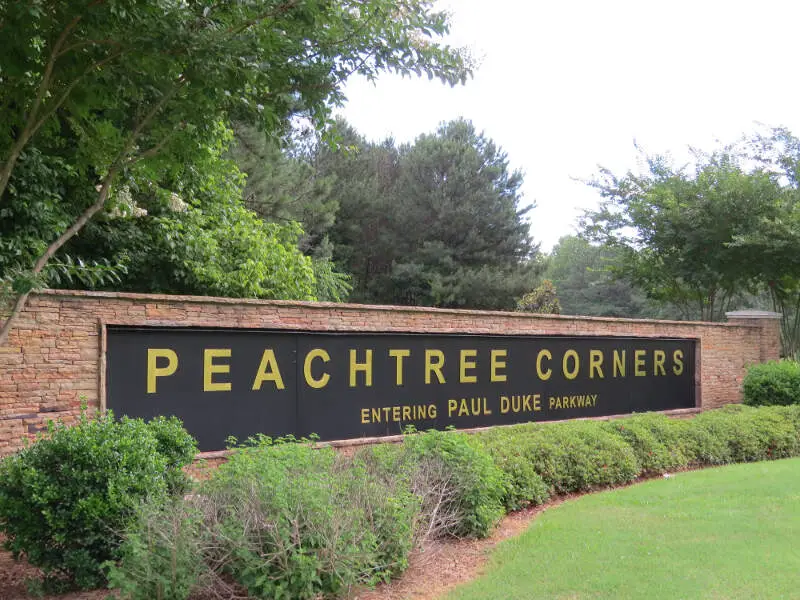
#10 most diverse in Georgia
Peachtree Corners is a city in western Gwinnett County, Georgia, United States. It is a northern suburb of Atlanta, and is the largest city in Gwinnett County, with an estimated population of 42,773 in 2016. The city, bordered to the north and west by the Chattahoochee River, is located east of Dunwoody and south of Johns Creek. Peachtree Corners is the only one of Atlanta’s northern suburbs that was developed as a planned community.
Data | Crime | Cost of living | Movers
The receipts
Compare the top ten
Pick a metric. The bars rescale. The red line is Georgia’s statewide median.
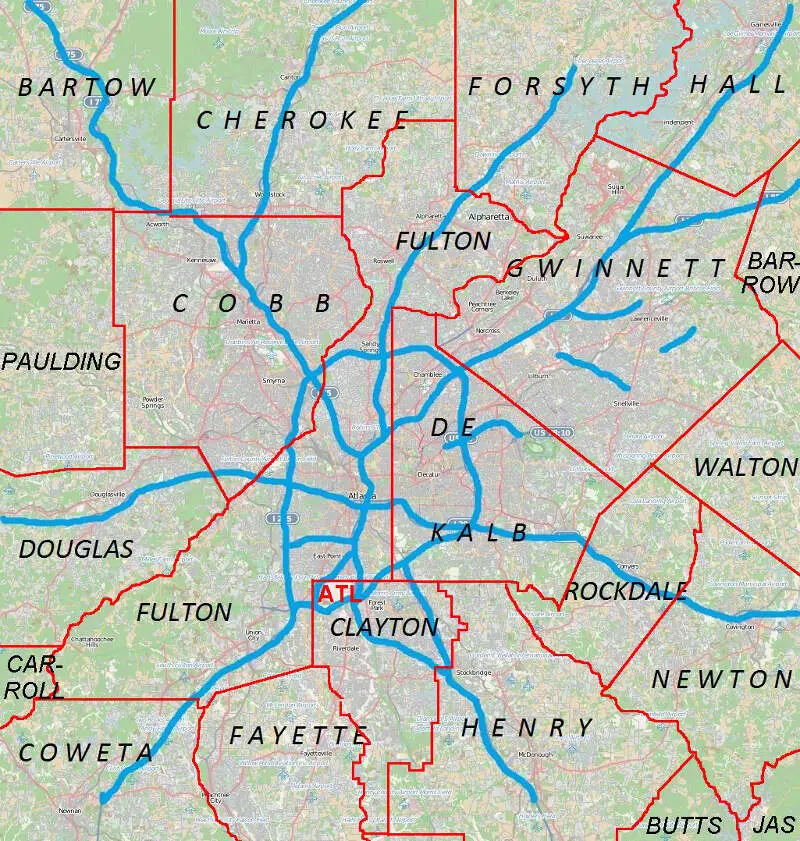
On the map
Where diversity lives in Georgia
Saturday Night Science
Methodology: How we determined the most diverse cities in Georgia for 2026
We still believe in the accuracy of data — especially from the Census — and Saturday Night Science. So that’s where we went to get the race breakdown across Georgia.
That leads us to the Census’s most recently available data, the 2020-2024 American Community Survey data from the US Census.
Specifically, we looked at table B03002: HISPANIC OR LATINO ORIGIN BY RACE. Here are the category names as defined by the Census:
- White alone*
- Black or African American alone*
- American Indian and Alaska Native alone*
- Asian alone*
- Native Hawaiian and Other Pacific Islander alone*
- Some other race alone*
- Two or more races*
- Hispanic or Latino
We limited our analysis to non-CDPs with a population greater than 5,000 people. That left us with 134 cities.
We then calculated the HHI for each city by finding the racial breakdown of a city in percent terms, squaring them, and then adding the squares together. This left us with scores ranging from 2,406 (Duluth) to 8,180 (Bremen).
Finally, we ranked each city based on the HHI, with a lower score being more diverse than a high score. Duluth took the distinction of being the most diverse, while Bremen was the least diverse city.
We updated this article for 2026. This report is our eleventh time ranking the most diverse places in Georgia.
The full plate
Race By City In Georgia For 2026
Click any column to sort. Search by city name.
| Rank | City | Population | HHI | % White | % Black | % Hispanic | % Asian |
|---|---|---|---|---|---|---|---|
| 1 | Duluth | 32,426 | 2,406 | 32.6% | 23.7% | 16.3% | 22.1% |
| 2 | Lawrenceville | 30,954 | 2,532 | 26.2% | 27.6% | 31.3% | 7.1% |
| 3 | Norcross | 18,007 | 2,688 | 24.2% | 15.2% | 40.1% | 15.5% |
| 4 | Chamblee | 30,895 | 2,796 | 31.5% | 18.3% | 36.8% | 10.3% |
| 5 | Morrow | 6,364 | 2,819 | 8.7% | 31.4% | 30.0% | 29.2% |
| 6 | Hiram | 5,231 | 2,874 | 25.9% | 43.7% | 13.2% | 6.1% |
| 7 | Snellville | 21,620 | 2,932 | 31.2% | 39.9% | 15.7% | 10.5% |
| 8 | Hapeville | 6,630 | 2,942 | 29.8% | 35.9% | 27.1% | 4.9% |
| 9 | Smyrna | 56,633 | 3,015 | 42.0% | 31.6% | 12.9% | 7.8% |
| 10 | Peachtree Corners | 42,373 | 3,033 | 45.3% | 22.5% | 19.6% | 8.8% |
| 11 | Marietta | 62,263 | 3,039 | 41.4% | 30.8% | 18.1% | 2.2% |
| 12 | Fayetteville | 19,719 | 3,114 | 38.2% | 39.1% | 5.1% | 5.5% |
| 13 | Dacula | 7,444 | 3,143 | 38.5% | 37.4% | 14.9% | 4.9% |
| 14 | Doraville | 11,134 | 3,145 | 18.5% | 11.3% | 46.1% | 23.5% |
| 15 | Lilburn | 15,390 | 3,156 | 21.0% | 14.2% | 48.2% | 13.5% |
| 16 | Buford | 17,997 | 3,204 | 44.8% | 8.3% | 31.9% | 8.9% |
| 16 | Suwanee | 22,349 | 3,204 | 48.4% | 13.6% | 9.0% | 24.0% |
| 18 | Garden City | 10,426 | 3,215 | 36.2% | 39.3% | 18.6% | 1.6% |
| 19 | Sugar Hill | 26,128 | 3,219 | 49.8% | 15.8% | 16.8% | 13.9% |
| 20 | Johns Creek | 81,988 | 3,224 | 46.6% | 10.4% | 6.5% | 29.4% |
| 21 | Hinesville | 35,679 | 3,259 | 26.5% | 48.1% | 13.1% | 2.1% |
| 22 | Grovetown | 17,014 | 3,290 | 39.9% | 39.3% | 10.9% | 2.5% |
| 23 | Cedartown | 10,227 | 3,342 | 45.1% | 20.8% | 29.4% | 0.9% |
| 24 | Gainesville | 45,032 | 3,369 | 42.1% | 14.3% | 37.0% | 2.9% |
| 25 | Dallas | 14,714 | 3,369 | 39.3% | 39.9% | 14.7% | 1.0% |
| 26 | Alpharetta | 66,855 | 3,384 | 52.2% | 11.2% | 9.4% | 20.4% |
| 27 | Cairo | 10,055 | 3,387 | 36.1% | 40.4% | 21.2% | 0.2% |
| 28 | Forest Park | 19,504 | 3,410 | 12.9% | 49.5% | 27.5% | 4.7% |
| 29 | Brookhaven | 57,855 | 3,426 | 52.0% | 14.3% | 21.0% | 7.4% |
| 30 | Warner Robins | 82,990 | 3,467 | 41.5% | 40.3% | 8.8% | 3.4% |
| 31 | Dunwoody | 51,758 | 3,471 | 53.7% | 15.4% | 11.0% | 14.7% |
| 32 | Tifton | 17,210 | 3,490 | 45.7% | 34.1% | 15.0% | 1.9% |
| 33 | Eatonton | 6,515 | 3,494 | 35.5% | 44.7% | 14.8% | 1.0% |
| 34 | Centerville | 8,505 | 3,520 | 40.0% | 42.8% | 6.1% | 5.3% |
| 35 | Rome | 38,189 | 3,536 | 51.1% | 22.1% | 20.5% | 2.2% |
| 36 | Powder Springs | 18,009 | 3,538 | 24.5% | 51.2% | 17.3% | 1.5% |
| 37 | Newnan | 44,235 | 3,561 | 48.2% | 33.4% | 9.4% | 4.3% |
| 38 | Kennesaw | 34,605 | 3,561 | 53.1% | 22.3% | 13.6% | 5.1% |
| 39 | Sandy Springs | 107,087 | 3,571 | 54.0% | 20.9% | 11.8% | 7.5% |
| 40 | Columbus | 203,711 | 3,585 | 36.7% | 46.1% | 8.5% | 2.6% |
| 41 | Carrollton | 27,392 | 3,597 | 47.7% | 34.1% | 11.8% | 1.3% |
| 42 | Atlanta | 505,268 | 3,599 | 38.1% | 45.4% | 6.3% | 5.2% |
| 43 | Acworth | 22,473 | 3,612 | 54.1% | 21.4% | 13.1% | 4.0% |
| 44 | Cusseta-Chattahoochee County unified government | 8,887 | 3,640 | 54.1% | 19.3% | 17.9% | 3.1% |
| 45 | Pooler | 28,466 | 3,643 | 50.7% | 31.2% | 6.0% | 4.1% |
| 46 | Milton | 41,546 | 3,689 | 56.2% | 12.5% | 9.5% | 16.1% |
| 47 | Port Wentworth | 12,892 | 3,691 | 39.6% | 44.1% | 13.2% | 0.5% |
| 48 | Adel | 5,641 | 3,693 | 35.9% | 46.1% | 16.8% | 0.0% |
| 49 | Villa Rica | 18,551 | 3,694 | 37.8% | 46.3% | 7.9% | 0.7% |
| 50 | Winder | 19,437 | 3,709 | 55.2% | 19.1% | 16.1% | 3.1% |
| 51 | Athens-Clarke County unified government (balance) | 127,345 | 3,726 | 53.8% | 25.7% | 11.9% | 4.2% |
| 52 | Jonesboro | 6,143 | 3,733 | 21.3% | 56.0% | 8.1% | 6.6% |
| 53 | Loganville | 15,527 | 3,736 | 37.3% | 47.2% | 9.6% | 1.0% |
| 54 | Moultrie | 14,588 | 3,786 | 39.1% | 45.9% | 12.2% | 1.3% |
| 55 | Savannah | 147,898 | 3,861 | 34.6% | 50.9% | 7.5% | 2.9% |
| 56 | Vidalia | 10,752 | 3,877 | 46.5% | 40.5% | 3.7% | 1.3% |
| 57 | Oakwood | 5,862 | 3,909 | 54.0% | 10.9% | 29.3% | 1.7% |
| 58 | Monroe | 15,648 | 3,919 | 46.8% | 40.7% | 6.6% | 0.0% |
| 59 | Byron | 5,971 | 3,951 | 48.5% | 39.1% | 4.8% | 0.3% |
| 60 | LaGrange | 32,078 | 3,976 | 36.5% | 50.9% | 6.2% | 3.7% |
| 61 | Locust Grove | 10,532 | 3,979 | 37.0% | 50.4% | 8.0% | 1.1% |
| 62 | Glennville | 5,179 | 3,987 | 48.4% | 40.0% | 3.8% | 1.6% |
| 63 | Auburn | 8,711 | 3,992 | 58.7% | 10.7% | 18.6% | 8.8% |
| 64 | Statesboro | 34,149 | 3,993 | 46.7% | 42.1% | 5.5% | 1.6% |
| 65 | Covington | 14,584 | 4,028 | 39.3% | 49.1% | 7.9% | 0.4% |
| 66 | Canton | 35,741 | 4,050 | 56.1% | 13.0% | 26.9% | 0.7% |
| 67 | Milledgeville | 16,748 | 4,083 | 48.3% | 41.5% | 4.3% | 3.4% |
| 68 | Swainsboro | 7,571 | 4,091 | 33.2% | 54.1% | 5.3% | 2.4% |
| 69 | Kingsland | 19,627 | 4,092 | 59.5% | 19.9% | 9.7% | 2.3% |
| 70 | Cumming | 8,469 | 4,102 | 60.4% | 7.0% | 16.1% | 10.9% |
| 71 | Griffin | 23,761 | 4,108 | 38.3% | 50.9% | 4.9% | 1.0% |
| 72 | Roswell | 92,621 | 4,109 | 60.4% | 11.6% | 16.3% | 4.7% |
| 73 | Jackson | 5,741 | 4,120 | 51.2% | 37.9% | 7.5% | 0.0% |
| 74 | Barnesville | 6,121 | 4,148 | 42.8% | 47.7% | 4.9% | 1.4% |
| 75 | Augusta-Richmond County consolidated government (balance) | 201,528 | 4,173 | 30.9% | 56.2% | 5.9% | 1.6% |
| 76 | Hampton | 8,687 | 4,174 | 37.1% | 52.5% | 4.5% | 2.4% |
| 77 | Dalton | 34,538 | 4,215 | 34.3% | 6.3% | 54.7% | 2.2% |
| 78 | Brunswick | 15,307 | 4,295 | 29.5% | 57.7% | 9.3% | 0.1% |
| 79 | Douglas | 11,749 | 4,301 | 32.6% | 56.0% | 9.8% | 0.2% |
| 80 | Valdosta | 55,252 | 4,325 | 34.9% | 55.4% | 5.6% | 1.2% |
| 81 | Richmond Hill | 18,181 | 4,327 | 62.2% | 13.9% | 14.6% | 2.7% |
| 82 | Waycross | 13,756 | 4,330 | 35.5% | 55.0% | 6.3% | 0.7% |
| 83 | Perry | 23,001 | 4,356 | 57.1% | 32.5% | 5.4% | 1.6% |
| 84 | Thomaston | 9,831 | 4,357 | 54.9% | 36.1% | 3.9% | 0.3% |
| 85 | Tyrone | 7,896 | 4,362 | 53.8% | 37.8% | 5.3% | 0.4% |
| 86 | Thomasville | 18,666 | 4,438 | 39.6% | 53.5% | 2.1% | 0.6% |
| 87 | Jesup | 9,942 | 4,462 | 57.4% | 33.5% | 6.1% | 2.0% |
| 88 | Fort Valley | 8,858 | 4,473 | 23.5% | 61.5% | 11.5% | 0.2% |
| 89 | Social Circle | 5,217 | 4,493 | 56.2% | 36.2% | 3.5% | 0.0% |
| 90 | Americus | 15,813 | 4,505 | 28.2% | 60.5% | 5.3% | 1.7% |
| 91 | Commerce | 8,013 | 4,509 | 62.3% | 19.1% | 16.0% | 0.9% |
| 92 | Bainbridge | 14,404 | 4,517 | 32.2% | 58.7% | 5.6% | 1.2% |
| 93 | Sylvester | 5,489 | 4,523 | 36.3% | 56.5% | 1.9% | 1.2% |
| 94 | Conyers | 18,512 | 4,626 | 17.2% | 64.8% | 9.7% | 2.2% |
| 95 | Fitzgerald | 8,918 | 4,648 | 45.2% | 51.0% | 2.5% | 0.8% |
| 96 | Decatur | 24,518 | 4,651 | 65.9% | 12.3% | 8.9% | 4.8% |
| 97 | Stockbridge | 35,737 | 4,734 | 15.5% | 66.2% | 7.7% | 6.8% |
| 98 | Cartersville | 24,074 | 4,748 | 65.5% | 14.5% | 15.2% | 1.8% |
| 99 | Calhoun | 18,183 | 4,772 | 64.0% | 6.6% | 24.8% | 0.7% |
| 100 | Douglasville | 37,536 | 4,795 | 20.1% | 65.7% | 7.5% | 1.8% |
Source: U.S. Census ACS 2020-2024. 134 cities with more than 5,000 residents.
Summary
Summary: Diversity Across Georgia
If you’re looking for a scientific breakdown of diversity across Georgia, this is an accurate list.
The most diverse cities in Georgia are Duluth, Lawrenceville, Norcross, Chamblee, Morrow, Hiram, Snellville, Hapeville, Smyrna, and Peachtree Corners. Not sold on Georgia? Take the two-minute Find Your Place quiz and see which state actually fits you.
Questions and answers
Most Diverse Cities In Georgia FAQs
What is the most diverse city in Georgia?
Duluth is the most diverse city in Georgia for 2026, posting the lowest diversity index (2,406) of the 134 places we measured. Lawrenceville and Norcross are next.
What are the 10 most diverse cities in Georgia?
The ten most diverse cities in Georgia are Duluth, Lawrenceville, Norcross, Chamblee, Morrow, Hiram, Snellville, Hapeville, Smyrna, and Peachtree Corners. We ranked all 134 places with more than 5,000 residents by their racial-diversity HHI.
How do you measure diversity?
We use a Herfindahl-Hirschman Index (HHI) across each city’s White, Black, Hispanic, and Asian population shares from the Census American Community Survey. A lower score means the mix is more even, so the lowest HHI wins.
What is the least diverse city in Georgia?
Bremen is the least diverse city in Georgia, with a diversity index of 8,180. That means one group makes up most of its population.
Where does this data come from?
All population shares come from the Census Bureau’s American Community Survey (2020-2024). Diversity scores in Georgia range from 2,406 in Duluth to 8,180 in Bremen.


