
Racial diversity in Michigan is a mixed bag.
There are parts of Michigan where there’s a high level of diversity. But where will you find the most diverse places in Michigan?
To answer that question, we went to the US Census data. Using Saturday Night Science, we measured the Gini coefficient for all 154 cities in Michigan to rank them from most to least diverse.
Table Of Contents: Top Ten | Methodology | Summary | Table
Here are the 10 most diverse places in Michigan for 2025:
So what city is the most diverse in Michigan? According to the most Census data, Ecorse took the number one over all spot for diversity in Michigan.
Read on below to see how we crunched the numbers and how your town ranked. To see where Michigan ranked as a state, we have a ranking of the most diverse states in Ameria.
For more Michigan reading:
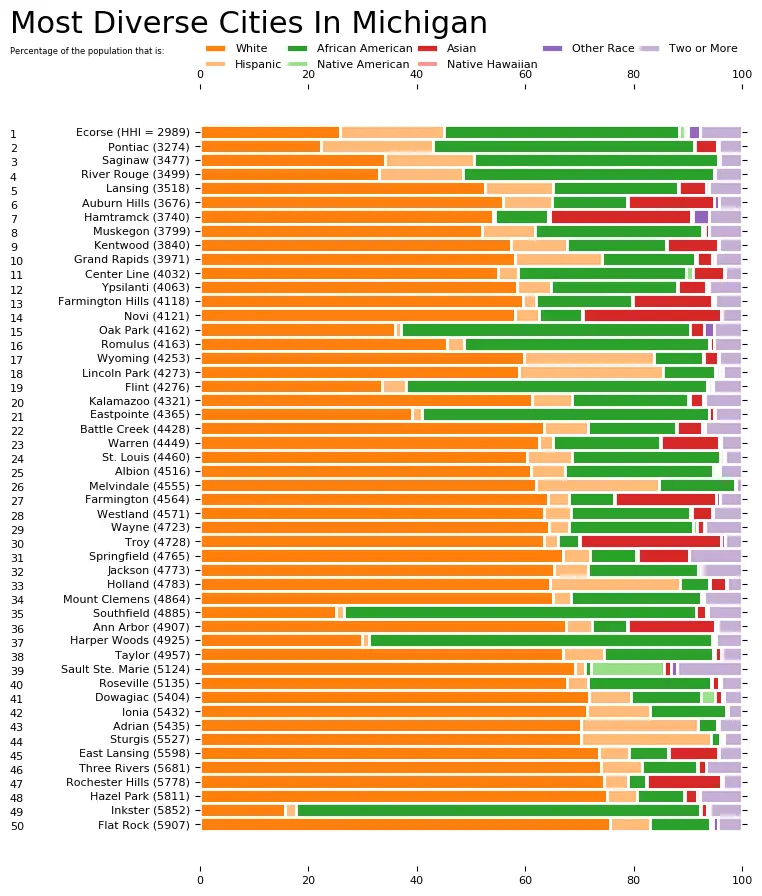
The 10 Most Diverse Places In Michigan For 2025

/10
Population: 9,170
HHI: 3,118
% White: 25.6%
% African American: 44.8%
% Hispanic: 20.5%
% Asian: 0.0%
More on Ecorse: Data

/10
Population: 61,914
HHI: 3,131
% White: 22.4%
% African American: 46.0%
% Hispanic: 21.7%
% Asian: 3.7%
More on Pontiac: Data

/10
Population: 112,546
HHI: 3,386
% White: 51.3%
% African American: 22.7%
% Hispanic: 12.9%
% Asian: 5.3%
More on Lansing: Data

/10
Population: 7,092
HHI: 3,440
% White: 34.1%
% African American: 44.8%
% Hispanic: 15.6%
% Asian: 0.0%
More on River Rouge: Data

/10
Population: 43,879
HHI: 3,539
% White: 34.7%
% African American: 45.7%
% Hispanic: 15.3%
% Asian: 0.2%
More on Saginaw: Data

/10
Population: 8,448
HHI: 3,588
% White: 50.7%
% African American: 29.5%
% Hispanic: 4.0%
% Asian: 10.6%
More on Center Line: Data

/10
Population: 54,114
HHI: 3,590
% White: 54.6%
% African American: 19.3%
% Hispanic: 11.1%
% Asian: 9.8%
More on Kentwood: Data

/10
Population: 24,911
HHI: 3,634
% White: 56.0%
% African American: 11.8%
% Hispanic: 11.0%
% Asian: 14.5%
More on Auburn Hills: Data

/10
Population: 37,203
HHI: 3,718
% White: 51.6%
% African American: 29.9%
% Hispanic: 11.0%
% Asian: 0.7%
More on Muskegon: Data

/10
Population: 197,768
HHI: 3,901
% White: 57.5%
% African American: 17.4%
% Hispanic: 16.1%
% Asian: 2.8%
More on Grand Rapids: Data
Methodology: How we determined the most diverse cities in Michigan for 2025
We still believe in the accuracy of data — especially from the Census — and Saturday Night Science. So that’s where we went to get the race breakdown across Michigan.
That leads us to the Census’s most recently available data, the 2019-2023 American Community Survey data from the US Census.
Specifically, we looked at table B03002: HISPANIC OR LATINO ORIGIN BY RACE. Here are the category names as defined by the Census:
- White alone*
- Black or African American alone*
- American Indian and Alaska Native alone*
- Asian alone*
- Native Hawaiian and Other Pacific Islander alone*
- Some other race alone*
- Two or more races*
- Hispanic or Latino
We limited our analysis to non-CDPs with a population greater than 5,000 people. That left us with 154 cities.
We then calculated the HHI for each city by finding the racial breakdown of a city in percent terms, squaring them, and then adding the squares together. This left us with scores ranging from 3,118 (Ecorse) to 9,163 (Chelsea).
Finally, we ranked each city based on the HHI, with a lower score being more diverse than a high score. Ecorse took the distinction of being the most diverse, while Chelsea was the least diverse city.
We updated this article for 2025. This report is our tenth time ranking the most diverse places in Michigan.
Summary: Diversity Across Michigan
If you’re looking for a scientific breakdown of diversity across Michigan, this is an accurate list.
The most diverse cities in Michigan are Ecorse, Pontiac, Lansing, River Rouge, Saginaw, Center Line, Kentwood, Auburn Hills, Muskegon, and Grand Rapids.
If you’re curious enough, here are the least diverse places in Michigan:
- Chelsea
- Gladstone
- Menominee
For more Michigan reading, check out:
- Best Places To Live In Michigan
- Cheapest Places To Live In Michigan
- Most Dangerous Places in Michigan
- Best Places To Raise A Family In Michigan
- Safest Places In Michigan
- Worst Places To Live In Michigan
Race By City In Michigan For 2025
| Rank | City | Population | HHI | % White | % Black | % Hispanic | % Asian |
|---|---|---|---|---|---|---|---|
| 1 | Ecorse, MI | 9,170 | 3,118 | 25.6% | 44.8% | 20.5% | 0.0% |
| 2 | Pontiac, MI | 61,914 | 3,131 | 22.4% | 46.0% | 21.7% | 3.7% |
| 3 | Lansing, MI | 112,546 | 3,386 | 51.3% | 22.7% | 12.9% | 5.3% |
| 4 | River Rouge, MI | 7,092 | 3,440 | 34.1% | 44.8% | 15.6% | 0.0% |
| 5 | Saginaw, MI | 43,879 | 3,539 | 34.7% | 45.7% | 15.3% | 0.2% |
| 6 | Center Line, MI | 8,448 | 3,588 | 50.7% | 29.5% | 4.0% | 10.6% |
| 7 | Kentwood, MI | 54,114 | 3,590 | 54.6% | 19.3% | 11.1% | 9.8% |
| 8 | Auburn Hills, MI | 24,911 | 3,634 | 56.0% | 11.8% | 11.0% | 14.5% |
| 9 | Muskegon, MI | 37,203 | 3,718 | 51.6% | 29.9% | 11.0% | 0.7% |
| 10 | Grand Rapids, MI | 197,768 | 3,901 | 57.5% | 17.4% | 16.1% | 2.8% |
| 11 | Ypsilanti, MI | 19,937 | 3,907 | 57.2% | 22.4% | 8.4% | 5.1% |
| 12 | Hamtramck, MI | 27,830 | 3,968 | 56.5% | 8.2% | 0.3% | 25.7% |
| 13 | Novi, MI | 66,224 | 3,996 | 56.9% | 8.3% | 4.9% | 25.5% |
| 14 | Farmington Hills, MI | 83,316 | 4,065 | 59.1% | 18.2% | 2.6% | 14.5% |
| 15 | Romulus, MI | 24,951 | 4,098 | 45.9% | 43.9% | 1.4% | 0.6% |
| 16 | Oak Park, MI | 29,370 | 4,137 | 35.8% | 53.1% | 1.1% | 2.7% |
| 17 | Warren, MI | 138,128 | 4,172 | 59.8% | 20.8% | 2.8% | 11.9% |
| 18 | Wyoming, MI | 76,865 | 4,177 | 58.6% | 9.1% | 25.1% | 2.1% |
| 19 | Kalamazoo, MI | 73,132 | 4,202 | 60.2% | 21.4% | 8.6% | 2.6% |
| 20 | Albion, MI | 7,608 | 4,243 | 56.2% | 32.0% | 7.1% | 0.4% |
| 21 | Flint, MI | 80,835 | 4,254 | 32.6% | 56.0% | 4.5% | 0.6% |
| 22 | St. Louis, MI | 6,926 | 4,283 | 59.3% | 25.4% | 10.7% | 0.3% |
| 23 | Lincoln Park, MI | 39,511 | 4,332 | 60.2% | 8.8% | 24.7% | 0.6% |
| 24 | Battle Creek, MI | 52,392 | 4,336 | 62.8% | 15.6% | 8.4% | 4.7% |
| 25 | Eastpointe, MI | 34,003 | 4,336 | 38.5% | 53.0% | 0.9% | 0.8% |
| 26 | Wayne, MI | 17,413 | 4,399 | 60.8% | 25.3% | 5.2% | 1.5% |
| 27 | Farmington, MI | 11,472 | 4,416 | 62.6% | 8.2% | 4.3% | 19.9% |
| 28 | Westland, MI | 84,155 | 4,431 | 62.1% | 22.4% | 5.0% | 3.8% |
| 29 | Melvindale, MI | 12,605 | 4,596 | 62.5% | 12.3% | 23.1% | 0.0% |
| 30 | Jackson, MI | 31,206 | 4,623 | 63.9% | 20.7% | 6.3% | 0.5% |
| 31 | Troy, MI | 87,307 | 4,637 | 62.6% | 4.1% | 2.7% | 26.1% |
| 32 | Springfield, MI | 5,295 | 4,668 | 66.1% | 8.1% | 4.9% | 9.0% |
| 33 | Taylor, MI | 62,405 | 4,671 | 64.7% | 19.5% | 8.6% | 1.9% |
| 34 | Southfield, MI | 76,025 | 4,743 | 25.6% | 63.6% | 1.9% | 2.1% |
| 35 | Ann Arbor, MI | 121,179 | 4,776 | 66.7% | 7.0% | 5.4% | 15.1% |
| 36 | Mount Clemens, MI | 15,567 | 4,777 | 64.7% | 22.7% | 3.5% | 0.3% |
| 37 | Holland, MI | 34,266 | 4,829 | 65.2% | 4.7% | 23.2% | 3.0% |
| 38 | Roseville, MI | 47,240 | 4,867 | 65.5% | 23.2% | 4.1% | 1.6% |
| 39 | Harper Woods, MI | 15,205 | 4,982 | 29.8% | 63.8% | 1.6% | 0.4% |
| 40 | Sault Ste. Marie, MI | 13,373 | 5,112 | 69.1% | 1.0% | 2.2% | 1.2% |
| 41 | Sturgis, MI | 11,077 | 5,115 | 65.9% | 1.4% | 27.4% | 0.8% |
| 42 | Dowagiac, MI | 5,677 | 5,326 | 71.3% | 11.5% | 7.4% | 0.2% |
| 43 | East Lansing, MI | 45,394 | 5,376 | 71.9% | 7.6% | 6.3% | 9.2% |
| 44 | Adrian, MI | 20,493 | 5,461 | 70.5% | 3.9% | 21.3% | 0.3% |
| 45 | Ionia, MI | 12,950 | 5,470 | 71.9% | 14.0% | 9.5% | 0.0% |
| 46 | Inkster, MI | 25,602 | 5,561 | 16.8% | 72.3% | 2.2% | 1.1% |
| 47 | Rochester Hills, MI | 76,086 | 5,605 | 73.3% | 3.4% | 5.0% | 13.4% |
| 48 | Hazel Park, MI | 14,945 | 5,612 | 73.6% | 9.7% | 5.8% | 1.1% |
| 49 | Wixom, MI | 17,126 | 5,618 | 73.7% | 9.2% | 5.7% | 7.0% |
| 50 | Three Rivers, MI | 7,936 | 5,766 | 74.5% | 10.5% | 7.5% | 0.9% |
| 51 | Southgate, MI | 29,551 | 5,844 | 75.1% | 8.2% | 10.7% | 2.8% |
| 52 | New Haven, MI | 6,341 | 5,855 | 74.7% | 9.0% | 2.5% | 0.0% |
| 53 | Grand Blanc, MI | 7,995 | 5,943 | 75.4% | 14.3% | 4.4% | 0.7% |
| 54 | Muskegon Heights, MI | 9,902 | 5,965 | 15.8% | 75.4% | 2.9% | 0.0% |
| 55 | Detroit, MI | 636,644 | 6,021 | 10.3% | 76.4% | 8.0% | 1.6% |
| 56 | Flat Rock, MI | 10,418 | 6,028 | 76.5% | 6.5% | 10.1% | 0.2% |
| 57 | Riverview, MI | 12,269 | 6,084 | 76.8% | 8.2% | 10.5% | 0.9% |
| 58 | Lapeer, MI | 9,053 | 6,111 | 77.0% | 10.0% | 5.5% | 0.5% |
| 59 | Allen Park, MI | 28,128 | 6,150 | 77.2% | 4.7% | 12.6% | 1.4% |
| 60 | Sterling Heights, MI | 133,473 | 6,249 | 78.2% | 6.5% | 2.4% | 8.9% |
| 61 | Niles, MI | 11,838 | 6,267 | 77.9% | 12.5% | 4.1% | 0.4% |
| 62 | Houghton, MI | 8,341 | 6,274 | 78.5% | 2.8% | 3.5% | 8.9% |
| 63 | Woodhaven, MI | 12,761 | 6,297 | 78.4% | 7.0% | 9.4% | 1.8% |
| 64 | Port Huron, MI | 28,724 | 6,303 | 78.5% | 6.8% | 7.1% | 0.7% |
| 65 | Mount Pleasant, MI | 21,420 | 6,389 | 79.3% | 5.0% | 6.4% | 2.8% |
| 66 | Madison Heights, MI | 28,411 | 6,418 | 79.3% | 7.4% | 1.8% | 7.4% |
| 67 | Burton, MI | 29,529 | 6,459 | 79.5% | 9.5% | 4.5% | 0.6% |
| 68 | Beverly Hills, MI | 10,507 | 6,540 | 80.2% | 6.9% | 3.1% | 4.0% |
| 69 | Benton Harbor, MI | 9,023 | 6,557 | 9.3% | 80.2% | 5.5% | 0.0% |
| 70 | Richmond, MI | 5,839 | 6,564 | 80.3% | 2.2% | 7.4% | 0.0% |
| 71 | Portage, MI | 49,015 | 6,586 | 80.6% | 5.6% | 5.4% | 3.4% |
| 72 | Utica, MI | 5,184 | 6,604 | 80.7% | 3.8% | 5.6% | 5.3% |
| 73 | Royal Oak, MI | 57,880 | 6,620 | 80.8% | 6.1% | 4.7% | 3.8% |
| 74 | Ferndale, MI | 19,156 | 6,633 | 80.9% | 5.6% | 5.0% | 2.8% |
| 75 | Fraser, MI | 14,604 | 6,648 | 80.8% | 9.1% | 2.8% | 1.8% |
| 76 | Bay City, MI | 32,445 | 6,677 | 80.8% | 2.4% | 10.7% | 0.5% |
| 77 | Grandville, MI | 16,135 | 6,717 | 81.4% | 5.6% | 5.9% | 1.7% |
| 78 | Alma, MI | 9,421 | 6,728 | 80.9% | 2.8% | 12.8% | 1.4% |
| 79 | Dearborn Heights, MI | 62,099 | 6,791 | 81.7% | 8.9% | 5.1% | 1.1% |
| 80 | Garden City, MI | 26,910 | 6,836 | 82.1% | 6.6% | 5.4% | 0.9% |
| 81 | Coldwater, MI | 13,847 | 6,874 | 82.2% | 4.9% | 9.0% | 0.2% |
| 82 | Rochester, MI | 12,939 | 6,885 | 82.3% | 2.1% | 1.2% | 8.3% |
| 83 | Livonia, MI | 94,058 | 6,892 | 82.6% | 4.3% | 4.5% | 3.7% |
| 84 | Walled Lake, MI | 7,275 | 7,079 | 83.7% | 4.2% | 4.4% | 5.6% |
| 85 | Birmingham, MI | 21,612 | 7,085 | 83.8% | 3.6% | 3.8% | 5.1% |
| 86 | Allegan, MI | 5,182 | 7,107 | 83.7% | 2.0% | 5.8% | 0.2% |
| 87 | Grosse Pointe Park, MI | 11,394 | 7,116 | 83.9% | 5.3% | 1.5% | 1.8% |
| 88 | St. Joseph, MI | 7,805 | 7,136 | 84.1% | 4.8% | 4.1% | 2.9% |
| 89 | Monroe, MI | 20,330 | 7,137 | 83.9% | 8.2% | 2.1% | 0.6% |
| 90 | Wyandotte, MI | 24,593 | 7,144 | 84.0% | 2.0% | 8.2% | 0.6% |
| 91 | Walker, MI | 25,201 | 7,162 | 84.3% | 2.5% | 5.5% | 3.0% |
| 92 | Big Rapids, MI | 7,847 | 7,187 | 84.4% | 6.1% | 5.2% | 0.9% |
| 93 | Trenton, MI | 18,242 | 7,289 | 84.9% | 3.3% | 6.2% | 0.7% |
| 94 | Tecumseh, MI | 8,655 | 7,396 | 85.6% | 1.4% | 6.4% | 0.9% |
| 95 | Greenville, MI | 8,897 | 7,435 | 85.7% | 0.3% | 8.8% | 0.3% |
| 96 | Berkley, MI | 15,084 | 7,441 | 85.9% | 2.0% | 3.4% | 0.9% |
| 97 | Highland Park, MI | 8,798 | 7,452 | 9.2% | 85.8% | 1.1% | 0.1% |
| 98 | Flushing, MI | 8,323 | 7,454 | 86.0% | 3.8% | 3.1% | 0.2% |
| 99 | Manistee, MI | 6,275 | 7,516 | 86.4% | 2.3% | 4.8% | 0.3% |
| 100 | Saline, MI | 8,976 | 7,517 | 86.4% | 1.1% | 4.2% | 3.6% |