Racial diversity in Michigan is a mixed bag.
There are parts of Michigan where there’s a high level of diversity. But where will you find the most diverse places in Michigan?
To answer that question, we went to the US Census data. Using Saturday Night Science, we measured the Gini coefficient for all 153 cities in Michigan to rank them from most to least diverse.
#1 most diverse in Michigan
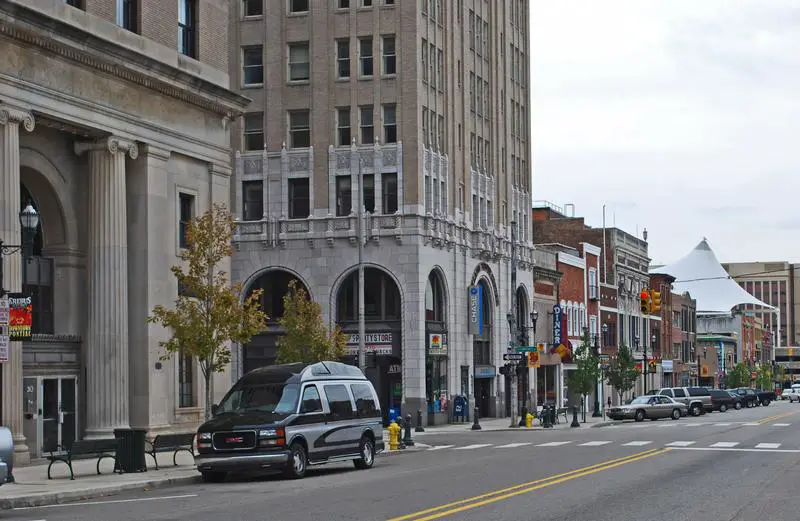
Pontiac is a city in the U.S. state of Michigan, located near Metro Detroit. As of the 2010 census, the city had a total population of 59,515. It is the county seat of Oakland County, and about 12 miles north and slightly west of the Detroit city limits.
Data | Crime | Cost of living | Movers
#2 most diverse in Michigan
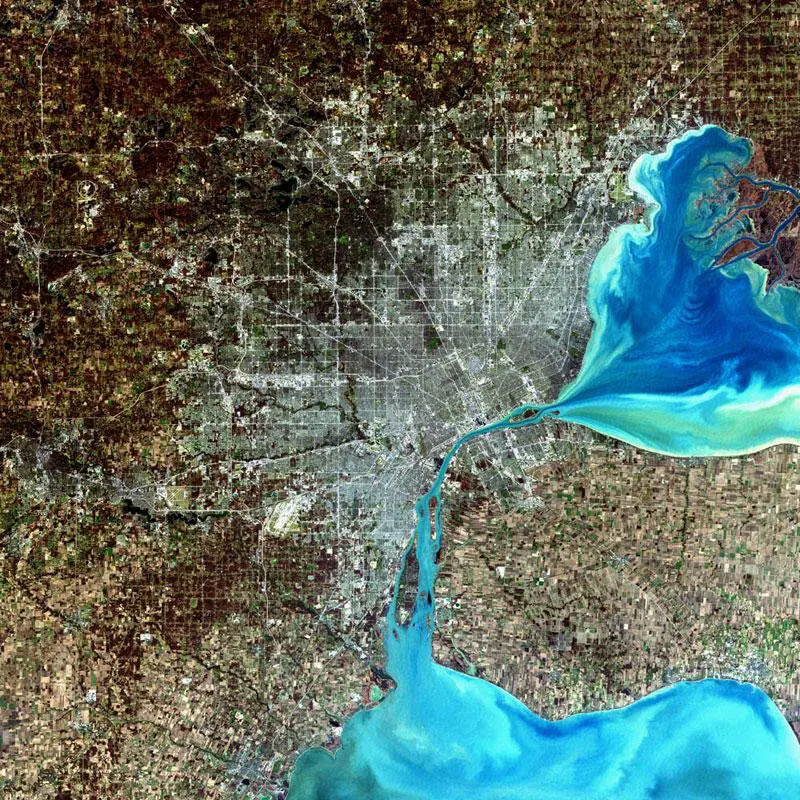
Ecorse is a city in Wayne County in the U.S. state of Michigan, named for the Ecorse River. The population was 9,512 at the 2010 census.
Data | Crime | Cost of living | Movers
#3 most diverse in Michigan
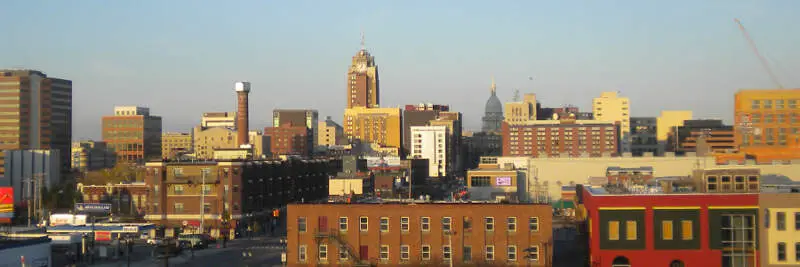
Lansing is the capital of the U.S. state of Michigan. It is mostly in Ingham County, although portions of the city extend west into Eaton County and north into Clinton County. The 2010 Census placed the city’s population at 114,297, making it the fifth largest city in Michigan. The population of its Metropolitan Statistical Area was 464,036, while the even larger Combined Statistical Area population, which includes Shiawassee County, was 534,684. It was named the new state capital of Michigan in 1847, ten years after Michigan became a state.
Data | Crime | Cost of living | Movers
#4 most diverse in Michigan
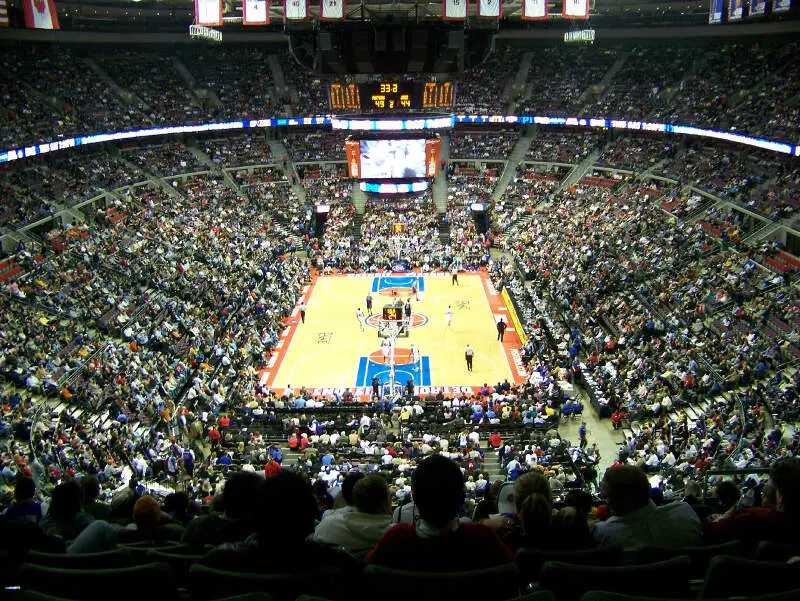
Auburn Hills is a city in Oakland County, in the U.S. state of Michigan. The population was 21,412 at the 2010 census. It is home to the world headquarters of Chrysler, The Palace of Auburn Hills, and Oakland University.
Data | Crime | Cost of living | Movers
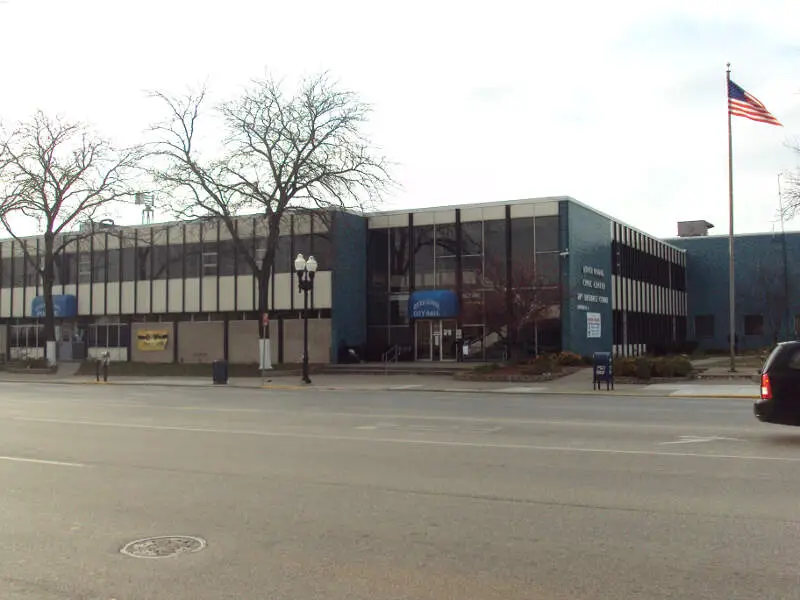
#5 most diverse in Michigan
River Rouge is a city in Wayne County in the U.S. state of Michigan and an industrial Downriver suburb of Detroit. The population was 7,903 at the 2010 census. It is named after the River Rouge, which flows along the city’s northern border and into the Detroit River. The city includes the heavily industrialized Zug Island at the mouth of the River Rouge.
Data | Crime | Cost of living | Movers
#6 most diverse in Michigan
Kentwood is a city in Kent County in the U.S. state of Michigan. The population was 48,707 at the 2010 census.
Data | Crime | Cost of living | Movers
#7 most diverse in Michigan
Saginaw is a city in the U.S. state of Michigan and the seat of Saginaw County. The city of Saginaw and Saginaw County are both located in the area known as Mid-Michigan or Central Michigan. The city of Saginaw is located adjacent to Saginaw Charter Township and is considered part of the Tri-City area, along with neighboring Bay City and Midland. The Saginaw County MSA had a population of 196,542 in 2013. The city is also the largest municipality within the Saginaw, Midland, and Bay City Metropolitan Area.
Data | Crime | Cost of living | Movers
#8 most diverse in Michigan
Center Line is a city in Macomb County in the U.S. state of Michigan, surrounded entirely by the city of Warren. The population was 8,257 at the 2010 census.
Data | Crime | Cost of living | Movers
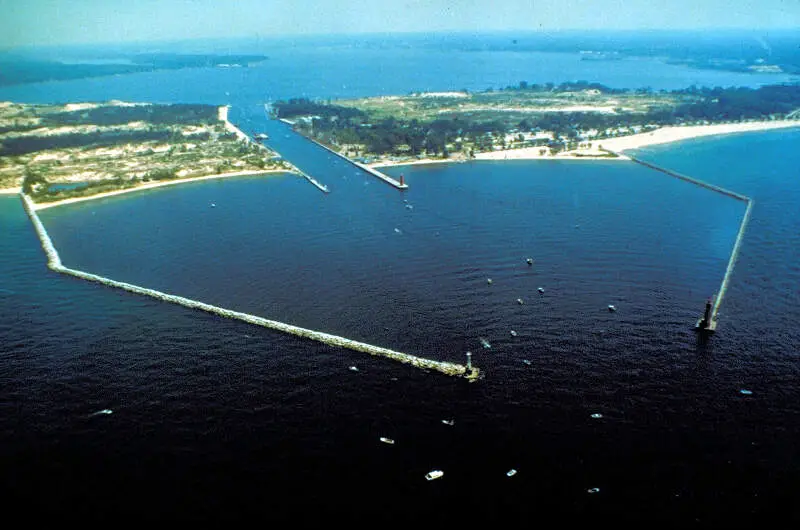
#9 most diverse in Michigan
Muskegon is a city in the U.S. state of Michigan, and is the largest populated city on the eastern shores of Lake Michigan. At the 2010 census the city population was 38,401. The city is the county seat of Muskegon County. It is located at the southwest corner of Muskegon Township, but is administratively autonomous.
Data | Crime | Cost of living | Movers
#10 most diverse in Michigan
Ypsilanti, commonly shortened to Ypsi, is a city in Washtenaw County in the U.S. state of Michigan, perhaps best known as the home of Eastern Michigan University. As of the 2017 census, the city’s population was 21,018. The city is bounded to the north by Superior Township and on the west, south, and east by Ypsilanti Township. Ypsilanti is located 6 miles east of Ann Arbor and about 18 miles west of the Detroit city limits.
Data | Crime | Cost of living | Movers
The receipts
Compare the top ten
Pick a metric. The bars rescale. The red line is Michigan’s statewide median.
On the map
Where diversity lives in Michigan
Saturday Night Science
Methodology: How we determined the most diverse cities in Michigan for 2026
We still believe in the accuracy of data — especially from the Census — and Saturday Night Science. So that’s where we went to get the race breakdown across Michigan.
That leads us to the Census’s most recently available data, the 2020-2024 American Community Survey data from the US Census.
Specifically, we looked at table B03002: HISPANIC OR LATINO ORIGIN BY RACE. Here are the category names as defined by the Census:
- White alone*
- Black or African American alone*
- American Indian and Alaska Native alone*
- Asian alone*
- Native Hawaiian and Other Pacific Islander alone*
- Some other race alone*
- Two or more races*
- Hispanic or Latino
We limited our analysis to non-CDPs with a population greater than 5,000 people. That left us with 153 cities.
We then calculated the HHI for each city by finding the racial breakdown of a city in percent terms, squaring them, and then adding the squares together. This left us with scores ranging from 2,899 (Pontiac) to 9,168 (Chelsea).
Finally, we ranked each city based on the HHI, with a lower score being more diverse than a high score. Pontiac took the distinction of being the most diverse, while Chelsea was the least diverse city.
We updated this article for 2026. This report is our eleventh time ranking the most diverse places in Michigan.
The full plate
Race By City In Michigan For 2026
Click any column to sort. Search by city name.
| Rank | City | Population | HHI | % White | % Black | % Hispanic | % Asian |
|---|---|---|---|---|---|---|---|
| 1 | Pontiac | 62,104 | 2,899 | 22.8% | 41.7% | 24.1% | 4.2% |
| 2 | Ecorse | 9,064 | 3,288 | 25.8% | 48.3% | 15.5% | 0.0% |
| 3 | Lansing | 113,023 | 3,301 | 50.6% | 21.9% | 12.9% | 5.3% |
| 4 | Auburn Hills | 25,105 | 3,321 | 52.1% | 15.3% | 12.4% | 13.5% |
| 5 | River Rouge | 7,008 | 3,387 | 31.4% | 45.5% | 17.0% | 0.0% |
| 6 | Kentwood | 54,296 | 3,431 | 52.3% | 21.5% | 10.3% | 9.9% |
| 7 | Saginaw | 43,536 | 3,438 | 34.7% | 44.3% | 15.9% | 0.2% |
| 8 | Center Line | 8,463 | 3,565 | 48.9% | 31.6% | 1.4% | 12.1% |
| 9 | Muskegon | 37,226 | 3,725 | 52.3% | 28.9% | 9.9% | 0.6% |
| 10 | Ypsilanti | 19,857 | 3,726 | 54.9% | 23.9% | 9.0% | 5.1% |
| 11 | Grand Rapids | 198,535 | 3,910 | 57.5% | 17.5% | 16.3% | 2.8% |
| 12 | Novi | 66,717 | 3,928 | 55.2% | 7.4% | 4.5% | 28.1% |
| 13 | Romulus | 24,831 | 3,996 | 43.9% | 44.5% | 1.6% | 0.2% |
| 14 | Warren | 137,928 | 4,024 | 58.0% | 21.8% | 2.4% | 12.7% |
| 15 | Lincoln Park | 39,257 | 4,028 | 56.7% | 10.2% | 26.2% | 0.6% |
| 16 | Farmington Hills | 83,515 | 4,069 | 59.3% | 18.2% | 2.6% | 13.7% |
| 17 | Oak Park | 29,318 | 4,094 | 36.1% | 52.5% | 1.8% | 2.7% |
| 18 | Wyoming | 77,353 | 4,126 | 57.6% | 9.0% | 26.5% | 1.8% |
| 19 | Albion | 7,560 | 4,137 | 55.7% | 31.0% | 7.3% | 1.0% |
| 20 | Hamtramck | 27,743 | 4,158 | 58.6% | 6.1% | 0.8% | 25.3% |
| 21 | Farmington | 11,504 | 4,183 | 59.3% | 6.7% | 3.7% | 23.9% |
| 22 | Kalamazoo | 73,076 | 4,212 | 60.0% | 22.3% | 7.8% | 3.0% |
| 23 | Flint | 80,175 | 4,225 | 33.4% | 55.3% | 4.5% | 0.7% |
| 24 | Battle Creek | 52,374 | 4,251 | 62.0% | 15.6% | 8.3% | 4.9% |
| 25 | Westland | 83,633 | 4,254 | 60.1% | 23.6% | 4.8% | 3.9% |
| 26 | Melvindale | 12,554 | 4,268 | 58.7% | 10.2% | 26.5% | 0.0% |
| 27 | St. Louis | 7,367 | 4,331 | 58.6% | 28.6% | 8.4% | 0.1% |
| 28 | Eastpointe | 33,982 | 4,345 | 35.5% | 55.1% | 1.6% | 0.7% |
| 29 | Jackson | 31,058 | 4,505 | 63.2% | 19.0% | 6.8% | 0.5% |
| 30 | Troy | 87,898 | 4,527 | 61.0% | 3.7% | 2.6% | 27.8% |
| 31 | Wayne | 17,310 | 4,658 | 63.2% | 24.7% | 3.8% | 1.3% |
| 32 | Ann Arbor | 122,036 | 4,759 | 66.5% | 6.4% | 5.5% | 15.6% |
| 33 | Mount Clemens | 15,511 | 4,768 | 65.2% | 20.0% | 4.0% | 0.3% |
| 34 | Taylor | 62,081 | 4,769 | 65.7% | 18.9% | 7.6% | 2.2% |
| 35 | Harper Woods | 15,116 | 4,778 | 29.2% | 62.4% | 2.2% | 0.6% |
| 36 | Springfield | 5,269 | 4,814 | 67.1% | 4.6% | 5.7% | 7.5% |
| 37 | Sturgis | 11,054 | 4,826 | 63.7% | 1.8% | 27.3% | 1.6% |
| 38 | Holland | 34,423 | 4,829 | 65.1% | 4.1% | 23.6% | 3.4% |
| 39 | Southfield | 76,236 | 4,839 | 24.5% | 64.7% | 1.7% | 2.0% |
| 40 | Wixom | 17,295 | 4,867 | 67.7% | 12.4% | 4.3% | 9.1% |
| 41 | Roseville | 47,123 | 4,869 | 65.1% | 24.4% | 3.4% | 1.6% |
| 42 | Sault Ste. Marie | 13,335 | 5,051 | 68.4% | 0.5% | 1.9% | 1.2% |
| 43 | Inkster | 25,428 | 5,295 | 16.8% | 70.3% | 3.7% | 1.4% |
| 44 | East Lansing | 45,758 | 5,312 | 71.5% | 7.6% | 6.6% | 8.9% |
| 45 | New Haven | 6,475 | 5,322 | 70.2% | 16.6% | 2.1% | 0.7% |
| 46 | Rochester Hills | 77,089 | 5,365 | 71.3% | 3.5% | 5.1% | 14.5% |
| 47 | Muskegon Heights | 9,841 | 5,378 | 17.7% | 70.8% | 4.6% | 0.3% |
| 48 | Ionia | 12,753 | 5,396 | 71.6% | 12.5% | 9.0% | 0.0% |
| 49 | Adrian | 20,395 | 5,494 | 71.0% | 4.3% | 20.7% | 0.3% |
| 50 | Hazel Park | 14,963 | 5,604 | 73.4% | 11.0% | 5.3% | 1.1% |
| 51 | Niles | 11,803 | 5,759 | 74.2% | 13.8% | 7.0% | 0.5% |
| 52 | Dowagiac | 5,732 | 5,788 | 74.9% | 8.0% | 9.2% | 0.4% |
| 53 | Allen Park | 27,925 | 5,817 | 74.8% | 5.8% | 13.1% | 1.3% |
| 54 | Detroit | 638,530 | 5,820 | 10.8% | 75.0% | 8.3% | 1.7% |
| 55 | Sterling Heights | 133,573 | 5,963 | 76.2% | 7.4% | 3.0% | 9.2% |
| 56 | Southgate | 29,366 | 5,966 | 76.1% | 8.0% | 9.4% | 2.4% |
| 57 | Woodhaven | 12,690 | 6,019 | 76.4% | 7.0% | 11.1% | 1.8% |
| 58 | Lapeer | 9,082 | 6,066 | 76.8% | 8.3% | 5.6% | 0.7% |
| 59 | Burton | 29,500 | 6,070 | 76.7% | 10.6% | 4.0% | 0.3% |
| 60 | Three Rivers | 7,943 | 6,198 | 77.8% | 8.0% | 6.7% | 0.6% |
| 61 | Riverview | 12,186 | 6,205 | 77.7% | 8.1% | 9.2% | 1.3% |
| 62 | Mount Pleasant | 21,236 | 6,216 | 78.2% | 5.1% | 6.3% | 3.6% |
| 63 | Madison Heights | 28,419 | 6,236 | 78.2% | 7.8% | 2.2% | 6.5% |
| 64 | Flat Rock | 10,340 | 6,271 | 78.3% | 8.0% | 7.4% | 0.1% |
| 65 | Grand Blanc | 7,987 | 6,303 | 78.5% | 8.6% | 6.1% | 2.1% |
| 66 | Houghton | 8,474 | 6,348 | 79.0% | 2.7% | 2.9% | 9.1% |
| 67 | Port Huron | 28,620 | 6,366 | 79.0% | 6.4% | 6.3% | 0.9% |
| 68 | Portage | 49,259 | 6,428 | 79.5% | 6.2% | 5.6% | 3.4% |
| 69 | Fraser | 14,583 | 6,452 | 79.4% | 10.0% | 2.6% | 1.7% |
| 70 | Garden City | 26,739 | 6,473 | 79.7% | 6.6% | 6.4% | 1.3% |
| 71 | Ferndale | 19,190 | 6,492 | 80.0% | 6.4% | 4.7% | 3.0% |
| 72 | Dearborn Heights | 61,771 | 6,534 | 80.0% | 9.9% | 5.5% | 1.0% |
| 73 | Royal Oak | 57,950 | 6,543 | 80.3% | 6.0% | 4.6% | 3.5% |
| 74 | Rochester | 12,934 | 6,560 | 80.3% | 3.9% | 1.8% | 8.0% |
| 75 | Bay City | 32,320 | 6,576 | 80.1% | 1.6% | 11.5% | 0.8% |
| 76 | Grandville | 16,356 | 6,588 | 80.5% | 7.2% | 6.0% | 1.5% |
| 77 | Grosse Pointe Park | 11,319 | 6,705 | 81.4% | 5.2% | 3.0% | 3.9% |
| 78 | Zeeland | 5,665 | 6,742 | 80.5% | 2.1% | 16.1% | 0.0% |
| 79 | Benton Harbor | 8,953 | 6,758 | 8.3% | 81.5% | 5.8% | 0.0% |
| 80 | Walker | 25,386 | 6,771 | 81.8% | 3.4% | 6.2% | 4.0% |
| 81 | Alma | 9,396 | 6,791 | 81.3% | 1.9% | 12.9% | 1.6% |
| 82 | Belding | 5,960 | 6,803 | 81.8% | 2.9% | 8.1% | 0.4% |
| 83 | Livonia | 93,851 | 6,838 | 82.2% | 4.3% | 4.4% | 4.0% |
| 84 | Beverly Hills | 10,524 | 6,847 | 82.2% | 6.2% | 2.8% | 3.4% |
| 85 | Utica | 5,180 | 6,888 | 82.6% | 3.4% | 5.3% | 4.5% |
| 86 | Highland Park | 8,628 | 6,911 | 11.2% | 82.2% | 1.7% | 0.1% |
| 87 | Coldwater | 13,671 | 6,920 | 82.6% | 4.5% | 7.6% | 0.3% |
| 88 | Walled Lake | 7,299 | 6,937 | 82.7% | 3.2% | 3.4% | 9.0% |
| 89 | Monroe | 20,320 | 6,940 | 82.7% | 7.5% | 2.7% | 0.5% |
| 90 | Wyandotte | 24,489 | 7,008 | 83.2% | 2.1% | 7.9% | 0.7% |
| 91 | Birmingham | 21,763 | 7,060 | 83.6% | 2.8% | 4.4% | 4.9% |
| 92 | St. Joseph | 7,986 | 7,070 | 83.7% | 4.5% | 5.2% | 1.7% |
| 93 | Mason | 8,249 | 7,190 | 84.3% | 6.4% | 3.9% | 0.5% |
| 94 | Clawson | 11,374 | 7,252 | 84.8% | 3.7% | 4.5% | 2.6% |
| 95 | Berkley | 15,149 | 7,286 | 85.0% | 2.2% | 3.8% | 1.0% |
| 96 | Holly | 5,964 | 7,359 | 85.4% | 3.1% | 5.1% | 0.3% |
| 97 | Grand Haven | 10,996 | 7,379 | 85.5% | 1.0% | 5.9% | 2.1% |
| 98 | Manistee | 6,275 | 7,470 | 86.1% | 1.8% | 5.5% | 0.4% |
| 99 | Milan | 5,987 | 7,479 | 86.1% | 1.8% | 5.5% | 0.2% |
| 100 | Tecumseh | 8,646 | 7,483 | 86.1% | 1.2% | 7.2% | 0.8% |
Source: U.S. Census ACS 2020-2024. 153 cities with more than 5,000 residents.
Summary
Summary: Diversity Across Michigan
If you’re looking for a scientific breakdown of diversity across Michigan, this is an accurate list.
The most diverse cities in Michigan are Pontiac, Ecorse, Lansing, Auburn Hills, River Rouge, Kentwood, Saginaw, Center Line, Muskegon, and Ypsilanti. Not sold on Michigan? Take the two-minute Find Your Place quiz and see which state actually fits you.
Questions and answers
Most Diverse Cities In Michigan FAQs
What is the most diverse city in Michigan?
Pontiac is the most diverse city in Michigan for 2026, posting the lowest diversity index (2,899) of the 153 places we measured. Ecorse and Lansing are next.
What are the 10 most diverse cities in Michigan?
The ten most diverse cities in Michigan are Pontiac, Ecorse, Lansing, Auburn Hills, River Rouge, Kentwood, Saginaw, Center Line, Muskegon, and Ypsilanti. We ranked all 153 places with more than 5,000 residents by their racial-diversity HHI.
How do you measure diversity?
We use a Herfindahl-Hirschman Index (HHI) across each city’s White, Black, Hispanic, and Asian population shares from the Census American Community Survey. A lower score means the mix is more even, so the lowest HHI wins.
What is the least diverse city in Michigan?
Chelsea is the least diverse city in Michigan, with a diversity index of 9,168. That means one group makes up most of its population.
Where does this data come from?
All population shares come from the Census Bureau’s American Community Survey (2020-2024). Diversity scores in Michigan range from 2,899 in Pontiac to 9,168 in Chelsea.


