
Most Native American places in Michigan research summary. We used Saturday Night Science to research the Michigan cities with the highest percentage of Native American residents for 2026. The data comes from the American Community Survey 2020-2024 vintage, which breaks down race by origin.
-
The city with the highest percentage of Native Americans is Sault Ste. Marie. 13.90% of people in Sault Ste. Marie are Native Americans.
-
The city with the lowest percentage of Native Americans is Zeeland. 0.00% of people in Zeeland are Native American.
-
The city with the most Native Americans is Sault Ste. Marie. 1,853 people in Sault Ste. Marie are Native American.
-
The city with the fewest Native Americans is Zeeland. 0 people in Zeeland are Native American.
-
The United States has 1,698,432 Native Americans and is 0.51% Native American.
Table Of Contents: Top Ten | Methodology | Summary | Table
The 10 Cities In Michigan With The Largest Native American Population For 2026
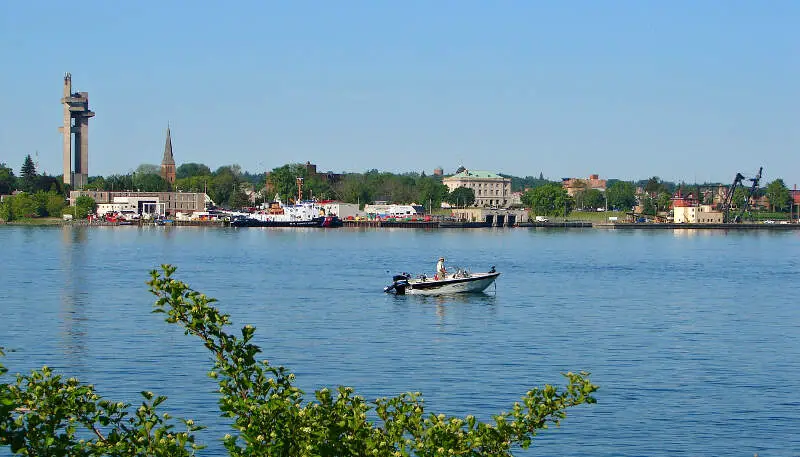
Which city in Michigan had the largest Native American population? The place with the largest Native American population in Michigan for 2026 is Sault Ste. Marie. 13.90 of Sault Ste. Marie identify as Native American.
To see where Michigan ranked as a state on diversity, we have a ranking of the most diverse states in America.
And if you already knew these places were Native American, check out the best places to live in Michigan or the most diverse places in Michigan.
Read below to see how we crunched the numbers and how your town ranked.
Cities In Michigan With The Largest Native American Population For 2026

/10
Population: 13,335
# Of Native American Residents: 1,853
% Native American: 13.9%
More on Sault Ste. Marie: Data | Crime | Cost Of Living | Movers

/10
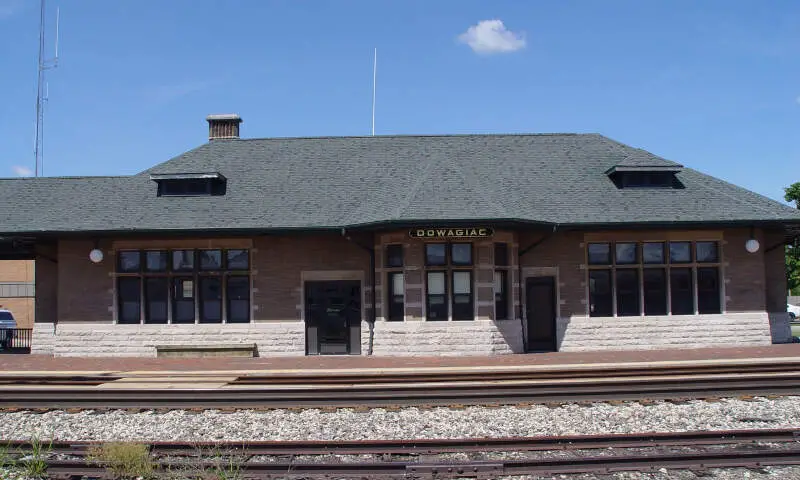
Population: 5,732
# Of Native American Residents: 113
% Native American: 1.97%
More on Dowagiac: Data | Crime | Cost Of Living | Movers

/10
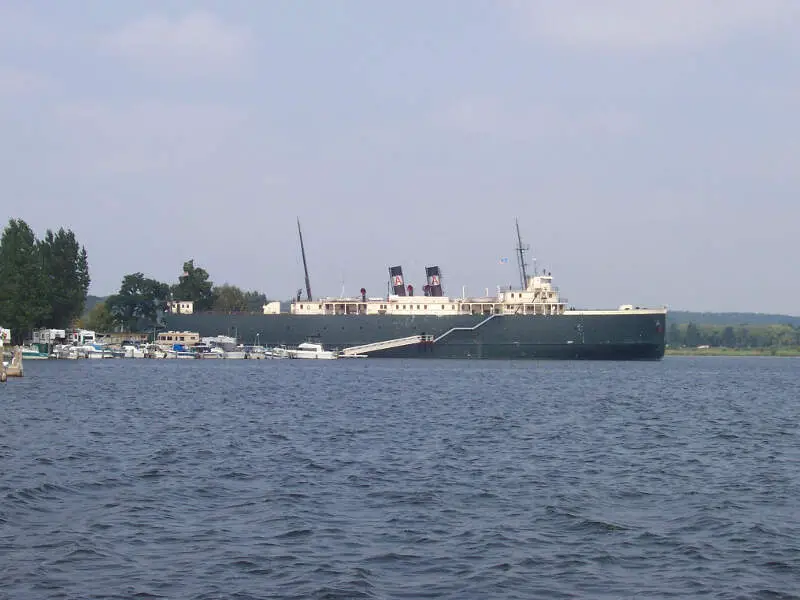
Population: 6,275
# Of Native American Residents: 118
% Native American: 1.88%
More on Manistee: Data | Crime | Cost Of Living | Movers

/10
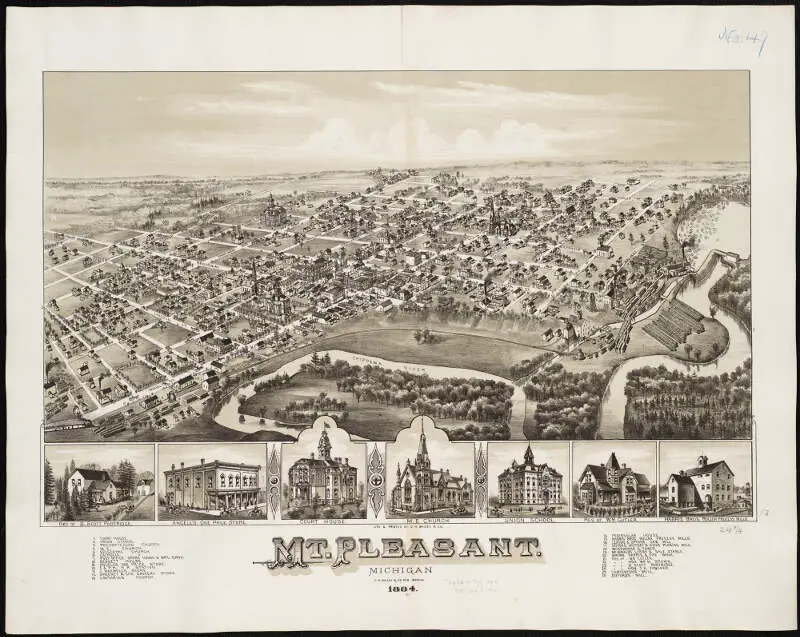
Population: 21,236
# Of Native American Residents: 313
% Native American: 1.47%
More on Mount Pleasant: Data | Crime | Cost Of Living | Movers

/10
Population: 9,841
# Of Native American Residents: 125
% Native American: 1.27%
More on Muskegon Heights: Data | Crime | Cost Of Living | Movers

/10
Population: 8,463
# Of Native American Residents: 106
% Native American: 1.25%
More on Center Line: Data | Crime | Cost Of Living | Movers

/10
Population: 8,474
# Of Native American Residents: 100
% Native American: 1.18%
More on Houghton: Data | Crime | Cost Of Living | Movers

/10
Population: 12,354
# Of Native American Residents: 143
% Native American: 1.16%
More on Escanaba: Data | Crime | Cost Of Living | Movers

/10
Population: 8,477
# Of Native American Residents: 98
% Native American: 1.16%
More on Big Rapids: Data | Crime | Cost Of Living | Movers

/10
Population: 9,064
# Of Native American Residents: 82
% Native American: 0.9%
More on Ecorse: Data | Crime | Cost Of Living | Movers
Methodology: How We Determined The Cities In Michigan With The Largest Native American Population For 2026
We still believe in the accuracy of data — especially from the Census. So that’s where we went to get the race breakdown across Michigan.
We used Saturday Night Science to analyze the Census’s most recently available data, the 2020-2024 American Community Survey data.
Specifically, we looked at table B03002: Hispanic OR LATINO ORIGIN BY RACE. Here are the category names as defined by the Census:
- Hispanic or Latino
- White alone*
- Black or African American alone*
- American Indian and Alaska Native alone*
- Asian alone*
- Native Hawaiian and Other Pacific Islander alone*
- Some other race alone*
- Two or more races*
Our particular column of interest here was the number of people identifying as American Indian and Alaska Native alone.
We limited our analysis to places with a population greater than 5,000 people. That left us with 147 cities.
We then calculated the percentage of residents that are American Indian and Alaska Native. The percentages ranked from 13.90 to 0.00.
Finally, we ranked each city based on the percentage of the American Indian and Alaska Native population, with a higher score being more American Indian and Alaska Native than a lower score. Sault Ste. Marie took the distinction of being the most American Indian and Alaska Native, while Zeeland was the least Native American city.
We updated this article for 2026. This article is our eleventh time ranking the cities in Michigan with the largest Native American population.
Summary: Native American Populations Across Michigan
If you’re looking for a breakdown of Native American populations across Michigan according to the most recent data, this is an accurate list.
The most Native American cities in Michigan are Sault Ste. Marie, Dowagiac, Manistee, Mount Pleasant, Muskegon Heights, Center Line, Houghton, Escanaba, Big Rapids, and Ecorse.
If you’re curious enough, here are the least Native American places in Michigan:
- Zeeland
- River Rouge
- Riverview
For more Michigan reading, check out:
- Best Places To Buy A House In Michigan
- Best Counties To Live In Michigan
- Best Places To Retire In Michigan
Most Native American Places In Michigan
| Rank | City | Population | Native American Population | % Native American |
|---|---|---|---|---|
| 1 | Sault Ste. Marie | 13,335 | 1,853 | 13.9% |
| 2 | Dowagiac | 5,732 | 113 | 1.97% |
| 3 | Manistee | 6,275 | 118 | 1.88% |
| 4 | Mount Pleasant | 21,236 | 313 | 1.47% |
| 5 | Muskegon Heights | 9,841 | 125 | 1.27% |
| 6 | Center Line | 8,463 | 106 | 1.25% |
| 7 | Houghton | 8,474 | 100 | 1.18% |
| 8 | Escanaba | 12,354 | 143 | 1.16% |
| 9 | Big Rapids | 8,477 | 98 | 1.16% |
| 10 | Ecorse | 9,064 | 82 | 0.9% |
| 11 | Iron Mountain | 7,518 | 68 | 0.9% |
| 12 | Springfield | 5,269 | 43 | 0.82% |
| 13 | Wayne | 17,310 | 128 | 0.74% |
| 14 | Marquette | 21,325 | 147 | 0.69% |
| 15 | St. Johns | 7,715 | 53 | 0.69% |
| 16 | Gladstone | 5,253 | 36 | 0.69% |
| 17 | Albion | 7,560 | 51 | 0.67% |
| 18 | Burton | 29,500 | 187 | 0.63% |
| 19 | Ionia | 12,753 | 75 | 0.59% |
| 20 | Kingsford | 5,124 | 28 | 0.55% |
| 21 | St. Louis | 7,367 | 39 | 0.53% |
| 22 | Belding | 5,960 | 31 | 0.52% |
| 23 | Flushing | 8,284 | 43 | 0.52% |
| 24 | Ludington | 7,676 | 39 | 0.51% |
| 25 | Ishpeming | 6,181 | 30 | 0.49% |
| 26 | Petoskey | 5,856 | 27 | 0.46% |
| 27 | Fraser | 14,583 | 64 | 0.44% |
| 28 | Woodhaven | 12,690 | 54 | 0.43% |
| 29 | Eaton Rapids | 5,183 | 22 | 0.42% |
| 30 | Muskegon | 37,226 | 158 | 0.42% |
| 31 | Grand Ledge | 7,804 | 31 | 0.4% |
| 32 | Hamtramck | 27,743 | 105 | 0.38% |
| 33 | Lapeer | 9,082 | 30 | 0.33% |
| 34 | Inkster | 25,428 | 82 | 0.32% |
| 35 | Lansing | 113,023 | 346 | 0.31% |
| 36 | Hastings | 7,520 | 23 | 0.31% |
| 37 | Westland | 83,633 | 242 | 0.29% |
| 38 | Owosso | 14,632 | 39 | 0.27% |
| 39 | Flint | 80,175 | 209 | 0.26% |
| 40 | Grand Rapids | 198,535 | 510 | 0.26% |
| 41 | Norton Shores | 25,041 | 63 | 0.25% |
| 42 | Garden City | 26,739 | 67 | 0.25% |
| 43 | Plymouth | 9,214 | 23 | 0.25% |
| 44 | Charlotte | 9,277 | 23 | 0.25% |
| 45 | Traverse City | 15,593 | 37 | 0.24% |
| 46 | Alma | 9,396 | 22 | 0.23% |
| 47 | Berkley | 15,149 | 35 | 0.23% |
| 48 | Ann Arbor | 122,036 | 277 | 0.23% |
| 49 | Port Huron | 28,620 | 63 | 0.22% |
| 50 | Pontiac | 62,104 | 125 | 0.2% |
| 51 | Novi | 66,717 | 134 | 0.2% |
| 52 | Howell | 10,021 | 20 | 0.2% |
| 53 | Portage | 49,259 | 95 | 0.19% |
| 54 | Farmington | 11,504 | 22 | 0.19% |
| 55 | Madison Heights | 28,419 | 51 | 0.18% |
| 56 | East Lansing | 45,758 | 81 | 0.18% |
| 57 | Three Rivers | 7,943 | 14 | 0.18% |
| 58 | St. Joseph | 7,986 | 14 | 0.18% |
| 59 | Mount Clemens | 15,511 | 27 | 0.17% |
| 60 | Detroit | 638,530 | 1,069 | 0.17% |
| 61 | Troy | 87,898 | 146 | 0.17% |
| 62 | Walker | 25,386 | 40 | 0.16% |
| 63 | Greenville | 8,995 | 14 | 0.16% |
| 64 | Wyandotte | 24,489 | 38 | 0.16% |
| 65 | Flat Rock | 10,340 | 16 | 0.15% |
| 66 | Kalamazoo | 73,076 | 113 | 0.15% |
| 67 | Highland Park | 8,628 | 13 | 0.15% |
| 68 | Battle Creek | 52,374 | 78 | 0.15% |
| 69 | Bay City | 32,320 | 47 | 0.15% |
| 70 | Romulus | 24,831 | 35 | 0.14% |
| 71 | Saline | 9,006 | 12 | 0.13% |
| 72 | Marshall | 6,804 | 9 | 0.13% |
| 73 | Warren | 137,928 | 181 | 0.13% |
| 74 | Holland | 34,423 | 45 | 0.13% |
| 75 | Kentwood | 54,296 | 68 | 0.13% |
| 76 | Sterling Heights | 133,573 | 162 | 0.12% |
| 77 | Grosse Pointe Farms | 9,904 | 12 | 0.12% |
| 78 | Ypsilanti | 19,857 | 23 | 0.12% |
| 79 | Northville | 6,069 | 7 | 0.12% |
| 80 | Roseville | 47,123 | 54 | 0.11% |
| 81 | Rochester Hills | 77,089 | 88 | 0.11% |
| 82 | Farmington Hills | 83,515 | 94 | 0.11% |
| 83 | Menominee | 8,326 | 9 | 0.11% |
| 84 | Harper Woods | 15,116 | 16 | 0.11% |
| 85 | Taylor | 62,081 | 65 | 0.1% |
| 86 | Jackson | 31,058 | 30 | 0.1% |
| 87 | Cadillac | 10,445 | 10 | 0.1% |
| 88 | Wixom | 17,295 | 16 | 0.09% |
| 89 | Brighton | 7,688 | 7 | 0.09% |
| 90 | St. Clair Shores | 58,140 | 50 | 0.09% |
| 91 | Rochester | 12,934 | 11 | 0.09% |
| 92 | Monroe | 20,320 | 17 | 0.08% |
| 93 | Oak Park | 29,318 | 24 | 0.08% |
| 94 | Livonia | 93,851 | 76 | 0.08% |
| 95 | Alpena | 10,154 | 8 | 0.08% |
| 96 | Niles | 11,803 | 9 | 0.08% |
| 97 | Grandville | 16,356 | 12 | 0.07% |
| 98 | Lincoln Park | 39,257 | 28 | 0.07% |
| 99 | Wyoming | 77,353 | 54 | 0.07% |
| 100 | Saginaw | 43,536 | 29 | 0.07% |