
Suppose real estate is the most significant investment a majority of people make in their lifetime. In that case, it’s best to understand the places in Washington with best potential return on investment.
After working in real estate adjacent roles for over a decade, I had the hypothesis that the best place to buy for a return on investment would be up-and-coming cities. Smaller cities where crime might be high now, but people still move to.
To test my hypothesis, we are going to look at places in Washington that are growing faster than average, but where home prices are below average, and crime rates are higher than average.
In everyday terms, these might be “deals”. The best deal in Washington at the moment according to Saturday Night Science? That would be Black Diamond.
Table Of Contents: Top Ten | Methodology | Summary | Table
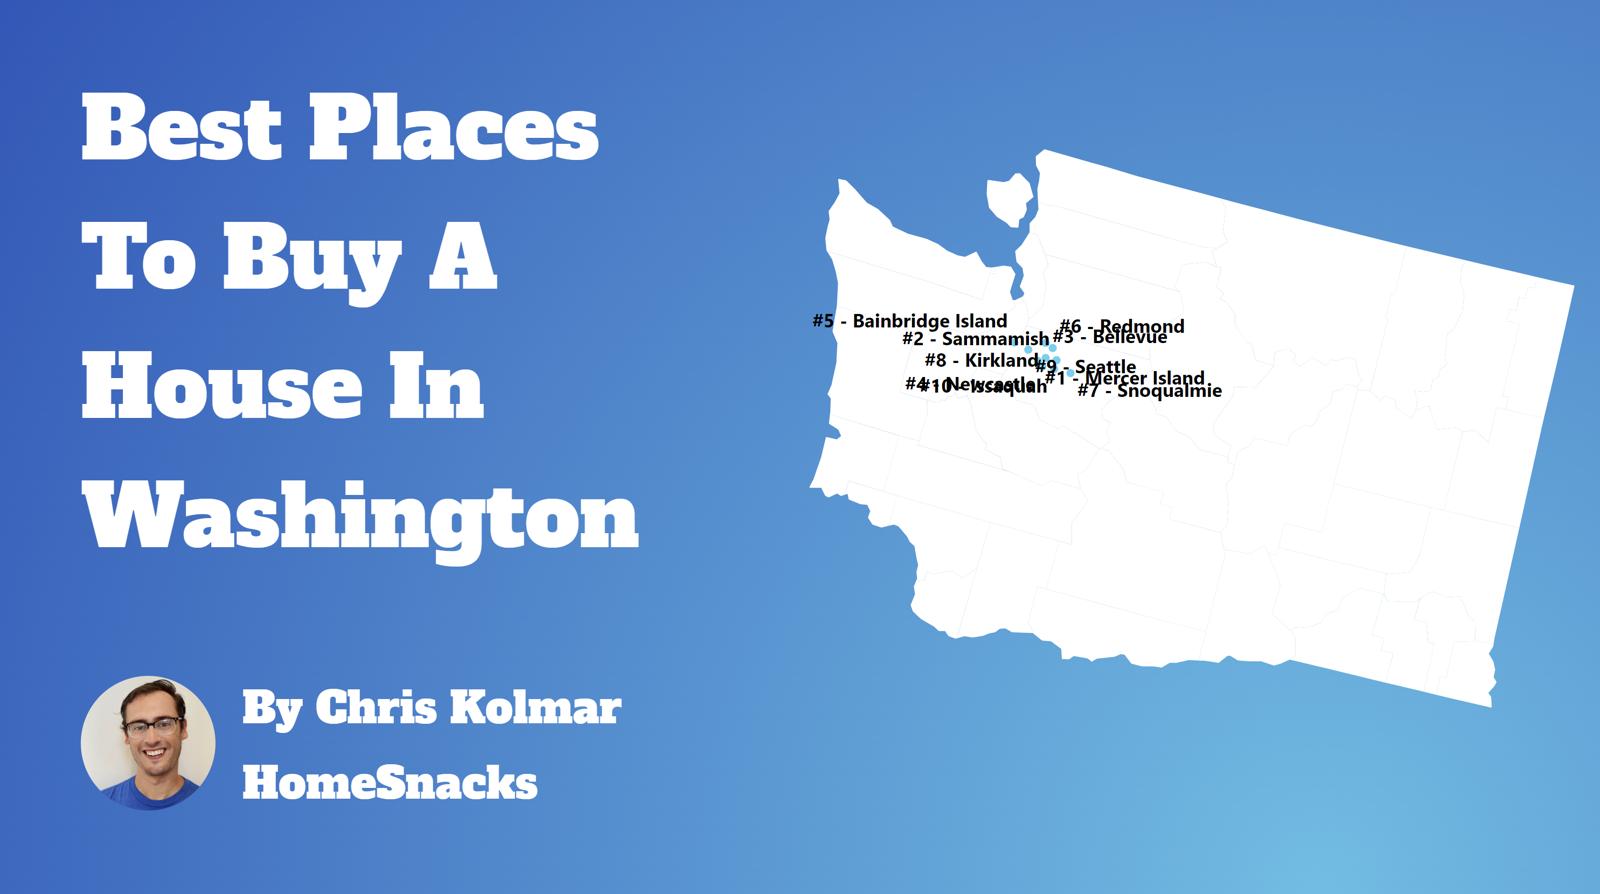
The 10 Best Places To Buy A Home In Washington For 2025
The methodology that wen’t into this can be a bit complicated, so we’ll break it down for you in as much detail as we can below.
For more Washington reading:
- Best Counties To Live In Washington
- Best Places To Raise A Family In Washington
- Best Places To Retire In Washington
The 10 Best Cities To Buy A House In Washington For 2025
/10
Population: 5,678
Median Home Price: $776,400
Population Change: 6.8%
Home Price Change: 3.9%
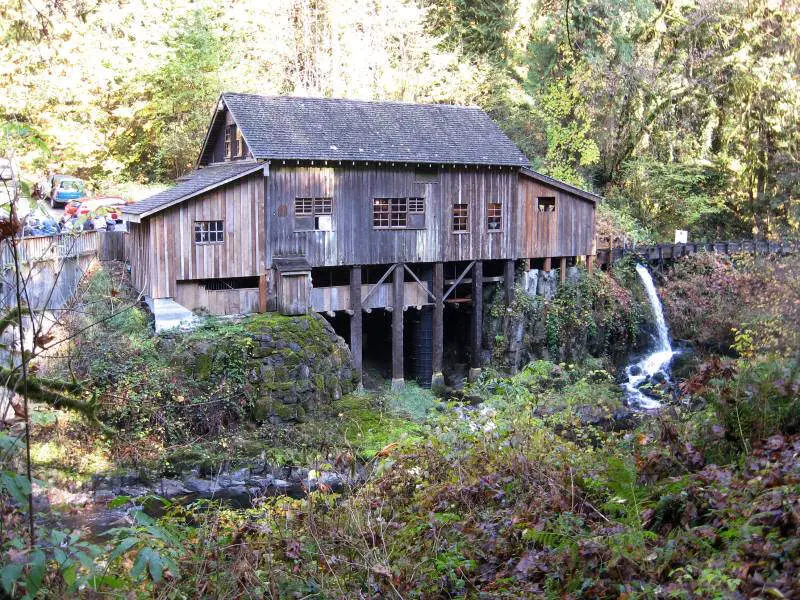
More on Black Diamond: Data
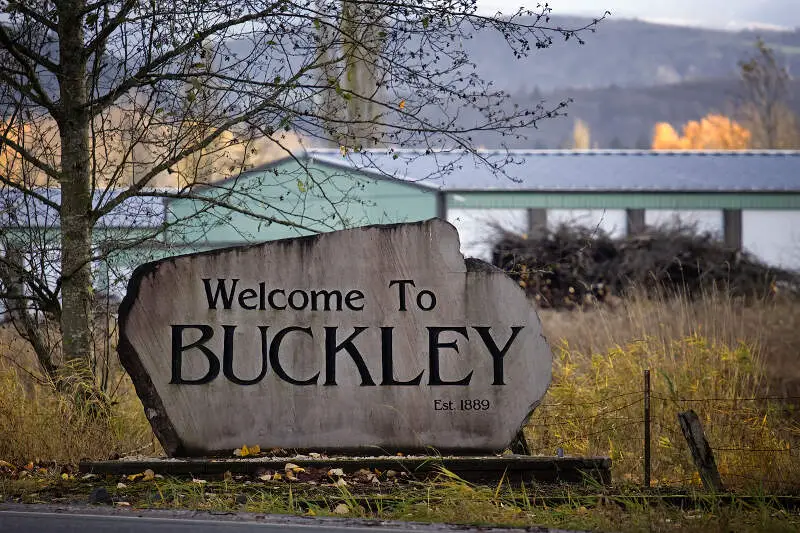
/10
Population: 5,306
Median Home Price: $506,400
Population Change: 2.2%
Home Price Change: 3.0%
More on Buckley: Data
/10
Population: 5,770
Median Home Price: $455,500
Population Change: 5.6%
Home Price Change: 21.1%
More on Sultan: Data
/10
Population: 5,982
Median Home Price: $500,600
Population Change: 2.0%
Home Price Change: 11.1%
More on Blaine: Data

/10
Population: 5,080
Median Home Price: $247,300
Population Change: -1.8%
Home Price Change: 23.0%
More on Connell: Data

/10
Population: 6,511
Median Home Price: $186,200
Population Change: -0.0%
Home Price Change: 15.2%
More on Union Gap: Data

/10
Population: 7,076
Median Home Price: $378,000
Population Change: 3.5%
Home Price Change: 25.2%
More on Ocean Shores: Data

/10
Population: 6,513
Median Home Price: $384,100
Population Change: 0.8%
Home Price Change: 11.2%
More on Woodland: Data

/10
Population: 6,213
Median Home Price: $269,300
Population Change: 1.2%
Home Price Change: 6.7%
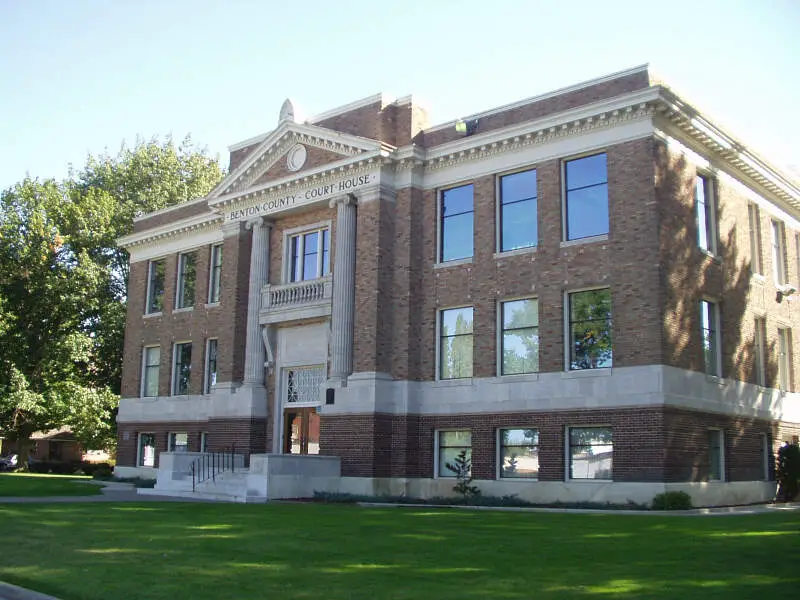
More on Prosser: Data

/10
Population: 6,683
Median Home Price: $594,600
Population Change: 0.0%
Home Price Change: 8.0%
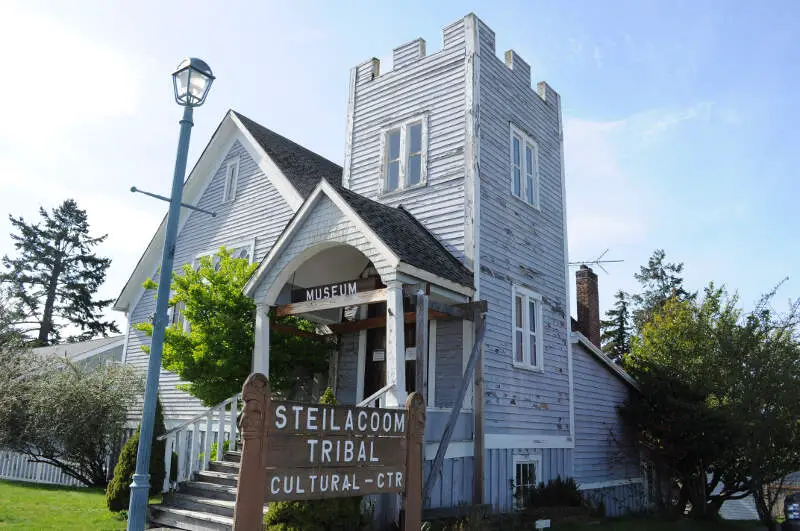
More on Steilacoom: Data
Methodology: How do you determine the best places to buy a home in Washington for 2025?
We were in real estate for almost five years and have worked on this site for another 10. Suffice it to say we’ve put a lot of thought into finding an excellent place to buy a home.
So all that thinking has come to this moment where we get to spell out how we’d approach finding an up-and-coming place to live in Washington. Put differently, the analysis will try to find places in Washington with undervalued homes relative to pent-up demand using Saturday Night Science.
To do that, we looked at the most recent American Community Survey Census data for 2019-2023 and compared it to the previous vintage. Specifically, we used the following criteria:
- Y-o-Y Change In Population (People want to live here)
- Y-o-Y Change In Median Home Prices (People are willing to pay for it)
- Home Prices Relative To The State Average (It’s still kinda cheap)
We want places that are growing, have seen home prices increase in recent years, and are still “cheap” for Washington with the following caveats:
- Home prices had to be within 20% of the state average (Much lower than that, and you get to some of the more dangerous places)
- Home prices increased in the last year, and
- Above 5,000 people (Bigger cities have more data points)
So of the 0 cities and towns in Washington, only 121 places made it through our initial filters to even be considered.
We then ranked each place from 1 to 121 for the above criteria, with 1 being the best. We averaged the rankings to create a “best place to buy” index, with the place having the lowest index being the best.
Turns out that Black Diamond is the best potential gem in the not-so-rough in the Evergreen State.
Summary: The Best Places To Purchase A House In Washington for 2025
There’s our analysis of the best places to buy a house in Washington. And, to be clear, we aren’t necessarily saying these places are the best places to live, just that it looks like they might be in a couple of years based on the data.
In fact, every place in the following table meets our criteria, so even though it may not look super long, remember we started off with all 0 places in the state.
The best cities to buy a house in Washington are Black Diamond, Buckley, Sultan, Blaine, Connell, Union Gap, Ocean Shores, Woodland, Prosser, and Steilacoom.
So if we’d could rent or buy in these cities, we’d definitely buy.
For more Washington reading, check out:
Best Places To Buy A Home In Washington
| Rank | City | Population | Median Home Price | Population Change | Home Price Increase |
|---|---|---|---|---|---|
| 1 | Black Diamond | 5,678 | $776,400 | 6.8% | 3.9% |
| 2 | Buckley | 5,306 | $506,400 | 2.2% | 3.0% |
| 3 | Sultan | 5,770 | $455,500 | 5.6% | 21.1% |
| 4 | Blaine | 5,982 | $500,600 | 2.0% | 11.1% |
| 5 | Connell | 5,080 | $247,300 | -1.8% | 23.0% |
| 6 | Union Gap | 6,511 | $186,200 | -0.0% | 15.2% |
| 7 | Ocean Shores | 7,076 | $378,000 | 3.5% | 25.2% |
| 8 | Woodland | 6,513 | $384,100 | 0.8% | 11.2% |
| 9 | Prosser | 6,213 | $269,300 | 1.2% | 6.7% |
| 10 | Steilacoom | 6,683 | $594,600 | 0.0% | 8.0% |
| 11 | Normandy Park | 6,659 | $943,500 | -0.6% | 8.3% |
| 12 | Fircrest | 7,082 | $554,600 | -0.2% | 15.7% |
| 13 | Brier | 6,507 | $824,500 | -0.5% | 4.2% |
| 14 | Pacific | 7,064 | $437,400 | -0.5% | 18.7% |
| 15 | North Bend | 7,745 | $933,700 | 2.6% | 7.3% |
| 16 | Stanwood | 8,351 | $547,400 | 3.7% | 12.6% |
| 17 | Clarkston | 7,240 | $216,900 | 0.2% | 12.4% |
| 18 | Sequim | 8,130 | $382,400 | 0.7% | 16.5% |
| 19 | Chehalis | 7,536 | $330,800 | 0.3% | 11.4% |
| 20 | Quincy | 7,922 | $283,900 | 2.2% | 19.9% |
| 21 | Selah | 8,301 | $366,100 | 1.2% | 14.3% |
| 22 | Duvall | 8,279 | $758,100 | 1.9% | 9.9% |
| 23 | Ephrata | 8,493 | $240,000 | 0.9% | 8.9% |
| 24 | Milton | 8,747 | $511,000 | 2.4% | 16.3% |
| 25 | Othello | 8,699 | $278,600 | 1.4% | 17.7% |
| 26 | Orting | 8,957 | $452,800 | 0.7% | 9.5% |
| 27 | Hoquiam | 8,792 | $196,400 | 0.6% | 20.7% |
| 28 | Ridgefield | 12,576 | $590,200 | 9.5% | 5.2% |
| 29 | Toppenish | 8,746 | $214,200 | -0.8% | 10.1% |
| 30 | Airway Heights | 10,766 | $286,900 | 1.9% | 19.6% |
| 31 | Burlington | 9,637 | $432,900 | 2.9% | 9.0% |
| 32 | Yelm | 10,618 | $439,100 | 1.7% | 14.9% |
| 33 | College Place | 9,828 | $335,000 | 0.3% | 13.7% |
| 34 | Dupont | 9,952 | $550,200 | -0.0% | 16.9% |
| 35 | Port Townsend | 10,290 | $502,500 | 1.3% | 12.1% |
| 36 | Snohomish | 10,177 | $599,600 | 0.4% | 13.3% |
| 37 | Sumner | 10,674 | $478,500 | 0.8% | 8.1% |
| 38 | Gig Harbor | 12,202 | $686,000 | 2.4% | 4.9% |
| 39 | Fife | 10,902 | $480,600 | 0.1% | 12.3% |
| 40 | Liberty Lake | 12,435 | $506,000 | 3.4% | 15.7% |
| 41 | Shelton | 10,619 | $296,100 | 1.3% | 9.1% |
| 42 | Poulsbo | 11,962 | $574,900 | 1.2% | 11.3% |
| 43 | Grandview | 11,042 | $232,500 | 1.1% | 21.1% |
| 44 | Sedro-Woolley | 12,633 | $390,200 | 1.3% | 8.0% |
| 45 | Edgewood | 12,683 | $664,000 | 2.3% | 10.0% |
| 46 | Enumclaw | 12,663 | $498,700 | 0.3% | 7.8% |
| 47 | Newcastle | 12,945 | $1,128,200 | 0.1% | 8.9% |
| 48 | Kelso | 12,697 | $302,300 | 0.3% | 16.3% |
| 49 | Cheney | 12,830 | $330,300 | -0.1% | 13.2% |
| 50 | Woodinville | 13,440 | $1,032,900 | 1.0% | 12.6% |
| 51 | Lake Forest Park | 13,356 | $928,700 | -0.8% | 6.2% |
| 52 | Snoqualmie | 13,750 | $919,300 | -0.1% | 7.9% |
| 53 | East Wenatchee | 14,114 | $414,000 | 0.3% | 10.7% |
| 54 | Port Orchard | 16,398 | $492,000 | 3.7% | 10.9% |
| 55 | Ferndale | 15,447 | $492,400 | 2.1% | 14.8% |
| 56 | Lynden | 16,025 | $546,400 | 1.9% | 14.2% |
| 57 | West Richland | 17,126 | $404,300 | 3.5% | 8.4% |
| 58 | Washougal | 16,945 | $492,100 | 0.7% | 7.9% |
| 59 | Aberdeen | 17,040 | $225,100 | 0.4% | 9.7% |
| 60 | Sunnyside | 16,329 | $207,200 | 0.0% | 13.5% |
| 61 | Anacortes | 17,837 | $647,700 | 1.0% | 9.6% |
| 62 | Centralia | 18,457 | $267,600 | 1.2% | 14.8% |
| 63 | Monroe | 19,696 | $594,300 | 0.3% | 15.1% |
| 64 | Arlington | 20,599 | $492,600 | 1.7% | 9.8% |
| 65 | Port Angeles | 20,087 | $324,800 | 0.4% | 10.6% |
| 66 | Tukwila | 21,479 | $462,800 | -0.4% | 3.8% |
| 67 | Ellensburg | 18,913 | $357,800 | -0.5% | 3.2% |
| 68 | Mill Creek | 20,846 | $836,300 | 0.2% | 7.6% |
| 69 | Battle Ground | 21,293 | $452,000 | 1.9% | 8.8% |
| 70 | Covington | 20,957 | $590,100 | 0.7% | 8.1% |
| 71 | Bonney Lake | 22,776 | $558,900 | 0.8% | 12.6% |
| 72 | Mountlake Terrace | 21,419 | $606,100 | 0.3% | 8.0% |
| 73 | Mukilteo | 21,312 | $830,000 | -0.2% | 9.1% |
| 74 | Kenmore | 23,594 | $869,800 | -0.1% | 8.3% |
| 75 | Oak Harbor | 24,396 | $421,700 | -0.3% | 10.7% |
| 76 | Tumwater | 26,519 | $438,000 | 3.5% | 3.8% |
| 77 | Moses Lake | 25,594 | $278,100 | 1.7% | 13.5% |
| 78 | Camas | 26,779 | $656,100 | 1.5% | 8.8% |
| 79 | Bainbridge Island | 24,607 | $1,076,200 | -0.3% | 9.2% |
| 80 | Mercer Island | 25,282 | $1,884,200 | -0.7% | 11.9% |
| 81 | Maple Valley | 28,121 | $672,000 | 0.8% | 8.0% |
| 82 | Seatac | 31,143 | $483,200 | 0.7% | 7.8% |
| 83 | Des Moines | 32,545 | $539,800 | -0.4% | 11.7% |
| 84 | Walla Walla | 33,766 | $356,600 | -0.2% | 13.4% |
| 85 | Lake Stevens | 39,500 | $593,900 | 1.8% | 15.0% |
| 86 | University Place | 34,850 | $578,100 | 0.4% | 13.4% |
| 87 | Pullman | 31,939 | $401,700 | -0.1% | 6.0% |
| 88 | Wenatchee | 35,502 | $391,200 | 0.4% | 11.1% |
| 89 | Mount Vernon | 35,312 | $429,300 | 0.5% | 11.4% |
| 90 | Longview | 37,836 | $339,000 | 0.3% | 10.4% |
| 91 | Lynnwood | 40,953 | $635,800 | 2.7% | 6.6% |
| 92 | Issaquah | 39,472 | $934,100 | 0.2% | 4.8% |
| 93 | Bremerton | 44,531 | $409,500 | 1.2% | 10.8% |
| 94 | Puyallup | 42,642 | $507,000 | 0.1% | 8.6% |
| 95 | Edmonds | 42,783 | $840,200 | 0.2% | 10.4% |
| 96 | Bothell | 48,610 | $871,300 | 1.4% | 9.3% |
| 97 | Lacey | 57,088 | $427,900 | 1.5% | 13.0% |
| 98 | Burien | 51,331 | $609,300 | -0.3% | 7.6% |
| 99 | Olympia | 55,583 | $457,900 | 0.8% | 11.8% |
| 100 | Shoreline | 59,280 | $759,400 | 1.0% | 6.7% |