

Gayest places in Pennsylvania research summary. We used Saturday Night Science to research the cities in Pennsylvania with the highest percent of same-sex households for 2026. The data comes from the American Community Survey 2020-2024 5-year vintage, which counts same-sex married spouses and same-sex unmarried partners at the city level.
5.6% gay households · #1 gayest in Pennsylvania
5.1% gay households · #2 gayest in Pennsylvania
Data | Movers
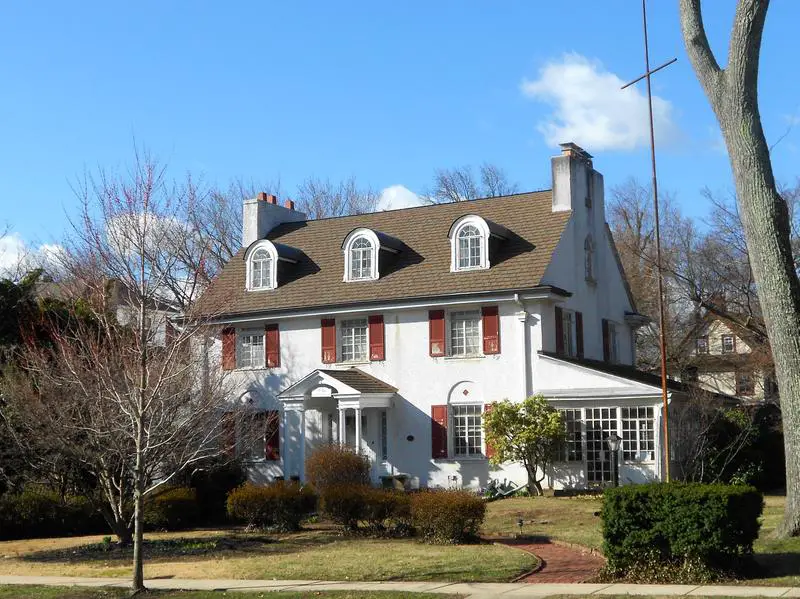
4.9% gay households · #3 gayest in Pennsylvania
 Located in
Delaware County, Pennsylvania
Located in
Delaware County, Pennsylvania
Ridley Park is a borough in Delaware County, Pennsylvania, United States. The population was 7,002 at the 2010 census. Ridley Park is the home of The Boeing Company’s CH-47 Chinook helicopter division.
Data | Crime | Cost of living | Movers
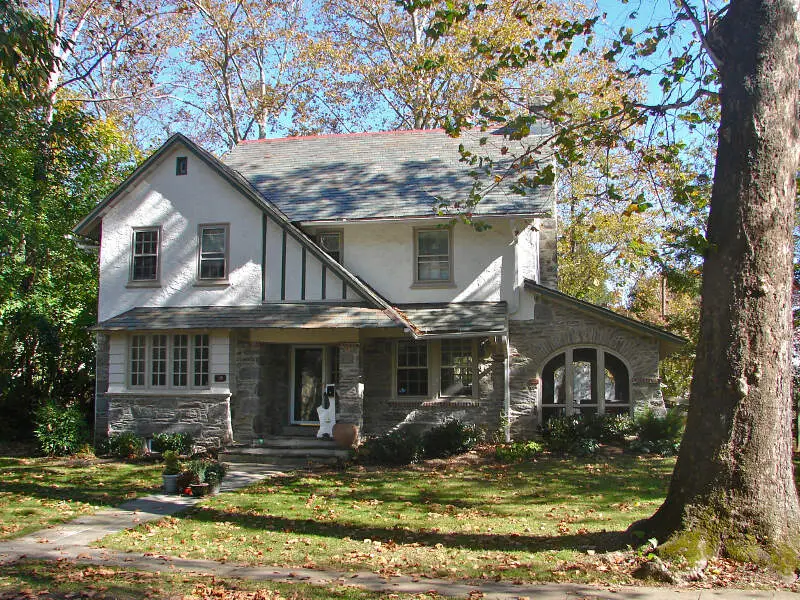
4.4% gay households · #4 gayest in Pennsylvania
Data | Crime | Cost of living | Movers
4.2% gay households · #5 gayest in Pennsylvania
Data | Movers
4.1% gay households · #6 gayest in Pennsylvania
4.0% gay households · #7 gayest in Pennsylvania
3.7% gay households · #8 gayest in Pennsylvania
3.7% gay households · #9 gayest in Pennsylvania
Data | Crime | Cost of living | Movers
3.4% gay households · #10 gayest in Pennsylvania
 Located in
Delaware County, Pennsylvania
Located in
Delaware County, Pennsylvania
Norwood is a borough in Delaware County, Pennsylvania, United States. The population was 5,890 at the 2010 census.
Data | Crime | Cost of living | Movers
The receipts
Compare the top ten
Pick a metric. The bars rescale. The red line is Pennsylvania’s statewide median.
On the map
Where Pennsylvania’s LGBTQ households are
Saturday Night Science
How we determined the gayest places in Pennsylvania for 2026
In order to rank the gayest cities in Pennsylvania, we used Saturday Night Science and the 2020-2024 American Community Survey 5-year estimates from the U.S. Census. We looked at:
- Percentage of all households that are unmarried, same-sex partners
We limited the analysis to non-CDPs that have over 1,000 households.
We ranked each place from 1 to 391 with the city containing the highest percentage of unmarried, same-sex partner households being the most gay.
In the end, North York ended up being the most gay place with 5.6% gay households.
Skip to the end to see the list of all the places in the state from gayest to straightest.
We updated this report for 2026. This report is our eleventh time ranking the gayest places in Pennsylvania.
The full plate
Gayest Places In Pennsylvania
Click any column to sort. Search by city name.
| Rank | City | Households | LGBTQ Households | % Gay Households |
|---|---|---|---|---|
| 1 | North York | 1,063 | 60 | 5.6% |
| 2 | Millvale | 1,646 | 84 | 5.1% |
| 3 | Ridley Park | 3,029 | 147 | 4.9% |
| 4 | Narberth | 2,001 | 89 | 4.4% |
| 5 | Myer | 1,300 | 54 | 4.2% |
| 6 | Seven Fields | 1,276 | 52 | 4.1% |
| 7 | Manchester | 1,157 | 46 | 4.0% |
| 8 | Southwest Greensburg | 1,058 | 39 | 3.7% |
| 9 | North Wales | 1,276 | 47 | 3.7% |
| 10 | Norwood | 2,203 | 75 | 3.4% |
| 11 | Swissvale | 4,352 | 146 | 3.4% |
| 12 | Carnegie | 4,217 | 141 | 3.3% |
| 13 | Larksville | 1,709 | 57 | 3.3% |
| 14 | Forty Fort | 1,844 | 61 | 3.3% |
| 15 | West Hazleton | 1,692 | 53 | 3.1% |
| 16 | Fleetwood | 1,700 | 53 | 3.1% |
| 17 | Selinsgrove | 1,584 | 45 | 2.8% |
| 18 | McKees Rocks | 2,713 | 74 | 2.7% |
| 19 | Mount Union | 1,068 | 29 | 2.7% |
| 20 | Tarentum | 2,020 | 54 | 2.7% |
| 21 | Kane | 1,528 | 40 | 2.6% |
| 22 | Steelton | 2,445 | 64 | 2.6% |
| 23 | Milton | 2,843 | 73 | 2.6% |
| 24 | Lansdale | 7,330 | 184 | 2.5% |
| 25 | Taylor | 2,368 | 59 | 2.5% |
| 26 | Middl | 4,674 | 115 | 2.5% |
| 27 | Edgewood | 1,504 | 37 | 2.5% |
| 28 | East Stroudsburg | 3,044 | 74 | 2.4% |
| 29 | Harrisburg | 22,137 | 538 | 2.4% |
| 30 | Marietta | 1,406 | 34 | 2.4% |
| 31 | Lewisburg | 1,825 | 43 | 2.4% |
| 32 | New Hope | 1,332 | 31 | 2.3% |
| 33 | Waynesburg | 1,427 | 33 | 2.3% |
| 34 | Mount Joy | 3,532 | 77 | 2.2% |
| 35 | Churchill | 1,357 | 29 | 2.1% |
| 36 | Edwardsville | 2,085 | 43 | 2.1% |
| 37 | St. Marys | 5,692 | 117 | 2.1% |
| 38 | Royersford | 2,179 | 43 | 2.0% |
| 39 | Avalon | 2,710 | 53 | 2.0% |
| 40 | Forest Hills | 3,112 | 60 | 1.9% |
| 41 | Exeter | 2,494 | 48 | 1.9% |
| 42 | Ridgway | 1,778 | 34 | 1.9% |
| 43 | Nanticoke | 4,415 | 84 | 1.9% |
| 44 | Penbrook | 1,377 | 26 | 1.9% |
| 45 | Morrisville | 4,084 | 76 | 1.9% |
| 46 | Slippery Rock | 1,266 | 23 | 1.8% |
| 47 | Lancaster | 21,971 | 396 | 1.8% |
| 48 | Grove City | 2,514 | 45 | 1.8% |
| 49 | Laureldale | 1,514 | 27 | 1.8% |
| 50 | Aspinwall | 1,192 | 21 | 1.8% |
| 51 | Duquesne | 2,221 | 39 | 1.8% |
| 52 | Upland | 1,214 | 21 | 1.7% |
| 53 | Summit Hill | 1,280 | 22 | 1.7% |
| 54 | Wormleysburg | 1,300 | 22 | 1.7% |
| 55 | Minersville | 1,841 | 31 | 1.7% |
| 56 | Blakely | 2,982 | 50 | 1.7% |
| 57 | Pittsburgh | 138,188 | 2,310 | 1.7% |
| 58 | Bradford | 3,170 | 52 | 1.6% |
| 59 | Palmerton | 2,802 | 45 | 1.6% |
| 60 | New Eagle | 1,063 | 17 | 1.6% |
| 61 | Clairton | 2,715 | 43 | 1.6% |
| 62 | Ambridge | 3,138 | 49 | 1.6% |
| 63 | West Chester | 7,774 | 120 | 1.5% |
| 64 | South Williamsport | 2,665 | 39 | 1.5% |
| 65 | Philadelphia | 679,428 | 9,883 | 1.5% |
| 66 | Franklin | 2,622 | 38 | 1.4% |
| 67 | Ford City | 1,453 | 21 | 1.4% |
| 68 | Brentwood | 4,562 | 65 | 1.4% |
| 69 | Hatboro | 3,170 | 45 | 1.4% |
| 70 | Youngwood | 1,356 | 19 | 1.4% |
| 71 | Wind Gap | 1,511 | 21 | 1.4% |
| 72 | Quake | 3,541 | 49 | 1.4% |
| 73 | Union City | 1,250 | 17 | 1.4% |
| 74 | Carlisle | 9,223 | 125 | 1.4% |
| 75 | Bellevue | 4,053 | 54 | 1.3% |
| 76 | Chambersburg | 9,839 | 131 | 1.3% |
| 77 | Brookhaven | 3,799 | 50 | 1.3% |
| 78 | Dickson City | 2,778 | 36 | 1.3% |
| 79 | Birdsboro | 2,132 | 27 | 1.3% |
| 80 | Westmont | 2,001 | 25 | 1.2% |
| 81 | Coraopolis | 2,589 | 32 | 1.2% |
| 82 | Macungie | 1,392 | 17 | 1.2% |
| 83 | Portage | 1,076 | 13 | 1.2% |
| 84 | Spring City | 1,998 | 24 | 1.2% |
| 85 | Bethlehem | 31,052 | 371 | 1.2% |
| 86 | Coopersburg | 1,096 | 13 | 1.2% |
| 87 | Norri | 12,642 | 149 | 1.2% |
| 88 | York | 17,893 | 208 | 1.2% |
| 89 | Baldwin | 8,855 | 100 | 1.1% |
| 90 | Montoursville | 2,283 | 25 | 1.1% |
| 91 | Jim Thorpe | 1,921 | 21 | 1.1% |
| 92 | Trappe | 1,650 | 18 | 1.1% |
| 93 | Helle | 2,398 | 26 | 1.1% |
| 94 | Stroudsburg | 2,603 | 28 | 1.1% |
| 95 | Easton | 10,352 | 110 | 1.1% |
| 96 | Titusville | 2,465 | 26 | 1.1% |
| 97 | Sharpsburg | 1,612 | 17 | 1.1% |
| 98 | Beaver Falls | 3,371 | 35 | 1.0% |
| 99 | Lititz | 3,968 | 41 | 1.0% |
| 100 | Altoona | 18,777 | 194 | 1.0% |
Source: U.S. Census ACS 2020-2024. Places with over 1,000 households.
Summary
There You Have It – The Most LGBT Friendly Cities In Pennsylvania For 2026
If you’re looking at the number of gay households in Pennsylvania, this is an accurate list.
The gayest cities in Pennsylvania are North York, Millvale, Ridley Park, Narberth, Myer, Seven Fields, Manchester, Southwest Greensburg, North Wales, and Norwood. Not sold on Pennsylvania? Take the two-minute Find Your Place quiz and see which state actually fits you.
Questions and answers
Gayest Places In Pennsylvania FAQs
What is the gayest city in Pennsylvania?
North York is the gayest place in Pennsylvania for 2026, with same-sex couples making up 5.6% of households. Millvale and Ridley Park are next.
What are the gayest places in Pennsylvania?
The gayest places in Pennsylvania are North York, Millvale, Ridley Park, Narberth, Myer, Seven Fields, Manchester, Southwest Greensburg, North Wales, and Norwood. We ranked all 391 places with over 1,000 households by their share of same-sex partner households.
How do you measure the gayest places?
The Census does not ask about sexual orientation, so we use the closest thing it tracks: the share of households headed by same-sex partners, from the American Community Survey. It undercounts single LGBT residents, but it is consistent from place to place.
What is the straightest place in Pennsylvania?
Bellefonte is the straightest place in Pennsylvania by this measure, with same-sex couples at 0.0% of households. It anchors the other end of the ranking.
Does a town have to be big to make the list?
No. Any Pennsylvania place with more than 1,000 households qualifies, and 391 made the cut this year. Small towns can and do out-rank the big cities on this one.



