
Racial diversity in Florida is a mixed bag.
There are parts of Florida where there’s a high level of diversity. But where will you find the most diverse places in Florida?
To answer that question, we went to the US Census data. Using Saturday Night Science, we measured the Gini coefficient for all 222 cities in Florida to rank them from most to least diverse.
Table Of Contents: Top Ten | Methodology | Summary | Table
Here are the 10 most diverse places in Florida for 2026:
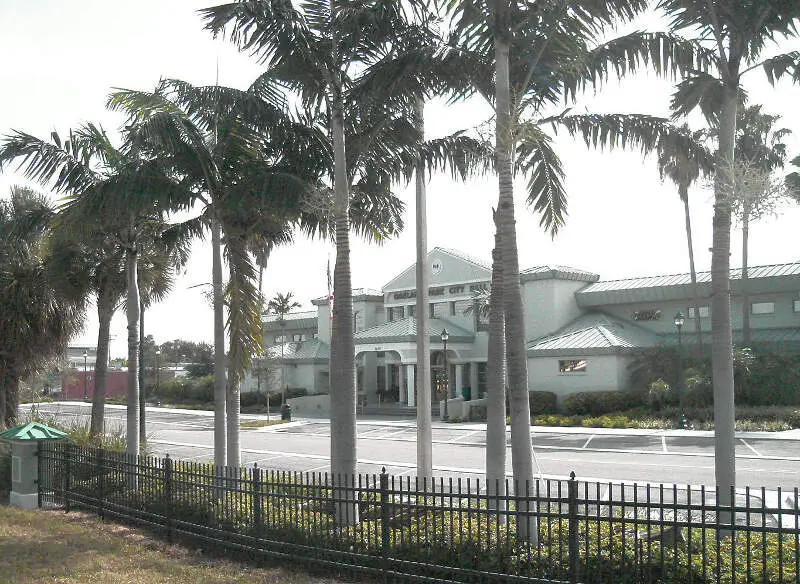
So what city is the most diverse in Florida? According to the most Census data, Coral Springs took the number one over all spot for diversity in Florida.
Read on below to see how we crunched the numbers and how your town ranked. To see where Florida ranked as a state, we have a ranking of the most diverse states in Ameria.
For more Florida reading:
The 10 Most Diverse Places In Florida For 2026

/10
Population: 136,103
HHI: 2,690
% White: 33.0%
% African American: 24.0%
% Hispanic: 31.2%
% Asian: 4.9%
More on Coral Springs: Data | Crime | Cost Of Living | Movers

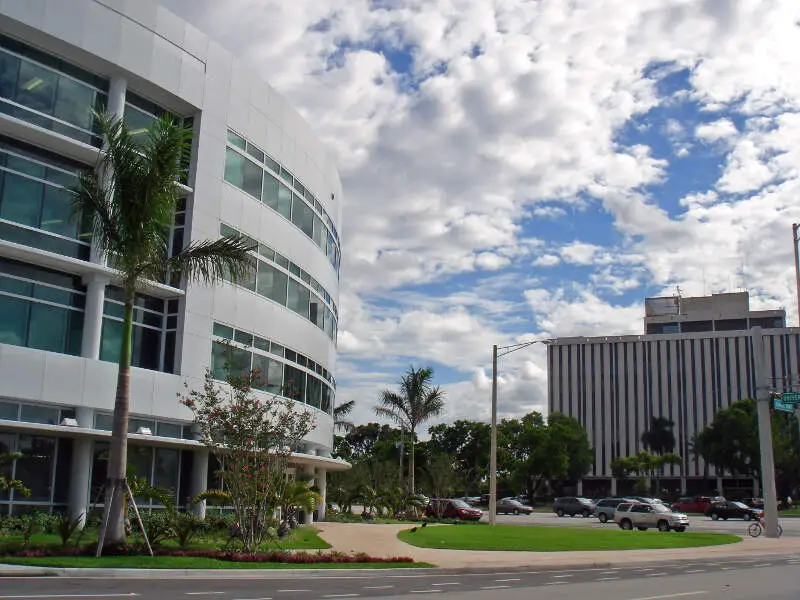
/10
Population: 88,093
HHI: 2,696
% White: 36.7%
% African American: 26.5%
% Hispanic: 23.4%
% Asian: 1.6%
More on Deerfield Beach: Data | Crime | Cost Of Living | Movers

/10
Population: 59,198
HHI: 2,710
% White: 29.2%
% African American: 33.2%
% Hispanic: 26.7%
% Asian: 3.2%
More on Margate: Data | Crime | Cost Of Living | Movers

/10
Population: 49,033
HHI: 2,712
% White: 38.0%
% African American: 20.5%
% Hispanic: 28.0%
% Asian: 5.7%
More on Ocoee: Data | Crime | Cost Of Living | Movers

/10
Population: 40,344
HHI: 2,770
% White: 35.1%
% African American: 23.4%
% Hispanic: 30.7%
% Asian: 5.7%
More on Royal Palm Beach: Data | Crime | Cost Of Living | Movers

/10
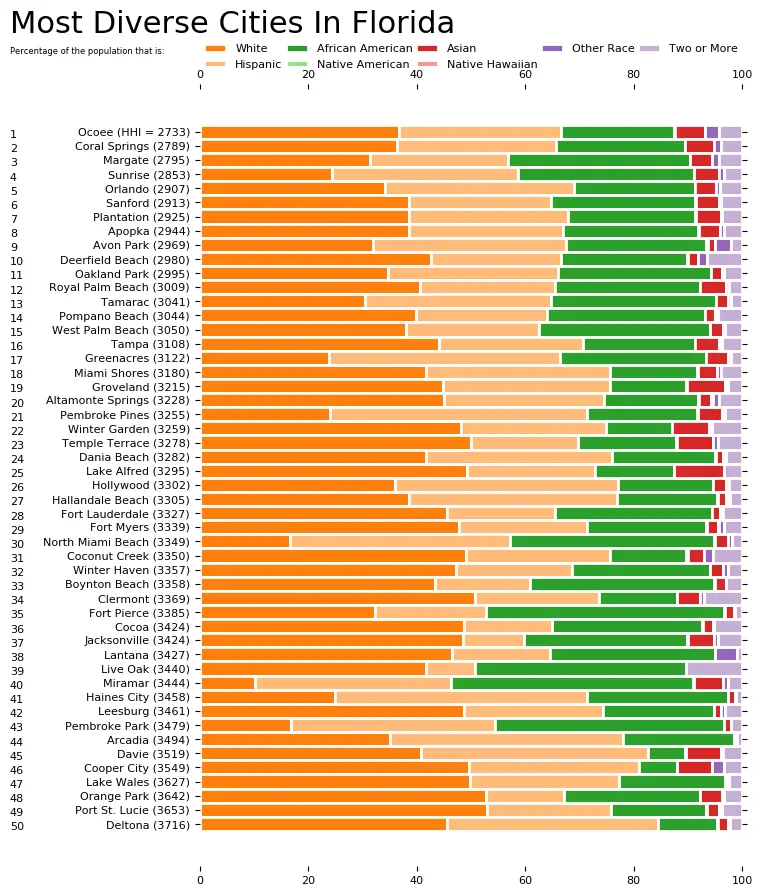
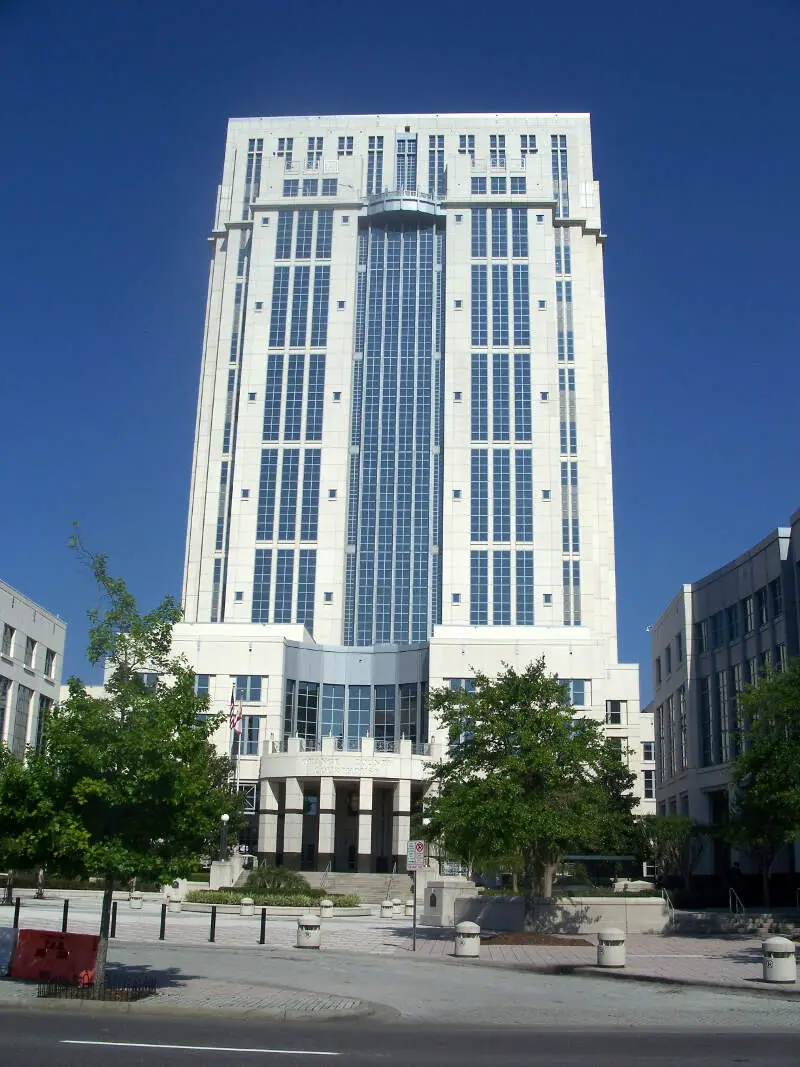
Population: 319,758
HHI: 2,771
% White: 31.2%
% African American: 22.2%
% Hispanic: 35.4%
% Asian: 4.8%
More on Orlando: Data | Crime | Cost Of Living | Movers

/10
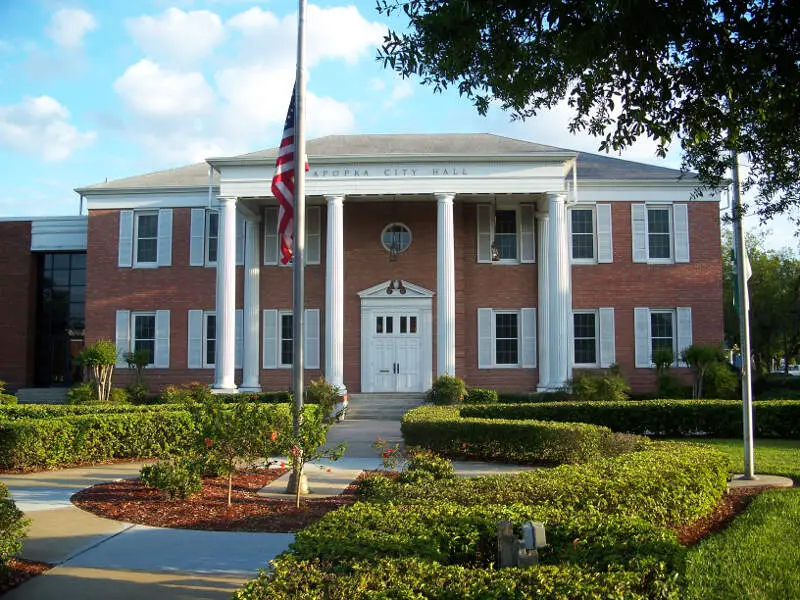
Population: 58,232
HHI: 2,811
% White: 35.2%
% African American: 25.5%
% Hispanic: 29.8%
% Asian: 3.5%
More on Apopka: Data | Crime | Cost Of Living | Movers
/10
Population: 96,293
HHI: 2,838
% White: 37.1%
% African American: 22.0%
% Hispanic: 30.6%
% Asian: 5.2%
More on Plantation: Data | Crime | Cost Of Living | Movers

/10
Population: 97,918
HHI: 2,856
% White: 21.6%
% African American: 32.5%
% Hispanic: 36.0%
% Asian: 4.7%
More on Sunrise: Data | Crime | Cost Of Living | Movers

/10
Population: 44,682
HHI: 2,900
% White: 32.6%
% African American: 26.8%
% Hispanic: 33.1%
% Asian: 3.0%
More on Oakland Park: Data | Crime | Cost Of Living | Movers
Methodology: How we determined the most diverse cities in Florida for 2026
We still believe in the accuracy of data — especially from the Census — and Saturday Night Science. So that’s where we went to get the race breakdown across Florida.
That leads us to the Census’s most recently available data, the 2020-2024 American Community Survey data from the US Census.
Specifically, we looked at table B03002: HISPANIC OR LATINO ORIGIN BY RACE. Here are the category names as defined by the Census:
- White alone*
- Black or African American alone*
- American Indian and Alaska Native alone*
- Asian alone*
- Native Hawaiian and Other Pacific Islander alone*
- Some other race alone*
- Two or more races*
- Hispanic or Latino
We limited our analysis to non-CDPs with a population greater than 5,000 people. That left us with 222 cities.
We then calculated the HHI for each city by finding the racial breakdown of a city in percent terms, squaring them, and then adding the squares together. This left us with scores ranging from 2,690 (Coral Springs) to 9,308 (Hialeah Gardens).
Finally, we ranked each city based on the HHI, with a lower score being more diverse than a high score. Coral Springs took the distinction of being the most diverse, while Hialeah Gardens was the least diverse city.
We updated this article for 2026. This report is our eleventh time ranking the most diverse places in Florida.
Summary: Diversity Across Florida
If you’re looking for a scientific breakdown of diversity across Florida, this is an accurate list.
The most diverse cities in Florida are Coral Springs, Deerfield Beach, Margate, Ocoee, Royal Palm Beach, Orlando, Apopka, Plantation, Sunrise, and Oakland Park.
If you’re curious enough, here are the least diverse places in Florida:
- Hialeah Gardens
- Sweetwater
- Hialeah
For more Florida reading, check out:
- Best Places To Live In Florida
- Cheapest Places To Live In Florida
- Most Dangerous Places In Florida
- Best Places To Raise A Family In Florida
- Safest Places In Florida
- Worst Places To Live In Florida
Race By City In Florida For 2026
| Rank | City | Population | HHI | % White | % Black | % Hispanic | % Asian |
|---|---|---|---|---|---|---|---|
| 1 | Coral Springs, FL | 136,103 | 2,690 | 33.0% | 24.0% | 31.2% | 4.9% |
| 2 | Deerfield Beach, FL | 88,093 | 2,696 | 36.7% | 26.5% | 23.4% | 1.6% |
| 3 | Margate, FL | 59,198 | 2,710 | 29.2% | 33.2% | 26.7% | 3.2% |
| 4 | Ocoee, FL | 49,033 | 2,712 | 38.0% | 20.5% | 28.0% | 5.7% |
| 5 | Royal Palm Beach, FL | 40,344 | 2,770 | 35.1% | 23.4% | 30.7% | 5.7% |
| 6 | Orlando, FL | 319,758 | 2,771 | 31.2% | 22.2% | 35.4% | 4.8% |
| 7 | Apopka, FL | 58,232 | 2,811 | 35.2% | 25.5% | 29.8% | 3.5% |
| 8 | Plantation, FL | 96,293 | 2,838 | 37.1% | 22.0% | 30.6% | 5.2% |
| 9 | Sunrise, FL | 97,918 | 2,856 | 21.6% | 32.5% | 36.0% | 4.7% |
| 10 | Oakland Park, FL | 44,682 | 2,900 | 32.6% | 26.8% | 33.1% | 3.0% |
| 11 | Pompano Beach, FL | 114,147 | 2,904 | 37.6% | 28.9% | 24.9% | 1.9% |
| 12 | Sanford, FL | 63,730 | 2,909 | 38.5% | 24.1% | 28.5% | 4.4% |
| 13 | West Palm Beach, FL | 122,290 | 2,976 | 36.2% | 32.2% | 24.6% | 2.7% |
| 14 | Avon Park, FL | 10,057 | 2,992 | 35.7% | 24.0% | 33.5% | 0.5% |
| 15 | Live Oak, FL | 6,985 | 2,998 | 40.7% | 30.5% | 13.7% | 0.1% |
| 16 | Tamarac, FL | 73,019 | 3,018 | 26.2% | 36.4% | 31.5% | 2.8% |
| 17 | Dania Beach, FL | 32,180 | 3,044 | 38.0% | 19.6% | 34.5% | 2.4% |
| 18 | Coconut Creek, FL | 58,330 | 3,046 | 44.1% | 15.8% | 28.2% | 3.2% |
| 19 | Miami Shores, FL | 11,752 | 3,051 | 37.0% | 16.2% | 37.2% | 2.8% |
| 20 | Altamonte Springs, FL | 46,116 | 3,055 | 41.9% | 18.7% | 30.3% | 2.6% |
| 21 | Tampa, FL | 401,618 | 3,073 | 44.3% | 19.5% | 26.2% | 4.7% |
| 22 | Mascotte, FL | 7,949 | 3,091 | 33.4% | 22.8% | 37.8% | 1.5% |
| 23 | Clermont, FL | 46,853 | 3,099 | 47.2% | 13.3% | 24.4% | 5.4% |
| 24 | Winter Haven, FL | 55,200 | 3,111 | 41.5% | 27.8% | 24.4% | 1.6% |
| 25 | Temple Terrace, FL | 27,275 | 3,134 | 47.1% | 18.4% | 22.7% | 6.5% |
| 26 | Fort Myers, FL | 95,051 | 3,168 | 45.2% | 21.9% | 24.8% | 2.0% |
| 27 | Winter Garden, FL | 47,872 | 3,197 | 48.7% | 15.1% | 22.7% | 6.3% |
| 28 | Fort Lauderdale, FL | 185,604 | 3,231 | 44.4% | 28.7% | 20.3% | 1.4% |
| 29 | Fort Pierce, FL | 49,082 | 3,249 | 30.3% | 43.5% | 20.6% | 2.1% |
| 30 | Jacksonville, FL | 977,670 | 3,261 | 46.8% | 29.3% | 12.6% | 5.0% |
| 31 | Greenacres, FL | 44,373 | 3,263 | 21.7% | 27.8% | 44.8% | 2.7% |
| 32 | Groveland, FL | 22,012 | 3,283 | 45.6% | 16.0% | 30.5% | 3.2% |
| 33 | Boynton Beach, FL | 81,435 | 3,288 | 43.2% | 33.5% | 16.8% | 2.8% |
| 34 | Lantana, FL | 12,256 | 3,311 | 39.7% | 36.7% | 19.5% | 0.4% |
| 35 | Lake Park, FL | 9,081 | 3,337 | 20.9% | 47.4% | 25.3% | 1.8% |
| 36 | Davie, FL | 108,346 | 3,339 | 37.7% | 8.2% | 42.3% | 6.2% |
| 37 | Hollywood, FL | 155,082 | 3,344 | 35.0% | 15.3% | 43.2% | 2.4% |
| 38 | Pembroke Pines, FL | 173,194 | 3,384 | 21.1% | 20.2% | 50.0% | 4.8% |
| 39 | Leesburg, FL | 30,807 | 3,384 | 47.5% | 25.8% | 21.2% | 1.0% |
| 40 | Hallandale Beach, FL | 41,854 | 3,388 | 38.5% | 15.9% | 40.5% | 0.9% |
| 41 | North Miami Beach, FL | 43,898 | 3,390 | 14.6% | 39.6% | 40.0% | 2.8% |
| 42 | Lake Wales, FL | 16,785 | 3,392 | 44.3% | 21.8% | 30.8% | 1.1% |
| 43 | Palm Bay, FL | 130,132 | 3,397 | 50.8% | 18.5% | 20.6% | 2.2% |
| 44 | Sebring, FL | 11,382 | 3,439 | 48.2% | 15.8% | 29.1% | 3.3% |
| 45 | Arcadia, FL | 7,707 | 3,446 | 35.9% | 21.6% | 41.1% | 0.0% |
| 46 | Miramar, FL | 138,600 | 3,476 | 9.4% | 42.5% | 39.3% | 4.7% |
| 47 | Cooper City, FL | 34,660 | 3,489 | 49.4% | 5.9% | 30.7% | 5.9% |
| 48 | Port St. Lucie, FL | 232,491 | 3,496 | 50.4% | 19.0% | 24.0% | 2.1% |
| 49 | Parkland, FL | 37,178 | 3,531 | 54.7% | 13.0% | 16.5% | 7.2% |
| 50 | Cocoa, FL | 19,554 | 3,538 | 50.8% | 22.4% | 20.9% | 1.3% |
| 51 | Haines City, FL | 34,234 | 3,553 | 22.3% | 23.8% | 49.8% | 1.7% |
| 52 | Tallahassee, FL | 201,875 | 3,563 | 47.8% | 34.1% | 8.9% | 4.3% |
| 53 | Wellington, FL | 62,146 | 3,567 | 50.8% | 12.1% | 28.5% | 4.4% |
| 54 | Plant City, FL | 40,887 | 3,574 | 46.9% | 14.7% | 33.9% | 1.6% |
| 55 | Pembroke Park, FL | 6,360 | 3,574 | 18.0% | 44.4% | 35.7% | 0.7% |
| 56 | Gainesville, FL | 145,702 | 3,603 | 54.2% | 20.4% | 13.6% | 6.3% |
| 57 | Lake Alfred, FL | 7,277 | 3,632 | 50.4% | 11.7% | 30.3% | 5.2% |
| 58 | Callaway, FL | 13,496 | 3,648 | 54.9% | 19.6% | 13.7% | 4.3% |
| 59 | Casselberry, FL | 30,135 | 3,652 | 52.4% | 8.6% | 28.0% | 4.8% |
| 60 | Deltona, FL | 97,334 | 3,658 | 43.0% | 11.3% | 40.9% | 1.6% |
| 61 | Southwest Ranches, FL | 7,656 | 3,668 | 44.7% | 4.4% | 40.0% | 5.0% |
| 62 | South Miami, FL | 12,277 | 3,682 | 24.5% | 11.7% | 53.8% | 2.9% |
| 63 | Newberry, FL | 7,865 | 3,691 | 54.6% | 18.3% | 18.4% | 3.3% |
| 64 | Davenport, FL | 13,238 | 3,703 | 21.0% | 18.7% | 53.8% | 1.5% |
| 65 | Minneola, FL | 16,598 | 3,729 | 51.6% | 8.2% | 31.1% | 2.1% |
| 66 | Delray Beach, FL | 67,979 | 3,739 | 52.4% | 29.0% | 11.2% | 2.6% |
| 67 | Palatka, FL | 10,650 | 3,755 | 38.6% | 46.5% | 9.1% | 0.3% |
| 68 | Lakeland, FL | 119,961 | 3,766 | 54.9% | 17.9% | 20.5% | 2.5% |
| 69 | Daytona Beach, FL | 78,992 | 3,777 | 52.6% | 29.8% | 9.9% | 2.9% |
| 70 | Ocala, FL | 66,584 | 3,849 | 56.5% | 17.6% | 17.8% | 4.0% |
| 71 | Bartow, FL | 20,438 | 3,870 | 55.8% | 22.0% | 15.9% | 2.7% |
| 72 | Fort Meade, FL | 5,225 | 3,888 | 51.4% | 13.2% | 32.6% | 0.0% |
| 73 | Okeechobee, FL | 5,479 | 3,895 | 51.4% | 8.6% | 34.0% | 0.9% |
| 74 | North Lauderdale, FL | 45,234 | 3,900 | 7.9% | 55.5% | 26.8% | 3.6% |
| 75 | Marianna, FL | 7,150 | 3,937 | 43.8% | 44.2% | 6.9% | 0.6% |
| 76 | Crestview, FL | 28,773 | 3,940 | 57.8% | 20.3% | 10.8% | 2.7% |
| 77 | North Miami, FL | 60,344 | 3,974 | 9.2% | 52.3% | 33.9% | 1.0% |
| 78 | Palmetto Bay, FL | 24,639 | 3,976 | 36.3% | 4.3% | 51.1% | 4.1% |
| 79 | Oviedo, FL | 40,599 | 3,976 | 57.5% | 8.2% | 23.4% | 6.4% |
| 80 | Pahokee, FL | 5,609 | 4,024 | 10.2% | 46.9% | 41.4% | 0.0% |
| 81 | Dundee, FL | 5,863 | 4,030 | 28.0% | 10.1% | 55.9% | 3.1% |
| 82 | Weston, FL | 68,837 | 4,047 | 26.9% | 3.1% | 56.8% | 8.4% |
| 83 | Pinecrest, FL | 18,462 | 4,053 | 40.5% | 1.8% | 48.7% | 3.8% |
| 84 | St. Cloud, FL | 65,130 | 4,061 | 36.3% | 4.8% | 52.0% | 1.5% |
| 85 | Dade City, FL | 8,152 | 4,074 | 58.0% | 16.8% | 20.1% | 0.9% |
| 86 | Clewiston, FL | 7,348 | 4,082 | 37.5% | 9.5% | 50.9% | 1.6% |
| 87 | Miami Beach, FL | 82,031 | 4,085 | 36.0% | 3.2% | 52.5% | 2.7% |
| 88 | Key West, FL | 25,720 | 4,087 | 58.5% | 12.2% | 22.5% | 2.3% |
| 89 | Maitland, FL | 19,469 | 4,107 | 58.8% | 10.7% | 22.6% | 3.3% |
| 90 | Longwood, FL | 16,337 | 4,133 | 56.8% | 5.0% | 29.0% | 2.0% |
| 91 | West Park, FL | 15,249 | 4,147 | 6.4% | 47.0% | 43.5% | 0.3% |
| 92 | Aventura, FL | 39,885 | 4,154 | 45.2% | 2.3% | 45.6% | 1.5% |
| 93 | Springfield, FL | 8,230 | 4,159 | 60.1% | 20.3% | 8.8% | 3.4% |
| 94 | Defuniak Springs, FL | 6,532 | 4,182 | 58.8% | 24.4% | 9.7% | 0.0% |
| 95 | Alachua, FL | 10,743 | 4,191 | 58.6% | 24.1% | 12.9% | 2.0% |
| 96 | Belle Glade, FL | 16,972 | 4,201 | 10.2% | 55.9% | 31.2% | 0.4% |
| 97 | Bradenton, FL | 57,014 | 4,231 | 60.2% | 12.2% | 20.9% | 2.3% |
| 98 | Holly Hill, FL | 13,084 | 4,242 | 61.6% | 15.8% | 11.8% | 3.0% |
| 99 | Lake City, FL | 12,515 | 4,264 | 56.3% | 32.5% | 4.7% | 1.3% |
| 100 | North Bay Village, FL | 8,118 | 4,266 | 24.5% | 4.5% | 60.0% | 4.7% |