Most Asian cities in Missouri research summary. We analyzed Missouri’s most recent Census data to determine the most Asian cities in Missouri based on the percentage of Asian residents.
20.3% Asian · #1 most Asian in Missouri
Olivette is an inner-ring suburb of St. Louis, located in St. Louis County, Missouri, United States. The population was 7,737 at the 2010 census.
Data | Crime | Cost of living | Movers

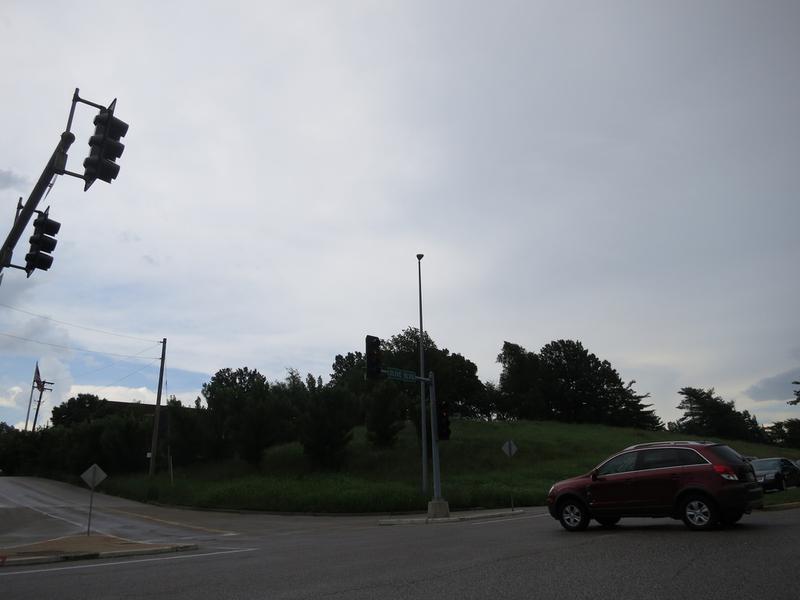
19.6% Asian · #2 most Asian in Missouri
Data | Crime | Cost of living | Movers
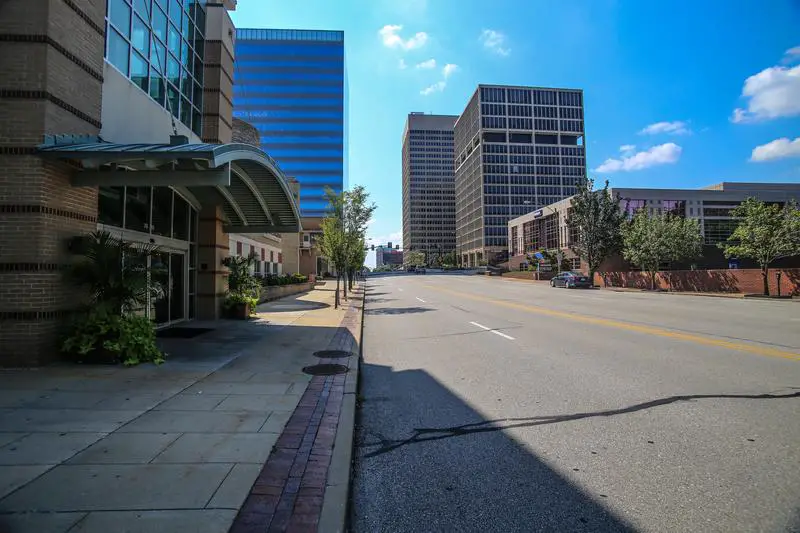
13.3% Asian · #3 most Asian in Missouri
Data | Crime | Cost of living | Movers

13.2% Asian · #4 most Asian in Missouri
Chesterfield is a city in St. Louis County, Missouri, United States, and a Western suburb of St. Louis. As of the 2010 census, the population was 47,484, making it the state’s fourteenth-largest city.
Data | Crime | Cost of living | Movers
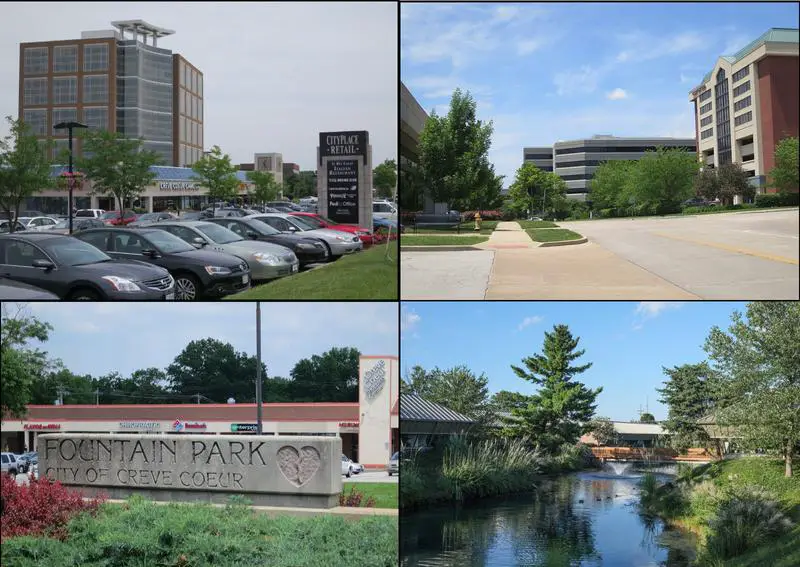
13.0% Asian · #5 most Asian in Missouri
Creve Coeur is a city located in west St. Louis County, Missouri, United States, in Greater St. Louis. The population was 17,833 at the 2010 census. Creve Coeur borders and shares a ZIP code with the neighboring city of Town and Country. It is home to the headquarters of Monsanto and Drury Hotels.
Data | Crime | Cost of living | Movers
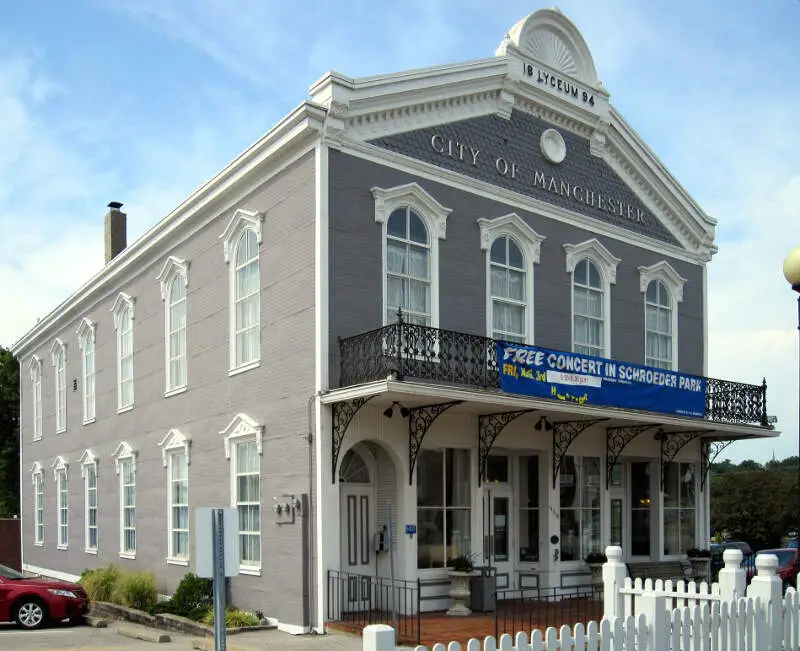
12.4% Asian · #6 most Asian in Missouri
Manchester is a city in St. Louis County, Missouri, United States. The population was 18,094 at the 2010 census. The mayor is David Willson.
Data | Crime | Cost of living | Movers
8.9% Asian · #7 most Asian in Missouri
Ballwin is a second-ring western suburb of St. Louis, located in St. Louis County, Missouri, United States. The population was 30,404 as of the 2010 census.
Data | Crime | Cost of living | Movers
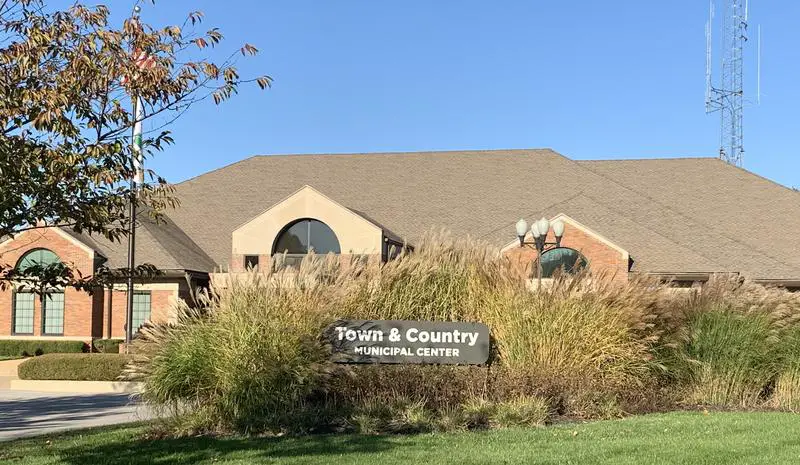
8.9% Asian · #8 most Asian in Missouri
Data | Crime | Cost of living | Movers
7.9% Asian · #9 most Asian in Missouri
University City is an inner-ring suburb of the city of St. Louis in St. Louis County, in the U.S. state of Missouri. The population was 35,371 in 2010 census.
Data | Crime | Cost of living | Movers
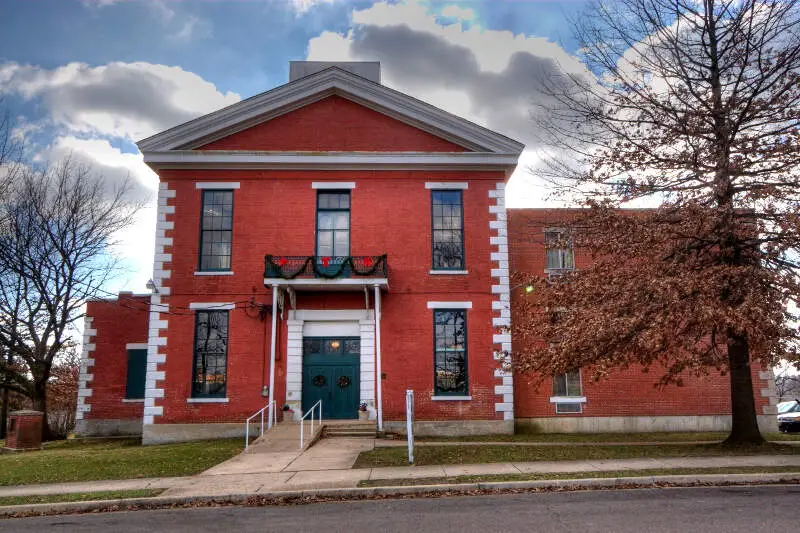
7.3% Asian · #10 most Asian in Missouri
Rolla is a city in and the county seat of Phelps County, Missouri, United States. The population in the 2010 United States Census was 19,559. Rolla is located approximately midway between St. Louis and Springfield along I-44. The Rolla, Mo Micropolitan Statistical area consists of Phelps County, Missouri.
Data | Crime | Cost of living | Movers
The receipts
Compare the top ten
Pick a metric. The bars rescale. The red line is Missouri’s statewide median.
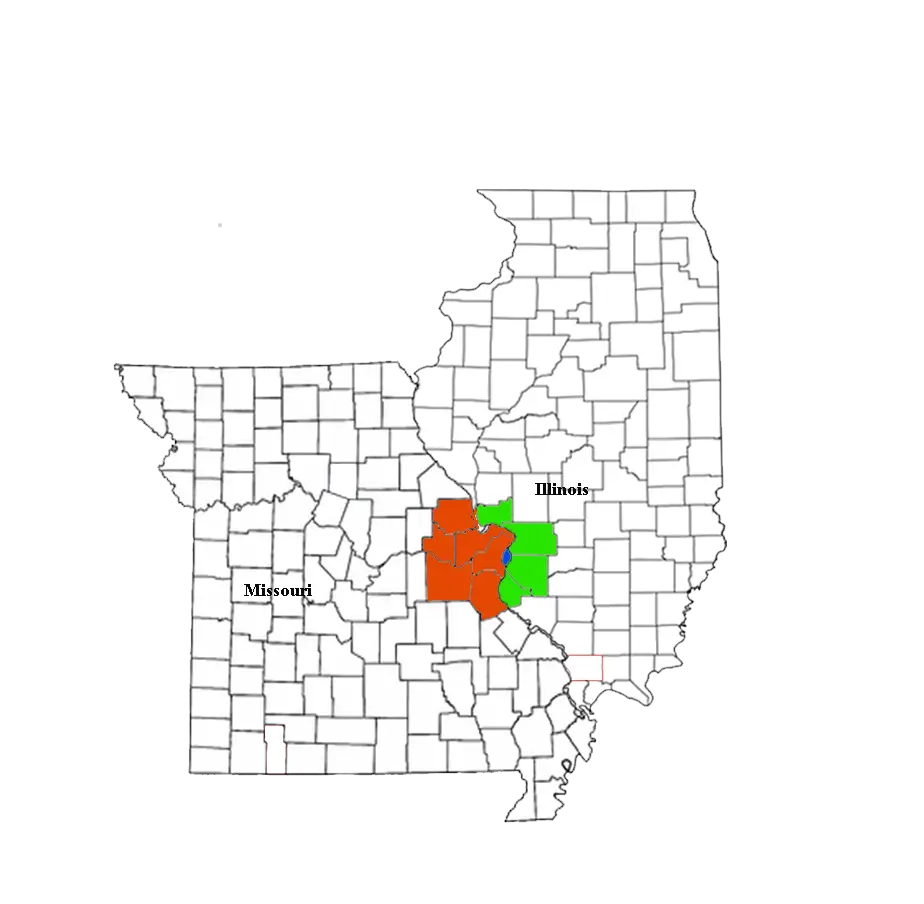
On the map
Where Missouri’s Asian communities live
Saturday Night Science
Methodology: How We Determined The Cities In Missouri With The Largest Asian Population For 2026
We used Saturday Night Science to compare Census data on race across every place in Missouri.
The Census’s most recently available data comes from the 2020-2024 American Community Survey.
Specifically, we looked at table B03002: Hispanic OR LATINO ORIGIN BY RACE. Here are the category names as defined by the Census:
- Hispanic or Latino
- White alone*
- Black or African American alone*
- American Indian and Alaska Native alone*
- Asian alone*
- Native Hawaiian and Other Pacific Islander alone*
- Some other race alone*
- Two or more races*
Our particular column of interest here was the number of people who identified as Asian alone.
We limited our analysis to cities with a population greater than 5,000 people. That left us with 121 cities.
We then calculated the percentage of residents that are Asian. The percentages ranked from 20.3% to 0.0%.
Finally, we ranked each city based on the percentage of Asian population, with a higher percentage being more Asian. Olivette took the distinction of being the most Asian, while De Soto was the least Asian city.
We updated this article for 2026. This report reflects our eleventh time ranking the cities in Missouri with the largest Asian population.
The full plate
Cities In Missouri By Asian Population
Click any column to sort. Search by city name.
| Rank | City | Population | Asian Population | % Asian |
|---|---|---|---|---|
| 1 | Olivette | 8,645 | 1,753 | 20.3% |
| 2 | Maryland Heights | 27,880 | 5,468 | 19.6% |
| 3 | Clayton | 17,380 | 2,306 | 13.3% |
| 4 | Chesterfield | 49,574 | 6,566 | 13.2% |
| 5 | Creve Coeur | 18,643 | 2,422 | 13.0% |
| 6 | Manchester | 18,160 | 2,251 | 12.4% |
| 7 | Ballwin | 31,279 | 2,772 | 8.9% |
| 8 | Town and Country | 11,607 | 1,028 | 8.9% |
| 9 | University City | 34,685 | 2,727 | 7.9% |
| 10 | Rolla | 20,287 | 1,474 | 7.3% |
| 11 | Brentwood | 8,144 | 578 | 7.1% |
| 12 | Ladue | 8,940 | 602 | 6.7% |
| 13 | Wildwood | 35,133 | 2,309 | 6.6% |
| 14 | Columbia | 128,548 | 8,106 | 6.3% |
| 15 | Maplewood | 8,156 | 465 | 5.7% |
| 16 | Dardenne Prairie | 13,503 | 756 | 5.6% |
| 17 | O’Fallon | 93,801 | 4,526 | 4.8% |
| 18 | Shrewsbury | 6,316 | 272 | 4.3% |
| 19 | Ellisville | 10,002 | 390 | 3.9% |
| 20 | Weldon Spring | 5,310 | 204 | 3.8% |
| 21 | Richmond Heights | 9,153 | 349 | 3.8% |
| 22 | St. Charles | 71,508 | 2,708 | 3.8% |
| 23 | St. Louis | 288,512 | 10,146 | 3.5% |
| 24 | Warrensburg | 19,582 | 588 | 3.0% |
| 25 | Kirksville | 17,563 | 515 | 2.9% |
| 26 | Branson | 12,817 | 372 | 2.9% |
| 27 | Kansas City | 510,612 | 14,451 | 2.8% |
| 28 | Maryville | 10,428 | 289 | 2.8% |
| 29 | Bridgeton | 11,369 | 306 | 2.7% |
| 30 | Cape Girardeau | 40,344 | 1,057 | 2.6% |
| 31 | St. Peters | 59,092 | 1,513 | 2.6% |
| 32 | Parkville | 8,366 | 212 | 2.5% |
| 33 | Jefferson City | 42,488 | 1,026 | 2.4% |
| 34 | Eureka | 13,081 | 292 | 2.2% |
| 35 | Joplin | 52,593 | 1,144 | 2.2% |
| 36 | St. Ann | 12,811 | 270 | 2.1% |
| 37 | Kirkwood | 29,363 | 601 | 2.0% |
| 38 | Des Peres | 9,170 | 187 | 2.0% |
| 39 | Valley Park | 6,795 | 138 | 2.0% |
| 40 | Grandview | 26,527 | 538 | 2.0% |
| 41 | Overland | 15,695 | 305 | 1.9% |
| 42 | Lake St. Louis | 18,066 | 343 | 1.9% |
| 43 | Springfield | 169,954 | 3,226 | 1.9% |
| 44 | Lee’s Summit | 103,656 | 1,933 | 1.9% |
| 45 | Nixa | 24,836 | 458 | 1.8% |
| 46 | Perryville | 8,536 | 156 | 1.8% |
| 47 | Arnold | 20,956 | 380 | 1.8% |
| 48 | Webster Groves | 23,712 | 418 | 1.8% |
| 49 | Blue Springs | 59,965 | 1,049 | 1.7% |
| 50 | Gladstone | 27,207 | 471 | 1.7% |
| 51 | Webb City | 13,221 | 221 | 1.7% |
| 52 | Wentzville | 47,061 | 766 | 1.6% |
| 53 | Bonne Terre | 6,683 | 107 | 1.6% |
| 54 | Hazelwood | 25,114 | 393 | 1.6% |
| 55 | Lebanon | 15,270 | 235 | 1.5% |
| 56 | Sunset Hills | 9,112 | 131 | 1.4% |
| 57 | Battlefield | 6,165 | 86 | 1.4% |
| 58 | Union | 12,781 | 164 | 1.3% |
| 59 | Jackson | 15,659 | 198 | 1.3% |
| 60 | Nevada | 7,925 | 97 | 1.2% |
| 61 | Pevely | 6,055 | 74 | 1.2% |
| 62 | Liberty | 30,689 | 375 | 1.2% |
| 63 | St. Joseph | 71,236 | 853 | 1.2% |
| 64 | Independence | 121,740 | 1,405 | 1.2% |
| 65 | Raymore | 24,526 | 281 | 1.1% |
| 66 | Trenton | 5,536 | 63 | 1.1% |
| 67 | Glendale | 6,114 | 69 | 1.1% |
| 68 | Belton | 25,008 | 278 | 1.1% |
| 69 | Hannibal | 16,771 | 185 | 1.1% |
| 70 | Sedalia | 22,003 | 218 | 1.0% |
| 71 | Crestwood | 12,295 | 115 | 0.9% |
| 72 | Poplar Bluff | 16,254 | 150 | 0.9% |
| 73 | Oak Grove | 8,538 | 76 | 0.9% |
| 74 | Florissant | 51,773 | 455 | 0.9% |
| 75 | Mexico | 11,477 | 96 | 0.8% |
| 76 | Carl Junction | 8,339 | 69 | 0.8% |
| 77 | Macon | 5,466 | 44 | 0.8% |
| 78 | Kearney | 10,885 | 85 | 0.8% |
| 79 | Kennett | 10,196 | 78 | 0.8% |
| 80 | Ozark | 22,417 | 171 | 0.8% |
| 81 | Republic | 19,829 | 145 | 0.7% |
| 82 | Marshall | 13,739 | 88 | 0.6% |
| 83 | Richmond | 5,959 | 34 | 0.6% |
| 84 | Pleasant Hill | 8,847 | 49 | 0.6% |
| 85 | West Plains | 12,441 | 68 | 0.5% |
| 86 | Grain Valley | 16,271 | 84 | 0.5% |
| 87 | Farmington | 18,282 | 93 | 0.5% |
| 88 | Monett | 9,873 | 50 | 0.5% |
| 89 | Troy | 13,947 | 70 | 0.5% |
| 90 | Raytown | 29,445 | 125 | 0.4% |
| 91 | Festus | 13,201 | 53 | 0.4% |
| 92 | Jennings | 12,918 | 51 | 0.4% |
| 93 | St. John | 6,527 | 24 | 0.4% |
| 94 | Bolivar | 11,170 | 40 | 0.4% |
| 95 | Caruthersville | 5,326 | 19 | 0.4% |
| 96 | Dexter | 7,891 | 26 | 0.3% |
| 97 | Chillicothe | 8,923 | 29 | 0.3% |
| 98 | Fulton | 12,617 | 40 | 0.3% |
| 99 | Berkeley | 8,123 | 24 | 0.3% |
| 100 | Moberly | 13,526 | 38 | 0.3% |
Source: U.S. Census ACS 2020-2024. 121 cities with more than 5,000 residents.
Summary
Summary: Asian Populations Across Missouri
If you’re looking for a breakdown of Asian populations across Missouri according to the most recent data, this is an accurate list.
The most Asian cities in Missouri are Olivette, Maryland Heights, Clayton, Chesterfield, Creve Coeur, Manchester, Ballwin, Town and Country, University City, and Rolla. Not sold on Missouri? Take the two-minute Find Your Place quiz and see which state actually fits you.
Questions and answers
Most Asian Cities In Missouri FAQs
What is the most Asian city in Missouri?
Olivette is the most Asian city in Missouri for 2026, at 20.3% of residents. Maryland Heights and Clayton are next.
What cities in Missouri have the largest Asian population?
The Missouri cities with the largest Asian population shares are Olivette, Maryland Heights, Clayton, Chesterfield, Creve Coeur, Manchester, Ballwin, Town and Country, University City, and Rolla. We ranked all 121 places with more than 5,000 residents.
What percent of Olivette is Asian?
Asian residents make up 20.3% of Olivette, the highest share of the 121 Missouri places we measured. The numbers come from the Census Bureau’s American Community Survey.
What is the least Asian city in Missouri?
De Soto is the least Asian city in Missouri, at 0.0%. It sits at the opposite end of the same ranking.
Where does this data come from?
Every share is calculated from the Census Bureau’s American Community Survey (2020-2024), based on residents identifying as Asian alone. We rank each Missouri place with more than 5,000 residents.


