Most Asian cities in Oregon research summary. We analyzed Oregon’s most recent Census data to determine the most Asian cities in Oregon based on the percentage of Asian residents. Here are the results of our analysis:
-
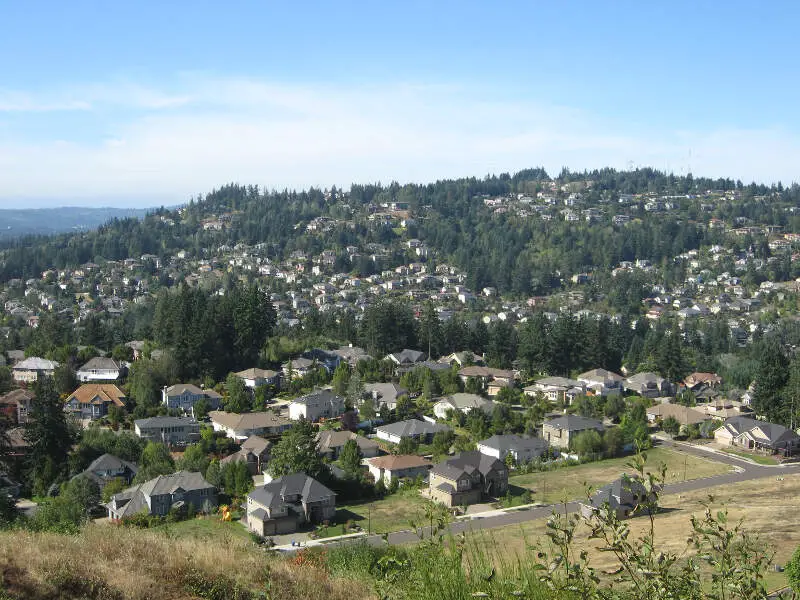
The most Asian city in Oregon is Happy Valley based on the most recent Census data.
-
Happy Valley is 16.13% Asian.
-
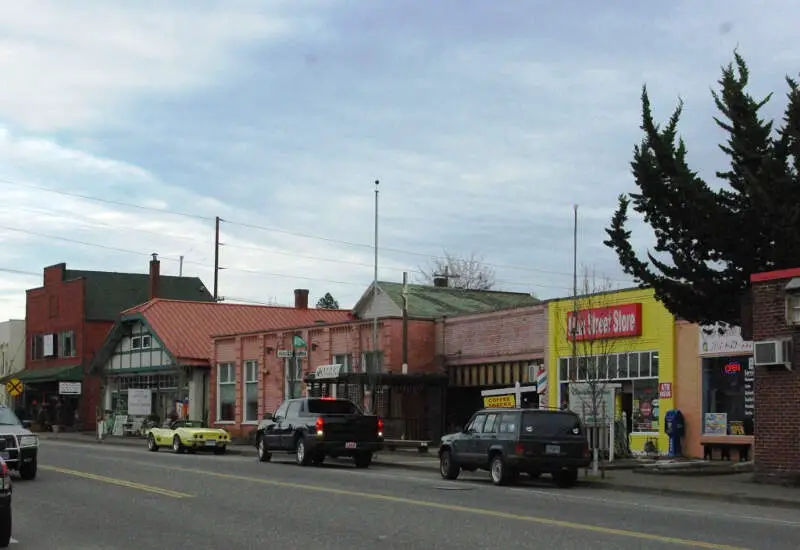
The least Asian city in Oregon is Milton-Freewater.
-
Milton-Freewater is 0.0% Asian.
-
Oregon is 4.4% Asian.
-
Oregon is the 16th most Asian state in the United States.
Table Of Contents: Top Ten | Methodology | Summary | Table
Here are the cities in Oregon with the largest Asian population in 2026:
Which city in Oregon had the largest Asian population? Happy Valley took the number one overall spot for the largest Asian in Oregon for 2026. 16.13% of Happy Valley identify as Asian.
Read below to see how we crunched the numbers and how your town ranked.
To see where Oregon ranked as a state on diversity, we have a ranking of the most diverse states in America.
And if you already knew these places were Asian, check out the best places to live in Oregon or the most diverse places in Oregon.
The 10 Most Asian Cities In Oregon For 2026

/10
Population: 26,738
% Asian: 16.13%
# Of Asian Residents: 4,314
More on Happy Valley: Data | Cost Of Living | Movers

/10
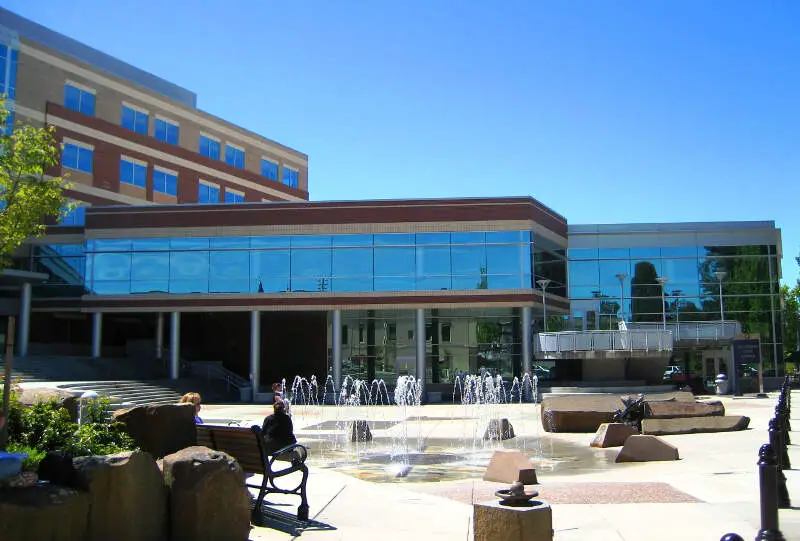
Population: 108,231
% Asian: 11.27%
# Of Asian Residents: 12,198
More on Hillsboro: Data | Crime | Cost Of Living | Movers

/10
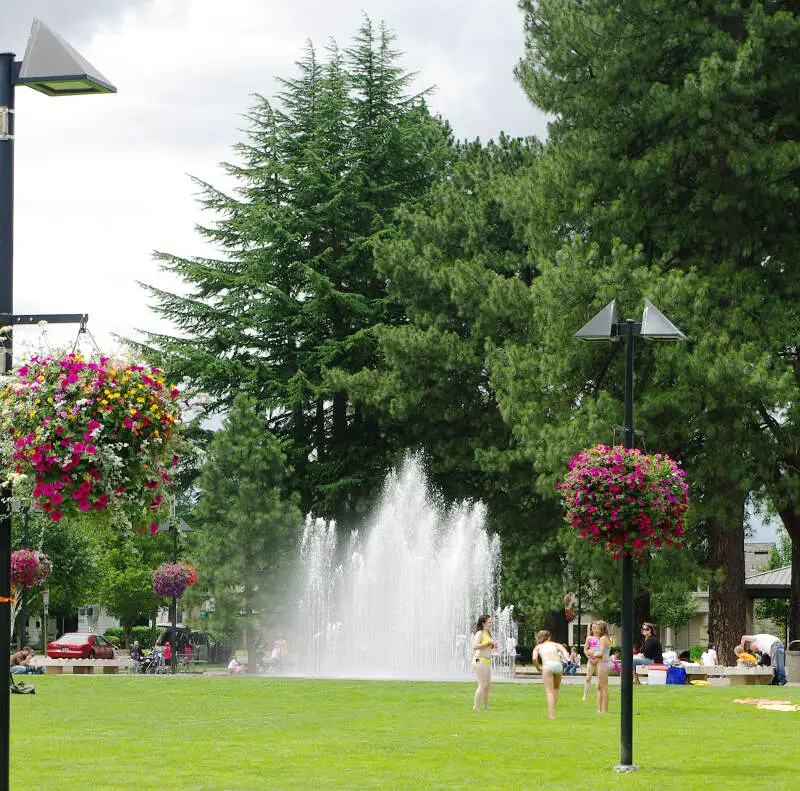
Population: 97,812
% Asian: 11.02%
# Of Asian Residents: 10,779
More on Beaverton: Data | Crime | Cost Of Living | Movers

/10
Population: 40,381
% Asian: 9.15%
# Of Asian Residents: 3,696
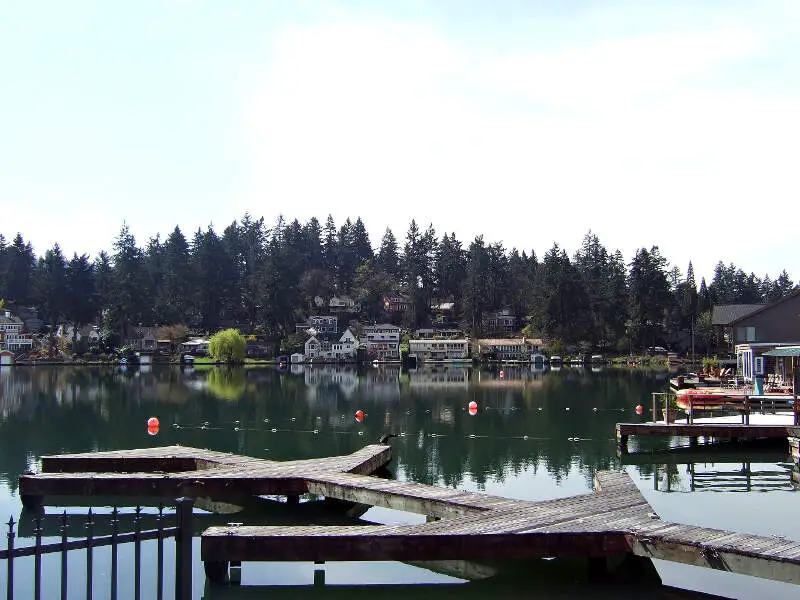
More on Lake Oswego: Data | Crime | Cost Of Living | Movers

/10
Population: 59,960
% Asian: 8.99%
# Of Asian Residents: 5,390
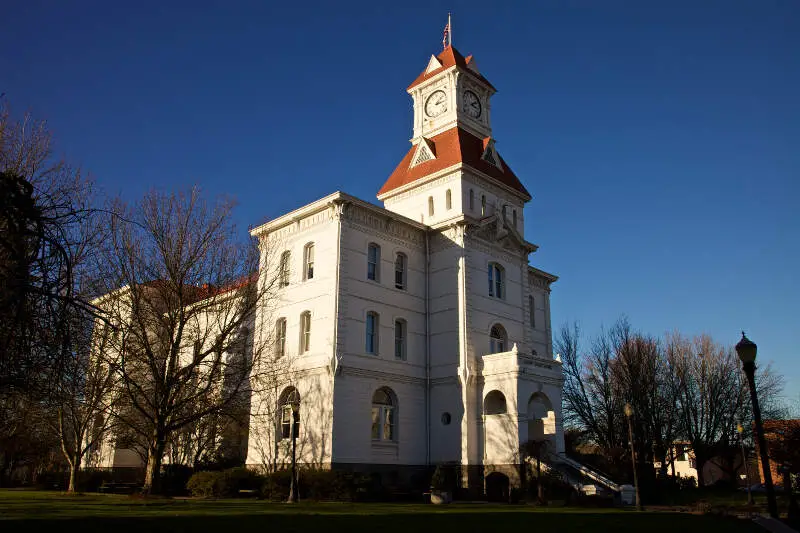
More on Corvallis: Data | Crime | Cost Of Living | Movers

/10
Population: 56,011
% Asian: 8.89%
# Of Asian Residents: 4,979
More on Tigard: Data | Crime | Cost Of Living | Movers

/10
Population: 641,165
% Asian: 7.97%
# Of Asian Residents: 51,090
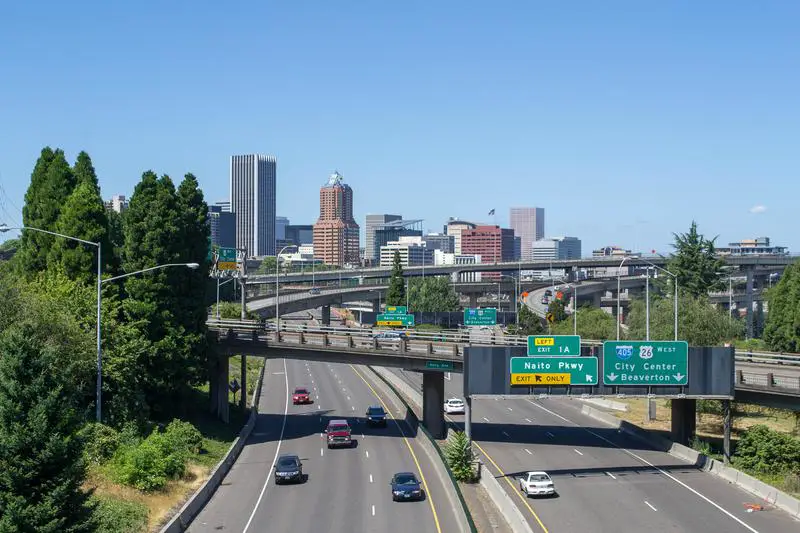
More on Portland: Data | Crime | Cost Of Living | Movers

/10
Population: 26,935
% Asian: 6.28%
# Of Asian Residents: 1,692
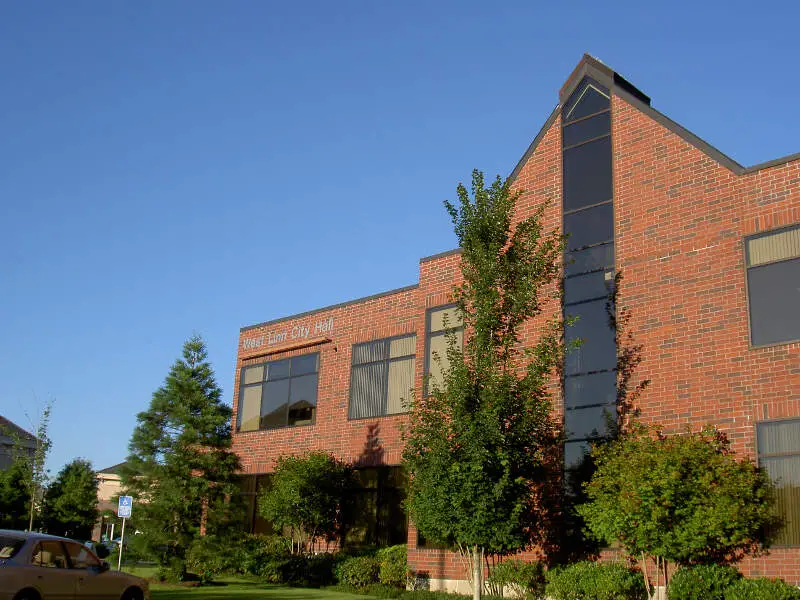
More on West Linn: Data | Crime | Cost Of Living | Movers

/10
Population: 112,378
% Asian: 5.81%
# Of Asian Residents: 6,533
More on Gresham: Data | Crime | Cost Of Living | Movers

/10
Population: 15,923
% Asian: 5.77%
# Of Asian Residents: 918
More on Troutdale: Data | Cost Of Living | Movers
Methodology: How We Determined The Cities In Oregon With The Largest Asian Population For 2026
We used Saturday Night Science to compare Census data on race across every place in Oregon.
The Census’s most recently available data comes from the 2020-2024 American Community Survey.
Specifically, we looked at table B03002: Hispanic OR LATINO ORIGIN BY RACE. Here are the category names as defined by the Census:
- Hispanic or Latino
- White alone*
- Black or African American alone*
- American Indian and Alaska Native alone*
- Asian alone*
- Native Hawaiian and Other Pacific Islander alone*
- Some other race alone*
- Two or more races*
Our particular column of interest here was the number of people who identified as Asian alone.
We limited our analysis to cities with a population greater than 5,000 people. That left us with 73 cities.
We then calculated the percentage of residents that are Asian. The percentages ranked from 16.1% to 0.0%.
Finally, we ranked each city based on the percentage of Asian population, with a higher score being more Asian than a lower score. Happy Valley took the distinction of being the most Asian, while Milton-Freewater was the least Asian city.
We updated this article for 2026. This report reflects our eleventh time ranking the cities in Oregon with the largest Asian population.
Read on for more information on how the cities in Oregon ranked by population of Asian residents or, for a more general take on diversity in America, head over to our ranking of the most diverse cities in America.
Summary: Asian Populations Across Oregon
If you’re looking for a breakdown of Asian populations across Oregon according to the most recent data, this is an accurate list.
The most Asian cities in Oregon are Happy Valley, Hillsboro, Beaverton, Lake Oswego, Corvallis, Tigard, Portland, West Linn, Gresham, and Troutdale.
If you’re curious enough, here are the least Asian places in Oregon:
- Milton-Freewater
- Madras
- Silverton
For more Oregon reading, check out:
Table: Asian Population By City In Oregon
| Rank | City | Population | Asian Population | % Asian |
|---|---|---|---|---|
| 1 | Happy Valley | 26,738 | 4,314 | 16.13% |
| 2 | Hillsboro | 108,231 | 12,198 | 11.27% |
| 3 | Beaverton | 97,812 | 10,779 | 11.02% |
| 4 | Lake Oswego | 40,381 | 3,696 | 9.15% |
| 5 | Corvallis | 59,960 | 5,390 | 8.99% |
| 6 | Tigard | 56,011 | 4,979 | 8.89% |
| 7 | Portland | 641,165 | 51,090 | 7.97% |
| 8 | West Linn | 26,935 | 1,692 | 6.28% |
| 9 | Gresham | 112,378 | 6,533 | 5.81% |
| 10 | Troutdale | 15,923 | 918 | 5.77% |
| 11 | Wilsonville | 26,974 | 1,103 | 4.09% |
| 12 | Eugene | 179,591 | 7,116 | 3.96% |
| 13 | Forest Grove | 26,529 | 985 | 3.71% |
| 14 | Sherwood | 20,307 | 751 | 3.7% |
| 15 | Salem | 178,865 | 6,377 | 3.57% |
| 16 | Tualatin | 27,763 | 969 | 3.49% |
| 17 | Sheridan | 6,339 | 202 | 3.19% |
| 18 | Newberg | 26,066 | 738 | 2.83% |
| 19 | Milwaukie | 21,392 | 564 | 2.64% |
| 20 | Cottage Grove | 10,698 | 260 | 2.43% |
| 21 | North Bend | 10,171 | 237 | 2.33% |
| 22 | Newport | 10,583 | 227 | 2.14% |
| 23 | Albany | 56,839 | 1,142 | 2.01% |
| 24 | Ontario | 11,842 | 233 | 1.97% |
| 25 | Oregon City | 37,755 | 706 | 1.87% |
| 26 | Lebanon | 19,344 | 361 | 1.87% |
| 27 | Monmouth | 11,428 | 210 | 1.84% |
| 28 | Coos Bay | 15,925 | 283 | 1.78% |
| 29 | La Grande | 13,058 | 231 | 1.77% |
| 30 | Seaside | 7,192 | 120 | 1.67% |
| 31 | Florence | 9,482 | 156 | 1.65% |
| 32 | Mcminnville | 34,596 | 561 | 1.62% |
| 33 | Brookings | 6,703 | 108 | 1.61% |
| 34 | Ashland | 21,259 | 334 | 1.57% |
| 35 | Fairview | 10,735 | 165 | 1.54% |
| 36 | Lincoln City | 9,968 | 150 | 1.5% |
| 37 | Sandy | 12,854 | 191 | 1.49% |
| 38 | Springfield | 61,499 | 897 | 1.46% |
| 39 | Gladstone | 11,977 | 174 | 1.45% |
| 40 | Klamath Falls | 22,115 | 312 | 1.41% |
| 41 | Umatilla | 7,508 | 105 | 1.4% |
| 42 | Central Point | 19,216 | 257 | 1.34% |
| 43 | Canby | 18,134 | 242 | 1.33% |
| 44 | Molalla | 10,186 | 130 | 1.28% |
| 45 | Medford | 86,315 | 1,097 | 1.27% |
| 46 | Cornelius | 14,255 | 178 | 1.25% |
| 47 | Hood River | 8,361 | 102 | 1.22% |
| 48 | Keizer | 39,082 | 438 | 1.12% |
| 49 | Independence | 10,199 | 114 | 1.12% |
| 50 | Astoria | 10,109 | 112 | 1.11% |
| 51 | Bend | 103,390 | 1,127 | 1.09% |
| 52 | Scappoose | 8,179 | 88 | 1.08% |
| 53 | Redmond | 36,092 | 381 | 1.06% |
| 54 | Winston | 5,690 | 58 | 1.02% |
| 55 | Stayton | 8,292 | 83 | 1.0% |
| 56 | Roseburg | 23,778 | 236 | 0.99% |
| 57 | Hermiston | 19,546 | 178 | 0.91% |
| 58 | Woodburn | 27,875 | 249 | 0.89% |
| 59 | Grants Pass | 39,311 | 327 | 0.83% |
| 60 | Talent | 6,254 | 46 | 0.74% |
| 61 | Sweet Home | 10,078 | 56 | 0.56% |
| 62 | The Dalles | 15,917 | 79 | 0.5% |
| 63 | Baker City | 10,210 | 43 | 0.42% |
| 64 | Eagle Point | 9,839 | 38 | 0.39% |
| 65 | Junction City | 6,947 | 25 | 0.36% |
| 66 | Prineville | 11,470 | 39 | 0.34% |
| 67 | St. Helens | 14,258 | 47 | 0.33% |
| 68 | Pendleton | 16,950 | 48 | 0.28% |
| 69 | Sutherlin | 8,599 | 20 | 0.23% |
| 70 | Dallas | 17,531 | 29 | 0.17% |
| 71 | Silverton | 10,456 | 7 | 0.07% |
| 72 | Madras | 7,676 | 0 | 0.0% |
| 73 | Milton-Freewater | 7,036 | 0 | 0.0% |