Most Asian cities in Texas research summary. We analyzed Texas’s most recent Census data to determine the most Asian cities in Texas based on the percentage of Asian residents.
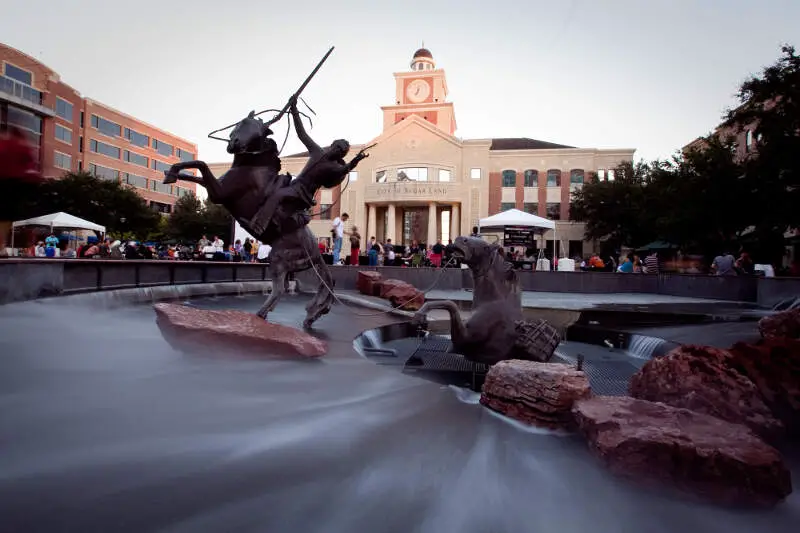
38.5% Asian · #1 most Asian in Texas
Sugar Land is a city in Fort Bend County, Texas, United States, within the Houston-The Woodlands-Sugar Land metropolitan area. It is one of the most affluent and fastest-growing cities in Texas, having grown more than 158 percent between 1990 and 2000. In the time period of 2000-2007, Sugar Land also enjoyed a 46.24% job growth. As of the 2010 census, the city’s population was 78,817. In 2015 the population had risen to an estimated 88,156. Founded as a sugar plantation in the early mid-20th century and incorporated in 1959, SugarLand is the largest city and economic center of Fort Bend County.
Data | Crime | Cost of living | Movers
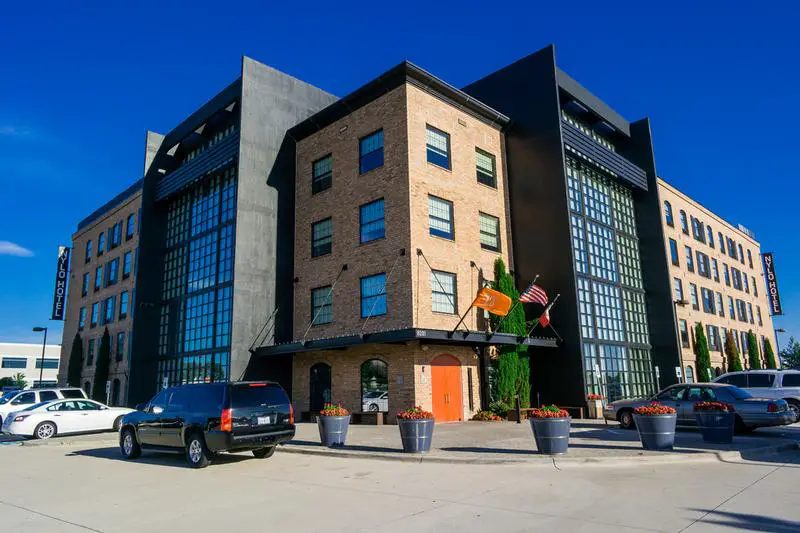
32.4% Asian · #2 most Asian in Texas
Murphy is a city in suburban Collin County, Texas, United States. The 2010 census reported the population as 17,708, compared to 3,099 in 2000. Murphy is located northeast of Dallas and has a history that goes back to the late 1800s.
Data | Crime | Cost of living | Movers

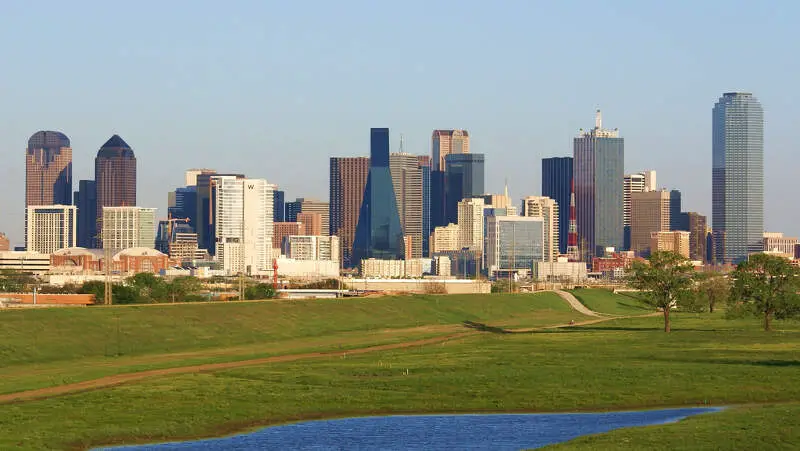
29.8% Asian · #3 most Asian in Texas
Coppell is a city in the northwest corner of Dallas County in the U.S. state of Texas. It is a suburb of Dallas and a bedroom community in the Dallas-Fort Worth metroplex. The population was 38,659 at the 2010 census. A small area in the far northern portion of the city extends into neighboring Denton County.
Data | Crime | Cost of living | Movers
28.1% Asian · #4 most Asian in Texas
Frisco is a city in Collin and Denton counties in Texas. It is part of the Dallas-Fort Worth metroplex, and is approximately 25 miles from both Dallas Love Field and Dallas/Fort Worth International Airport.
Data | Crime | Cost of living | Movers | Compare
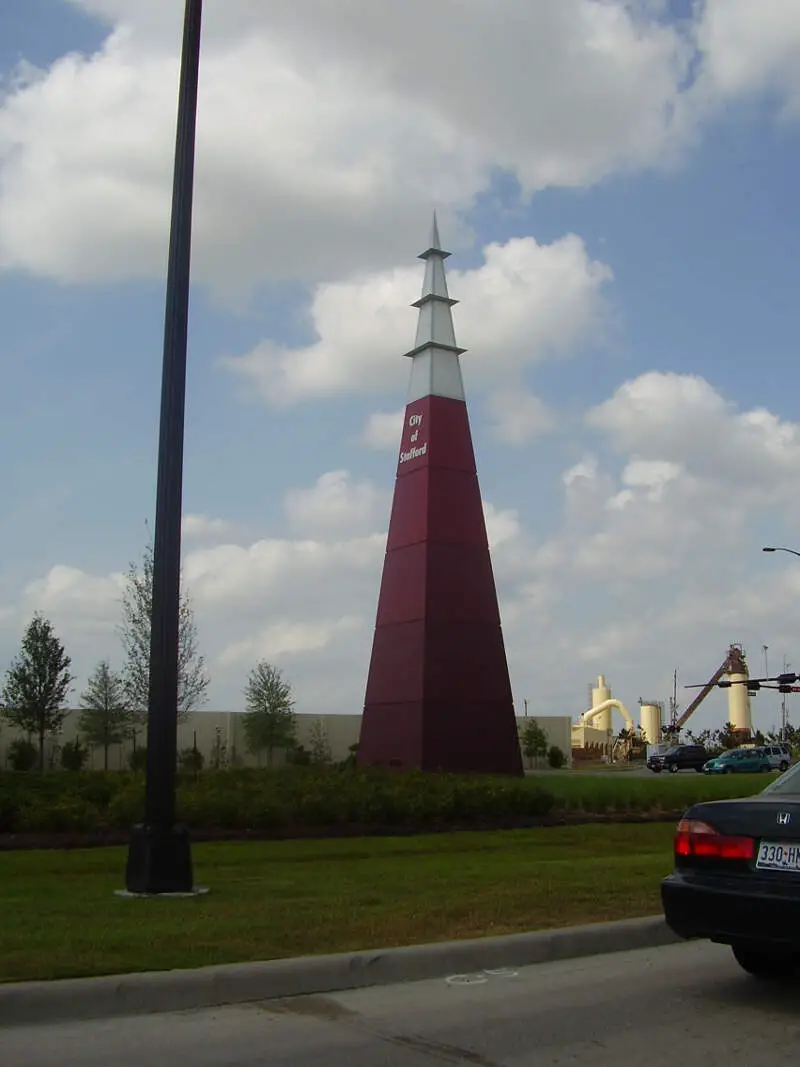
24.2% Asian · #5 most Asian in Texas
Stafford is a city in the U.S. state of Texas, within the Houston-The Woodlands-Sugar Land metropolitan area. The city is mostly in FortBendCounty, with a small portion in HarrisCounty. As of the 2010 census, Stafford’s population was 17,693, up from 15,681 at the 2000 census. As of 2015 the population had risen to an estimated 18,459.
Data | Crime | Cost of living | Movers
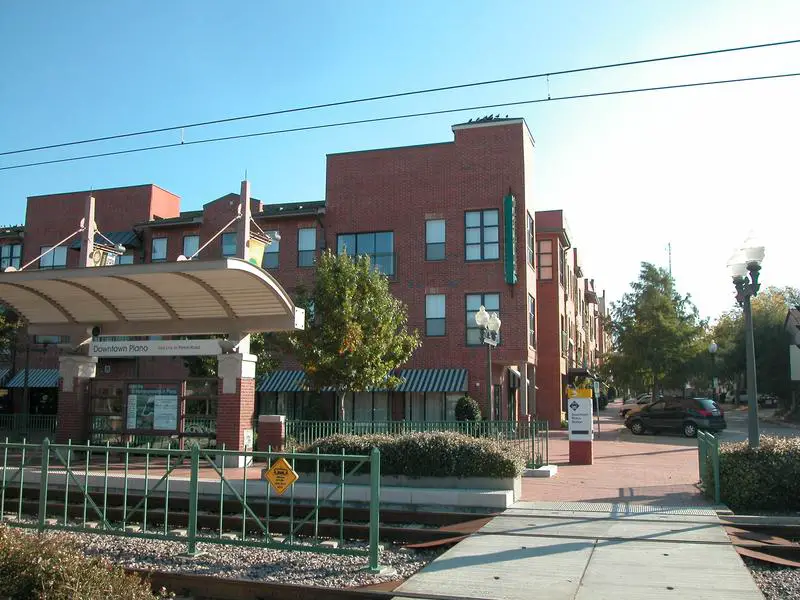
23.6% Asian · #6 most Asian in Texas
Plano is a city in the U.S. state of Texas, located twenty miles northeast of downtown Dallas. The city of Plano is a part of the Dallas-Fort Worth metropolitan area. Plano lies mostly within Collin County, but with a small portion that extends into Denton County.
Data | Crime | Cost of living | Movers | Compare
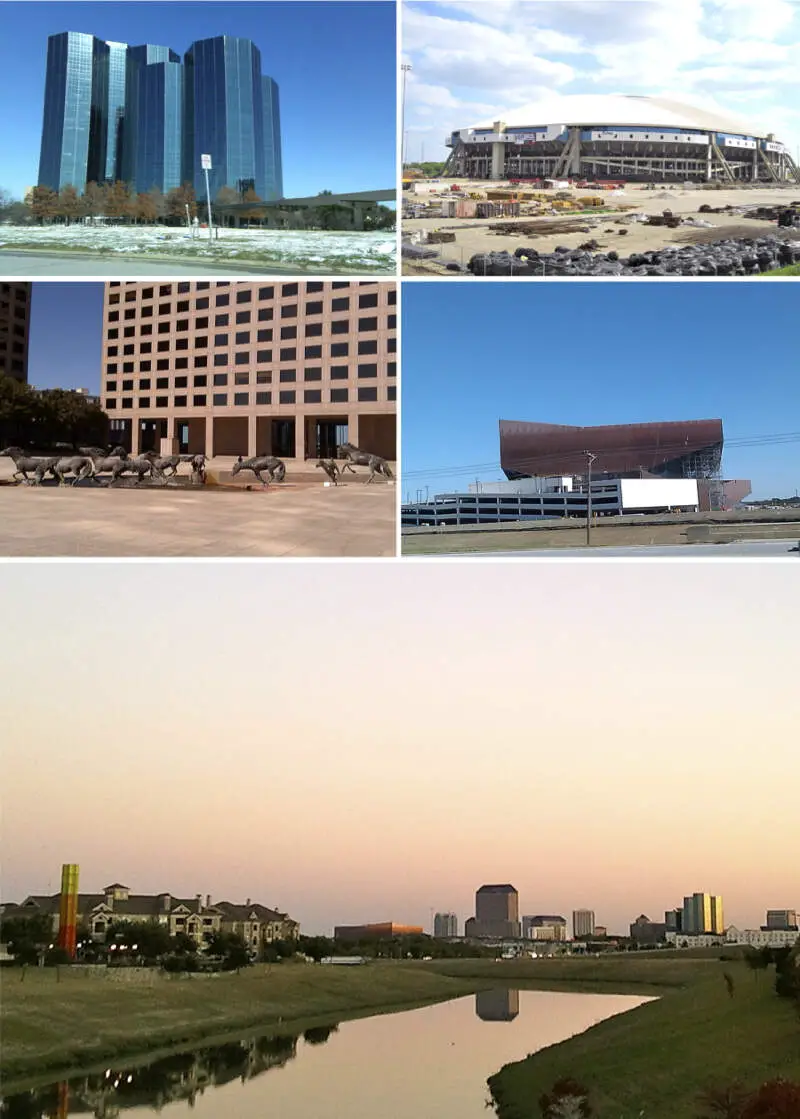
23.1% Asian · #7 most Asian in Texas
Irving is a principal city in Dallas County in the U.S. state of Texas and it is also an inner ring suburb of the city of Dallas. According to a 2013 estimate from the United States Census Bureau, the city population was 228,653 making it the thirteenth most populous city in Texas. Irving is part of the Dallas-Fort Worth metroplex.
Data | Crime | Cost of living | Movers | Compare
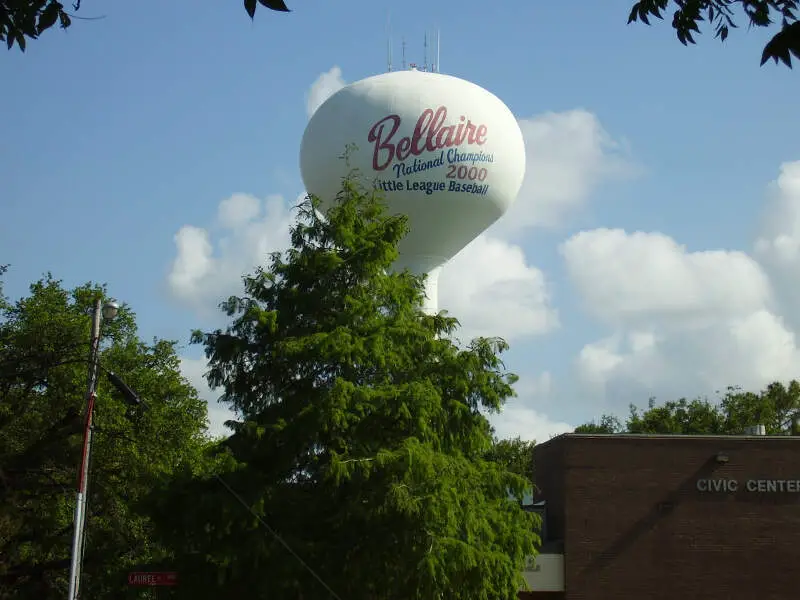
22.5% Asian · #8 most Asian in Texas
Bellaire is a city in southwest Harris County, Texas, United States, within the Houston-Sugar Land-Baytown metropolitan area. As of the 2010 U.S. Census, the city population was 16,855 and is surrounded by the cities of Houston and West University Place.
Data | Crime | Cost of living | Movers
21.0% Asian · #9 most Asian in Texas
Allen is a city in Collin County, Texas, a northern suburb of Dallas. As of the 2010 United States Census, the city had a total population of 84,246.
Data | Crime | Cost of living | Movers
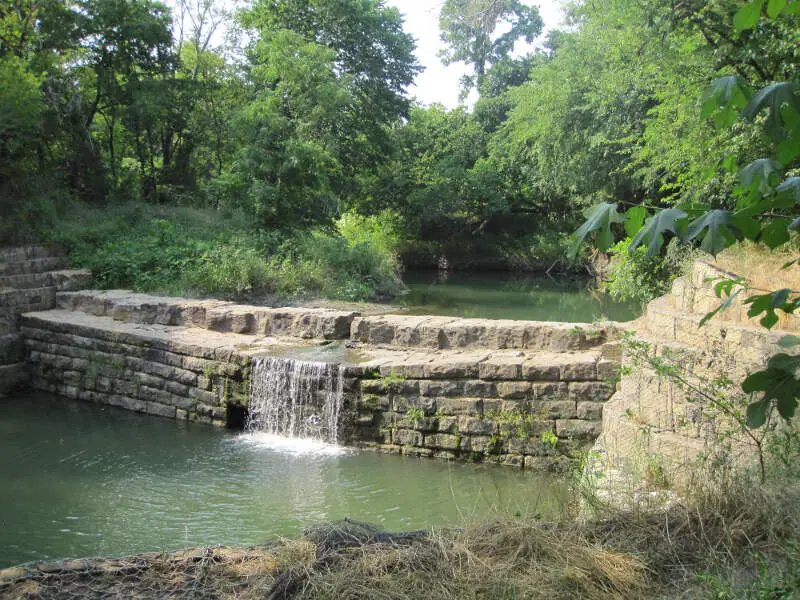
19.7% Asian · #10 most Asian in Texas
Sachse is a city in Collin and Dallas counties in the U.S. state of Texas and is part of the DFW Metroplex. A northeastern suburb of Dallas, the city population was 20,329, as of the 2010 census. Sachse is located right off Texas State Highway 78 and is approximately 1 mile north of the President George Bush Turnpike and Firewheel Town Center.
Data | Crime | Cost of living | Movers
The receipts
Compare the top ten
Pick a metric. The bars rescale. The red line is Texas’s statewide median.
On the map
Where Texas’s Asian communities live
Saturday Night Science
Methodology: How We Determined The Cities In Texas With The Largest Asian Population For 2026
We used Saturday Night Science to compare Census data on race across every place in Texas.
The Census’s most recently available data comes from the 2020-2024 American Community Survey.
Specifically, we looked at table B03002: Hispanic OR LATINO ORIGIN BY RACE. Here are the category names as defined by the Census:
- Hispanic or Latino
- White alone*
- Black or African American alone*
- American Indian and Alaska Native alone*
- Asian alone*
- Native Hawaiian and Other Pacific Islander alone*
- Some other race alone*
- Two or more races*
Our particular column of interest here was the number of people who identified as Asian alone.
We limited our analysis to cities with a population greater than 5,000 people. That left us with 324 cities.
We then calculated the percentage of residents that are Asian. The percentages ranked from 38.5% to 0.0%.
Finally, we ranked each city based on the percentage of Asian population, with a higher percentage being more Asian. Sugar Land took the distinction of being the most Asian, while Hereford was the least Asian city.
We updated this article for 2026. This report reflects our eleventh time ranking the cities in Texas with the largest Asian population.
The full plate
Cities In Texas By Asian Population
Click any column to sort. Search by city name.
| Rank | City | Population | Asian Population | % Asian |
|---|---|---|---|---|
| 1 | Sugar Land | 110,016 | 42,406 | 38.5% |
| 2 | Murphy | 21,188 | 6,873 | 32.4% |
| 3 | Coppell | 42,154 | 12,554 | 29.8% |
| 4 | Frisco | 219,304 | 61,526 | 28.1% |
| 5 | Stafford | 17,401 | 4,219 | 24.2% |
| 6 | Plano | 290,594 | 68,596 | 23.6% |
| 7 | Irving | 256,492 | 59,148 | 23.1% |
| 8 | Bellaire | 17,206 | 3,871 | 22.5% |
| 9 | Allen | 110,265 | 23,170 | 21.0% |
| 10 | Sachse | 30,491 | 6,001 | 19.7% |
| 11 | Missouri City | 76,558 | 14,411 | 18.8% |
| 12 | Carrollton | 133,740 | 23,673 | 17.7% |
| 13 | Cedar Park | 78,301 | 13,087 | 16.7% |
| 14 | Celina | 34,268 | 5,711 | 16.7% |
| 15 | Richardson | 118,731 | 19,082 | 16.1% |
| 16 | Southlake | 31,137 | 4,835 | 15.5% |
| 17 | Pearland | 127,514 | 19,754 | 15.5% |
| 18 | Lewisville | 131,080 | 19,824 | 15.1% |
| 19 | Prosper | 37,869 | 5,633 | 14.9% |
| 20 | Leander | 74,067 | 10,998 | 14.8% |
| 21 | Flower Mound | 78,389 | 11,603 | 14.8% |
| 22 | McKinney | 210,600 | 30,419 | 14.4% |
| 23 | Euless | 60,421 | 8,024 | 13.3% |
| 24 | West University Place | 14,982 | 1,896 | 12.7% |
| 25 | Katy | 25,184 | 2,915 | 11.6% |
| 26 | Garland | 246,844 | 27,989 | 11.3% |
| 27 | Wylie | 60,334 | 6,823 | 11.3% |
| 28 | Farmers Branch | 36,645 | 4,076 | 11.1% |
| 29 | Little Elm | 54,820 | 5,995 | 10.9% |
| 30 | Leon Valley | 11,446 | 1,194 | 10.4% |
| 31 | Colleyville | 26,012 | 2,665 | 10.2% |
| 32 | College Station | 124,570 | 12,164 | 9.8% |
| 33 | Pflugerville | 65,971 | 6,113 | 9.3% |
| 34 | Rosenberg | 40,646 | 3,670 | 9.0% |
| 35 | Austin | 979,539 | 87,686 | 9.0% |
| 36 | Haltom City | 45,767 | 4,093 | 8.9% |
| 37 | Trophy Club | 13,733 | 1,190 | 8.7% |
| 38 | Round Rock | 127,786 | 10,335 | 8.1% |
| 39 | The Colony | 45,454 | 3,641 | 8.0% |
| 40 | Grapevine | 51,139 | 4,016 | 7.9% |
| 41 | Arlington | 397,742 | 29,158 | 7.3% |
| 42 | Groves | 16,976 | 1,233 | 7.3% |
| 43 | Windcrest | 5,820 | 415 | 7.1% |
| 44 | Webster | 12,366 | 876 | 7.1% |
| 45 | Jersey Village | 7,817 | 553 | 7.1% |
| 46 | Port Lavaca | 11,358 | 794 | 7.0% |
| 47 | Rowlett | 65,463 | 4,560 | 7.0% |
| 48 | Grand Prairie | 201,883 | 13,961 | 6.9% |
| 49 | Houston | 2,328,253 | 160,136 | 6.9% |
| 50 | Bedford | 49,085 | 3,356 | 6.8% |
| 51 | Addison | 17,290 | 1,120 | 6.5% |
| 52 | Keller | 45,976 | 2,891 | 6.3% |
| 53 | League City | 116,215 | 7,098 | 6.1% |
| 54 | Lakeway | 19,307 | 1,172 | 6.1% |
| 55 | Seabrook | 13,768 | 802 | 5.8% |
| 56 | Keene | 6,691 | 385 | 5.8% |
| 57 | University Park | 25,155 | 1,438 | 5.7% |
| 58 | Roanoke | 10,286 | 586 | 5.7% |
| 59 | Live Oak | 15,984 | 910 | 5.7% |
| 60 | Princeton | 25,229 | 1,423 | 5.6% |
| 61 | Friendswood | 41,030 | 2,228 | 5.4% |
| 62 | Fort Worth | 963,194 | 51,639 | 5.4% |
| 63 | Hewitt | 16,432 | 810 | 4.9% |
| 64 | Richmond | 12,582 | 577 | 4.6% |
| 65 | Rockwall | 51,168 | 2,340 | 4.6% |
| 66 | Port Arthur | 55,828 | 2,492 | 4.5% |
| 67 | Corinth | 23,385 | 1,032 | 4.4% |
| 68 | Marlin | 5,516 | 242 | 4.4% |
| 69 | Mansfield | 77,510 | 3,385 | 4.4% |
| 70 | Kennedale | 9,439 | 409 | 4.3% |
| 71 | Universal City | 20,189 | 855 | 4.2% |
| 72 | Highland Village | 16,101 | 663 | 4.1% |
| 73 | Denton | 152,866 | 6,192 | 4.1% |
| 74 | Fairview | 10,783 | 436 | 4.0% |
| 75 | Highland Park | 8,773 | 345 | 3.9% |
| 76 | Vernon | 9,848 | 383 | 3.9% |
| 77 | Killeen | 158,159 | 6,119 | 3.9% |
| 78 | Beaumont | 113,279 | 4,329 | 3.8% |
| 79 | Dallas | 1,307,930 | 49,936 | 3.8% |
| 80 | Georgetown | 85,999 | 3,237 | 3.8% |
| 81 | Amarillo | 201,885 | 7,566 | 3.7% |
| 82 | North Richland Hills | 70,780 | 2,503 | 3.5% |
| 83 | Hurst | 39,861 | 1,386 | 3.5% |
| 84 | Conroe | 102,360 | 3,516 | 3.4% |
| 85 | Sealy | 7,053 | 241 | 3.4% |
| 86 | Converse | 29,607 | 1,006 | 3.4% |
| 87 | Harker Heights | 34,128 | 1,154 | 3.4% |
| 88 | Boerne | 20,518 | 665 | 3.2% |
| 89 | Saginaw | 24,970 | 794 | 3.2% |
| 90 | Anna | 24,330 | 759 | 3.1% |
| 91 | Fate | 22,884 | 699 | 3.1% |
| 92 | Nederland | 18,381 | 558 | 3.0% |
| 93 | Watauga | 23,233 | 705 | 3.0% |
| 94 | Mesquite | 149,299 | 4,463 | 3.0% |
| 95 | Athens | 13,200 | 385 | 2.9% |
| 96 | Forney | 31,532 | 917 | 2.9% |
| 97 | Bastrop | 11,156 | 323 | 2.9% |
| 98 | Helotes | 9,630 | 277 | 2.9% |
| 99 | San Antonio | 1,479,835 | 42,560 | 2.9% |
| 100 | Floresville | 8,007 | 230 | 2.9% |
Source: U.S. Census ACS 2020-2024. 324 cities with more than 5,000 residents.
Summary
Summary: Asian Populations Across Texas
If you’re looking for a breakdown of Asian populations across Texas according to the most recent data, this is an accurate list.
The most Asian cities in Texas are Sugar Land, Murphy, Coppell, Frisco, Stafford, Plano, Irving, Bellaire, Allen, and Sachse. Not sold on Texas? Take the two-minute Find Your Place quiz and see which state actually fits you.
Questions and answers
Most Asian Cities In Texas FAQs
What is the most Asian city in Texas?
Sugar Land is the most Asian city in Texas for 2026, at 38.5% of residents. Murphy and Coppell are next.
What cities in Texas have the largest Asian population?
The Texas cities with the largest Asian population shares are Sugar Land, Murphy, Coppell, Frisco, Stafford, Plano, Irving, Bellaire, Allen, and Sachse. We ranked all 324 places with more than 5,000 residents.
What percent of Sugar Land is Asian?
Asian residents make up 38.5% of Sugar Land, the highest share of the 324 Texas places we measured. The numbers come from the Census Bureau’s American Community Survey.
What is the least Asian city in Texas?
Hereford is the least Asian city in Texas, at 0.0%. It sits at the opposite end of the same ranking.
Where does this data come from?
Every share is calculated from the Census Bureau’s American Community Survey (2020-2024), based on residents identifying as Asian alone. We rank each Texas place with more than 5,000 residents.


