Most Asian cities in Virginia research summary. We analyzed Virginia’s most recent Census data to determine the most Asian cities in Virginia based on the percentage of Asian residents.
18.4% Asian · #1 most Asian in Virginia
Fairfax, colloquially Central Fairfax, Downtown Fairfax, Fairfax City, or the City of Fairfax, is an independent city in the Commonwealth of Virginia. As of the 2010 census the population was 22,565, which had risen to an estimated 24,013 as of 2015.
Data | Crime | Cost of living | Movers
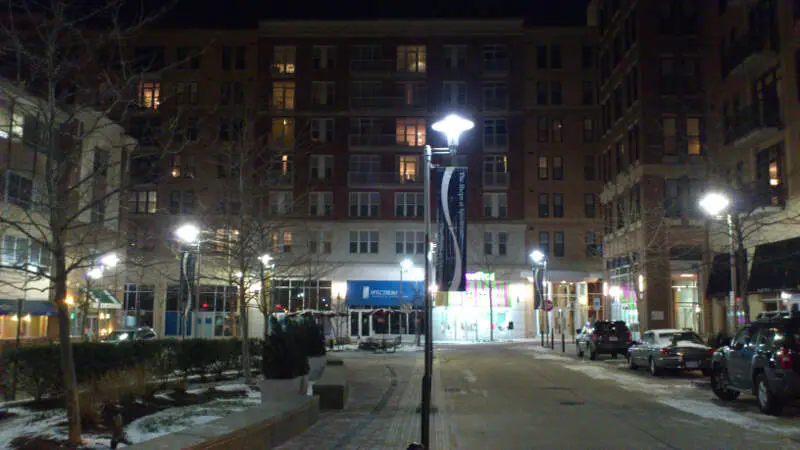
16.1% Asian · #2 most Asian in Virginia
Herndon is a town in Fairfax County, Virginia, in the Washington, D.C. metropolitan area of the United States. The population was 23,292 at the 2010 census, which makes it the largest of three incorporated towns in the county.
Data | Crime | Cost of living | Movers
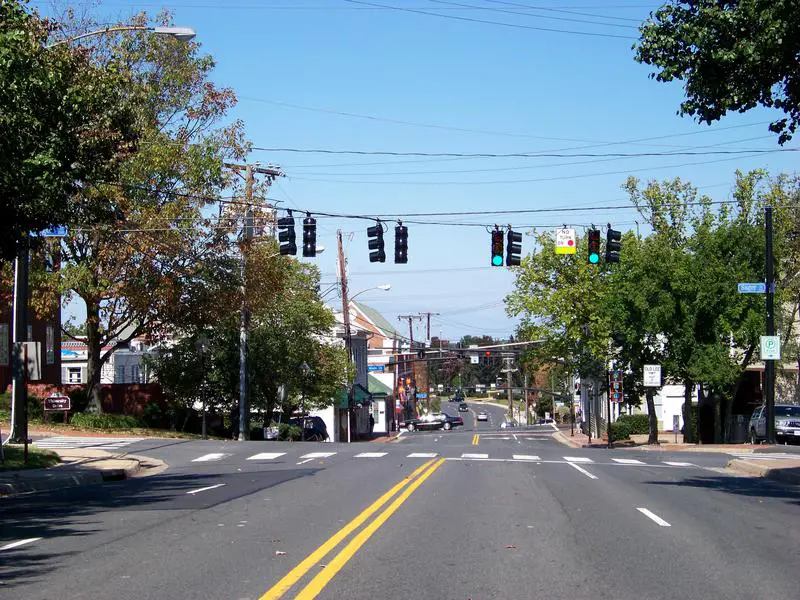
14.1% Asian · #3 most Asian in Virginia
Vienna is a town in Fairfax County, Virginia, United States. As of the 2010 United States Census, it had a population of 15,687. Significantly more people live in ZIP codes with the Vienna postal addresses bordered approximately by Interstate 66 on the south, Interstate 495 on the east, Route 7 to the north, and Hunter Mill road to the west.
Data | Crime | Cost of living | Movers
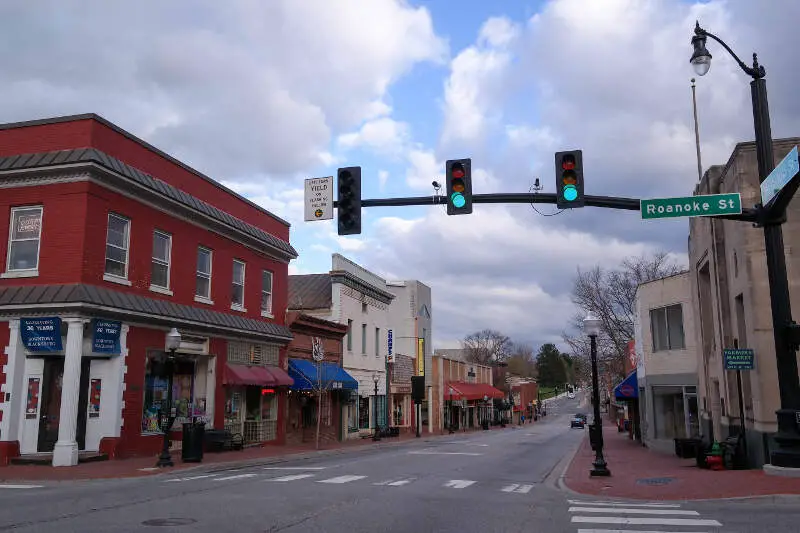
11.4% Asian · #4 most Asian in Virginia
Blacksburg is an incorporated town in Montgomery County, Virginia, United States, with a population of 42,620 at the 2010 census. Blacksburg is dominated economically and demographically by the presence of Virginia Tech.
Data | Crime | Cost of living | Movers
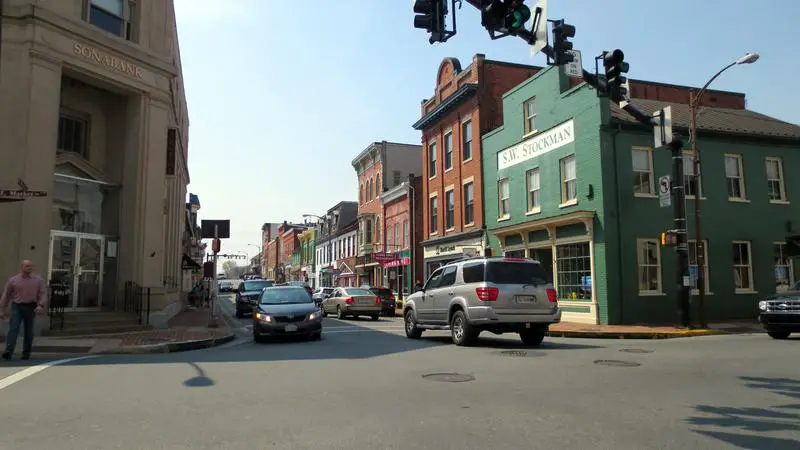
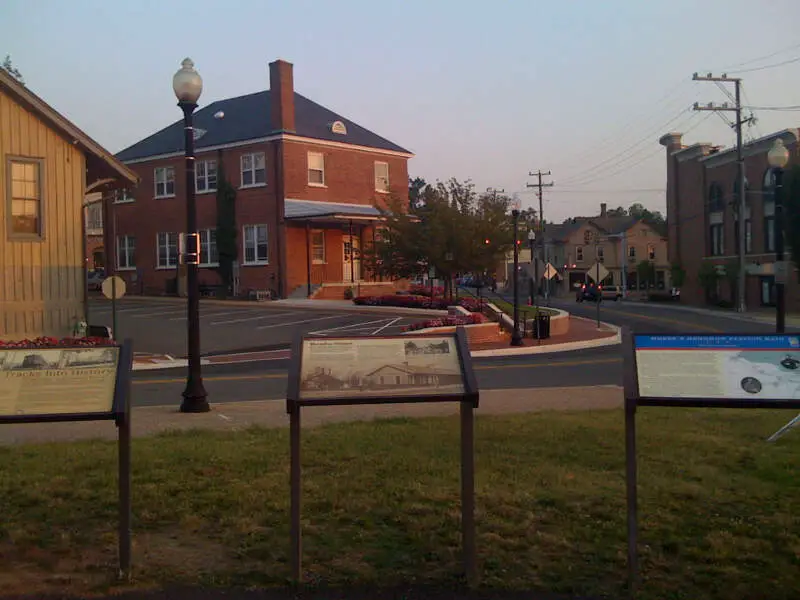
11.3% Asian · #5 most Asian in Virginia
Leesburg is a historic town within and the county seat of Loudoun County, Virginia. Leesburg is 33 miles west-northwest of Washington, D.C. along the base of Catoctin Mountain and adjacent to the Potomac River. Its population according to the 2010 Census is 42,616. The town is also the northwestern terminus of the Dulles Greenway, a private toll road that connects to the Dulles Toll Road at Washington Dulles International Airport.
Data | Crime | Cost of living | Movers
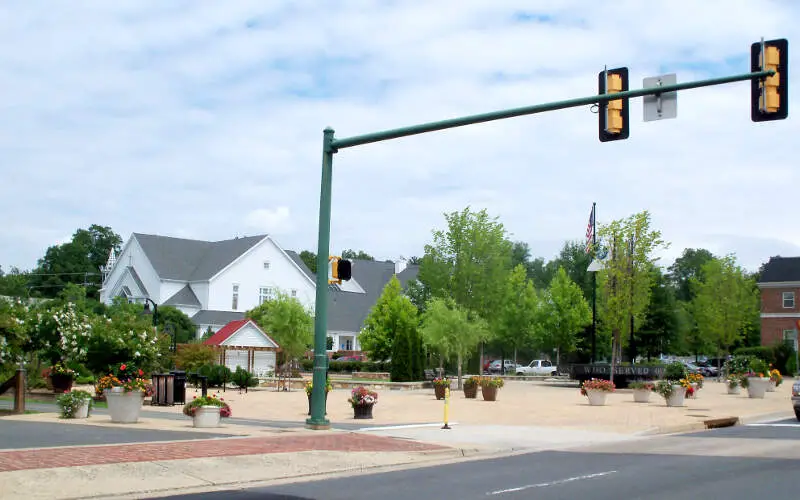
10.2% Asian · #6 most Asian in Virginia
Manassas Park is an independent city in the U.S. state of Virginia. As of the 2010 census, the population was 14,273. Manassas Park is bordered by the city of Manassas and Prince William County. Manassas Park is a part of the Washington-Arlington-Alexandria, DC-VA-MD-WV Metropolitan Statistical Area. “A” Fort and Battery Hill Redoubt-Camp Early resides in Manassas Park.
Data | Crime | Cost of living | Movers
9.1% Asian · #7 most Asian in Virginia
Falls Church is an independent city in the U.S. state of Virginia. As of the 2010 census, the population was 12,332. The estimated population in 2015 was 13,892. Falls Church is included in the Washington metropolitan area. Falls Church has the lowest level of poverty of any independent city or county in the United States.
Data | Crime | Cost of living | Movers
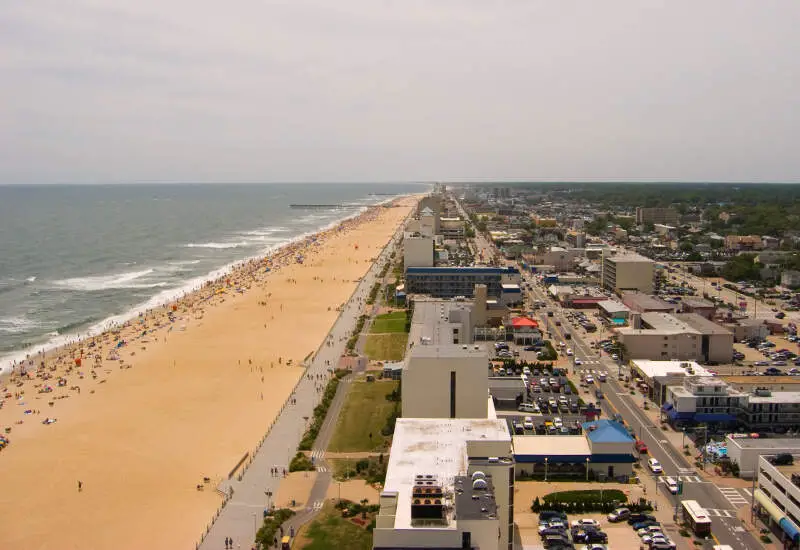
7.1% Asian · #8 most Asian in Virginia
Virginia Beach is an independent city located on the southeastern coast of the Commonwealth of Virginia. As of the 2010 census, the population was 437,994. In 2015, the population was estimated to be 452,745. Although mostly suburban in character, it is the most populous city in Virginia and the 4most populous city in the nation. Located on the Atlantic Ocean at the mouth of the Chesapeake Bay, Virginia Beach is included in the Hampton Roads metropolitan area. This area, known as “America’s First Region”, also includes the independent cities of Chesapeake, Hampton, Newport News, Norfolk, Portsmouth, and Suffolk, as well as other smaller cities, counties, and towns of Hampton Roads.
Data | Crime | Cost of living | Movers
7.0% Asian · #9 most Asian in Virginia
Charlottesville, colloquially known as Cville by locals, is an independent city in the Commonwealth of Virginia. In 2016, an estimated 46,912 people lived within the city limits. It is the county seat of Albemarle County, which surrounds the city, though the two are separate legal entities. This means a Charlottesville resident will list the City of Charlottesville as both their county and city on official paperwork. It is named after the British Queen Charlotte of Mecklenburg-Strelitz. The Bureau of Economic Analysis combines the City of Charlottesville with the County of Albemarle for statistical purposes, bringing its steadily growing population to approximately 150,000. Charlottesville is the heart of the Charlottesville metropolitan area, which includes Albemarle, Fluvanna, Greene and Nelson counties.
Data | Crime | Cost of living | Movers
6.6% Asian · #10 most Asian in Virginia
Williamsburg is an independent city in the Commonwealth of Virginia. As of the 2010 census, the population was 14,068. In 2014, the population was estimated to be 14,691.
Data | Crime | Cost of living | Movers
The receipts
Compare the top ten
Pick a metric. The bars rescale. The red line is Virginia’s statewide median.
On the map
Where Virginia’s Asian communities live
Saturday Night Science
Methodology: How We Determined The Cities In Virginia With The Largest Asian Population For 2026
We used Saturday Night Science to compare Census data on race across every place in Virginia.
The Census’s most recently available data comes from the 2020-2024 American Community Survey.
Specifically, we looked at table B03002: Hispanic OR LATINO ORIGIN BY RACE. Here are the category names as defined by the Census:
- Hispanic or Latino
- White alone*
- Black or African American alone*
- American Indian and Alaska Native alone*
- Asian alone*
- Native Hawaiian and Other Pacific Islander alone*
- Some other race alone*
- Two or more races*
Our particular column of interest here was the number of people who identified as Asian alone.
We limited our analysis to cities with a population greater than 5,000 people. That left us with 59 cities.
We then calculated the percentage of residents that are Asian. The percentages ranked from 18.4% to 0.0%.
Finally, we ranked each city based on the percentage of Asian population, with a higher percentage being more Asian. Fairfax took the distinction of being the most Asian, while Marion was the least Asian city.
We updated this article for 2026. This report reflects our eleventh time ranking the cities in Virginia with the largest Asian population.
The full plate
Cities In Virginia By Asian Population
Click any column to sort. Search by city name.
| Rank | City | Population | Asian Population | % Asian |
|---|---|---|---|---|
| 1 | Fairfax | 25,026 | 4,597 | 18.4% |
| 2 | Herndon | 24,672 | 3,961 | 16.1% |
| 3 | Vienna | 16,412 | 2,315 | 14.1% |
| 4 | Blacksburg | 45,446 | 5,200 | 11.4% |
| 5 | Leesburg | 49,171 | 5,561 | 11.3% |
| 6 | Manassas Park | 16,798 | 1,712 | 10.2% |
| 7 | Falls Church | 14,710 | 1,344 | 9.1% |
| 8 | Virginia Beach | 456,349 | 32,184 | 7.1% |
| 9 | Charlottesville | 45,437 | 3,198 | 7.0% |
| 10 | Williamsburg | 15,798 | 1,038 | 6.6% |
| 11 | Alexandria | 156,976 | 9,768 | 6.2% |
| 12 | Manassas | 42,976 | 2,386 | 5.6% |
| 13 | Fredericksburg | 28,873 | 1,140 | 3.9% |
| 14 | Chesapeake | 252,583 | 9,654 | 3.8% |
| 15 | Colonial Heights | 18,352 | 686 | 3.7% |
| 16 | Norfolk | 233,596 | 8,508 | 3.6% |
| 17 | Harrisonburg | 51,392 | 1,823 | 3.5% |
| 18 | Christiansburg | 22,720 | 802 | 3.5% |
| 19 | Lexington | 7,525 | 262 | 3.5% |
| 20 | Newport News | 184,216 | 5,995 | 3.3% |
| 21 | Roanoke | 98,355 | 3,082 | 3.1% |
| 22 | Martinsville | 13,658 | 399 | 2.9% |
| 23 | Warrenton | 10,176 | 274 | 2.7% |
| 24 | Wytheville | 8,202 | 204 | 2.5% |
| 25 | Purcellville | 8,973 | 218 | 2.4% |
| 26 | Radford | 16,726 | 406 | 2.4% |
| 27 | Hampton | 137,557 | 3,085 | 2.2% |
| 28 | Lynchburg | 79,497 | 1,775 | 2.2% |
| 29 | Winchester | 27,913 | 608 | 2.2% |
| 30 | Culpeper | 20,794 | 439 | 2.1% |
| 31 | Richmond | 229,359 | 4,775 | 2.1% |
| 32 | Salem | 25,618 | 503 | 2.0% |
| 33 | Abingdon | 8,330 | 160 | 1.9% |
| 34 | South Boston | 7,853 | 149 | 1.9% |
| 35 | Richlands | 5,171 | 97 | 1.9% |
| 36 | Suffolk | 98,796 | 1,818 | 1.8% |
| 37 | Waynesboro | 22,841 | 412 | 1.8% |
| 38 | Front Royal | 15,296 | 268 | 1.8% |
| 39 | Poquoson | 12,639 | 217 | 1.7% |
| 40 | Portsmouth | 97,190 | 1,552 | 1.6% |
| 41 | Farmville | 7,774 | 114 | 1.5% |
| 42 | Staunton | 25,948 | 361 | 1.4% |
| 43 | Covington | 5,680 | 76 | 1.3% |
| 44 | Petersburg | 33,537 | 433 | 1.3% |
| 45 | Danville | 42,214 | 503 | 1.2% |
| 46 | Bridgewater | 6,708 | 78 | 1.2% |
| 47 | Ashland | 7,772 | 90 | 1.2% |
| 48 | Strasburg | 7,214 | 79 | 1.1% |
| 49 | Hopewell | 22,959 | 247 | 1.1% |
| 50 | Vinton | 8,056 | 85 | 1.1% |
| 51 | Buena Vista | 6,593 | 62 | 0.9% |
| 52 | Pulaski | 8,893 | 61 | 0.7% |
| 53 | Emporia | 5,547 | 32 | 0.6% |
| 54 | Bristol | 16,849 | 76 | 0.5% |
| 55 | Big Stone Gap | 5,162 | 17 | 0.3% |
| 56 | Smithfield | 8,834 | 29 | 0.3% |
| 57 | Galax | 6,726 | 19 | 0.3% |
| 58 | Franklin | 8,250 | 3 | 0.0% |
| 59 | Marion | 5,670 | 0 | 0.0% |
Source: U.S. Census ACS 2020-2024. 59 cities with more than 5,000 residents.
Summary
Summary: Asian Populations Across Virginia
If you’re looking for a breakdown of Asian populations across Virginia according to the most recent data, this is an accurate list.
The most Asian cities in Virginia are Fairfax, Herndon, Vienna, Blacksburg, Leesburg, Manassas Park, Falls Church, Virginia Beach, Charlottesville, and Williamsburg.


