
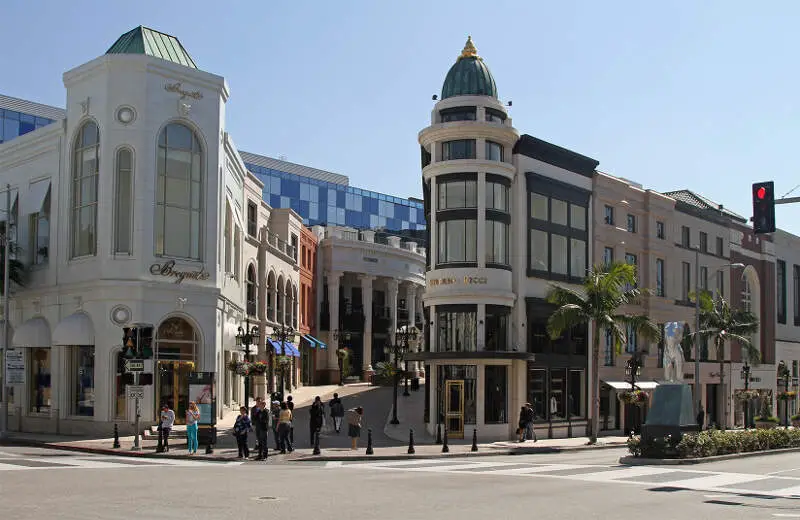
Beverly Hills, Santa Barbara, and Glendale all moved up the list of the top ten most expensive places to live in California for 2026.
But none of these places hold the number one spot.
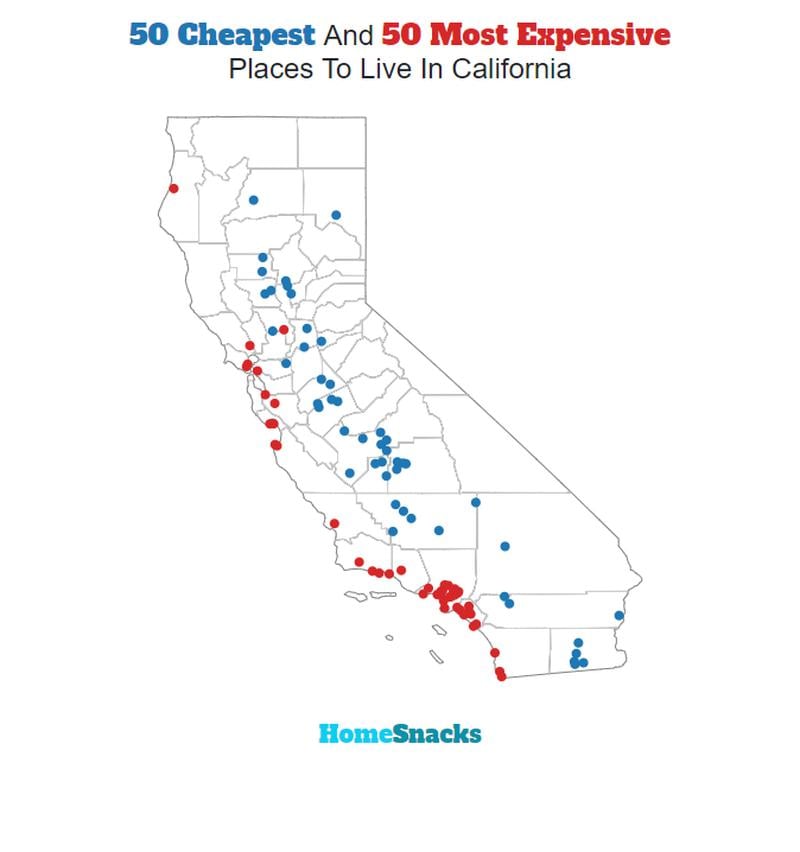
To determine the top ten most expensive places in California, we used Saturday Nightt Science to compare the cost of living and American Community Survey data for The Golden State: specifically, home to income ratio and rent to income ratio. We considered the 428 California with at least 5,000 residents. If you want to live in California’s most expensive places, you will have to make at least $132,977/year.
Many of the most expensive places on this list are some of Califonia’s best places, and that’s because these places have the funds to keep its residents happy, safe, and living their best life.
Table Of Contents: Top Ten | Methodology | Summary | Table
The 10 Most Expensive Places To Live In California For 2026
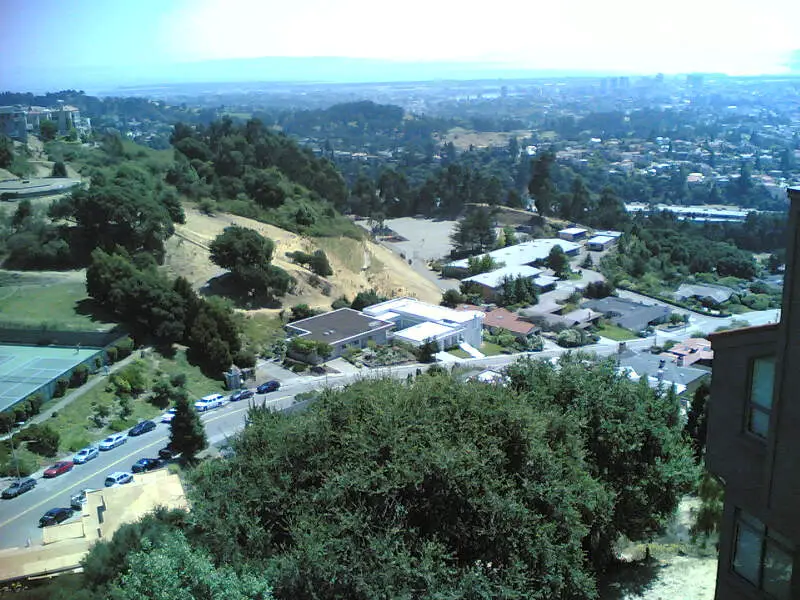
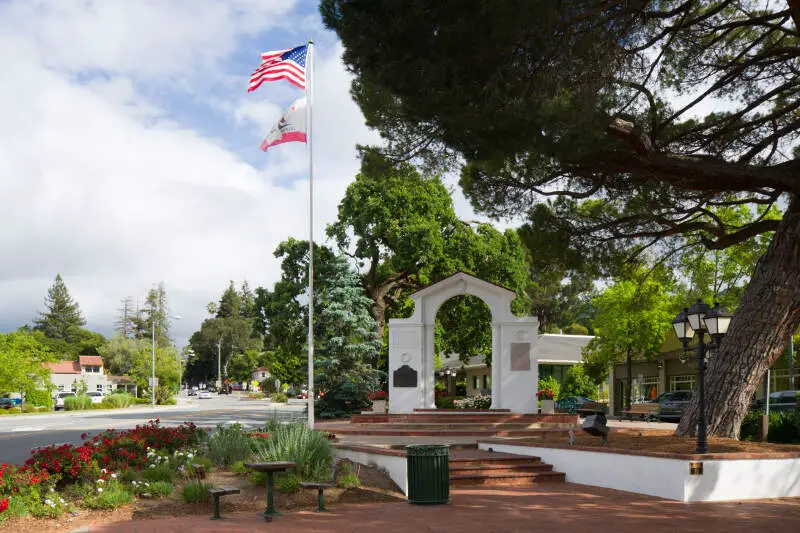
What’s the most expensive place to live in California? Well, HomeSnacks crunched the numbers and discovered that Piedmont is the most expensive place to live in California.
Blythe (the cheapest place to live in California) can show these guys how to live on a budget in the coming years. Read on for how these places had costs rise faster than inflation.
And if you already knew these places were expensive, check out some more reading about California and the most expensive cities in the country:
The 10 Most Expensive Places To Live In California For 2026

/10
Population: 10,945
Cost Of Living Index: 349
Median Income: $250,001
Average Home Price: $2,459,056
Home Price To Income Ratio: 9.8x
More on Piedmont: Data | Crime | Cost Of Living | Movers
The overall cost of living in Piedmont is 349. The median income in Piedmont comes in at $250,001 and the average home value is $2,459,056 for 2026.

/10
Population: 11,099
Cost Of Living Index: 348
Median Income: $250,001
Average Home Price: $5,279,135
Home Price To Income Ratio: 21.1x
More on Hillsborough: Data | Crime | Cost Of Living | Movers
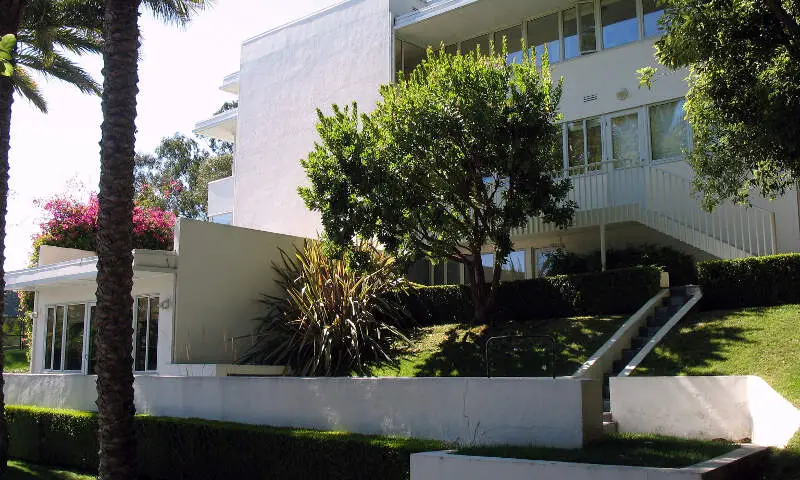
The overall cost of living in Hillsborough is 348. The median income in Hillsborough comes in at $250,001 and the average home value is $5,279,135 for 2026.

/10
Population: 6,993
Cost Of Living Index: 347
Median Income: $250,001
Average Home Price: $7,890,840
Home Price To Income Ratio: 31.6x
More on Atherton: Data | Crime | Cost Of Living | Movers
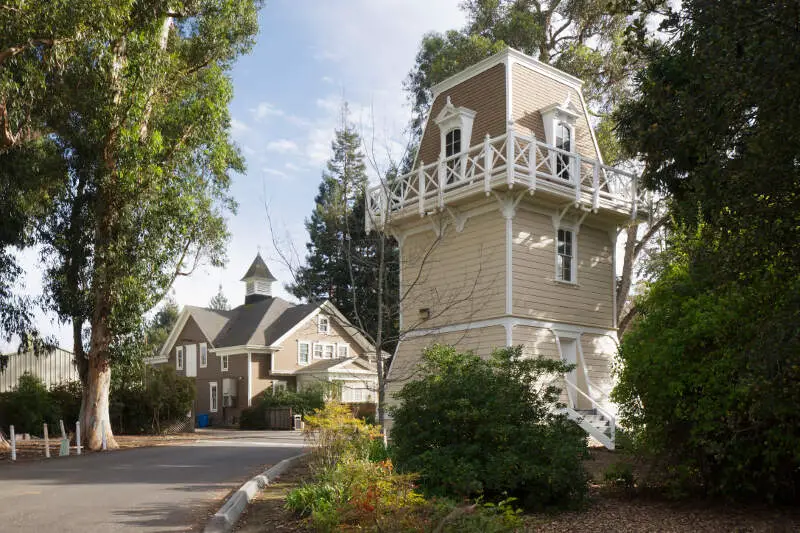
The overall cost of living in Atherton is 347. The median income in Atherton comes in at $250,001 and the average home value is $7,890,840 for 2026.

/10
Population: 5,126
Cost Of Living Index: 345
Median Income: $250,001
Average Home Price: $3,891,384
Home Price To Income Ratio: 15.6x
More on Woodside: Data | Cost Of Living | Movers
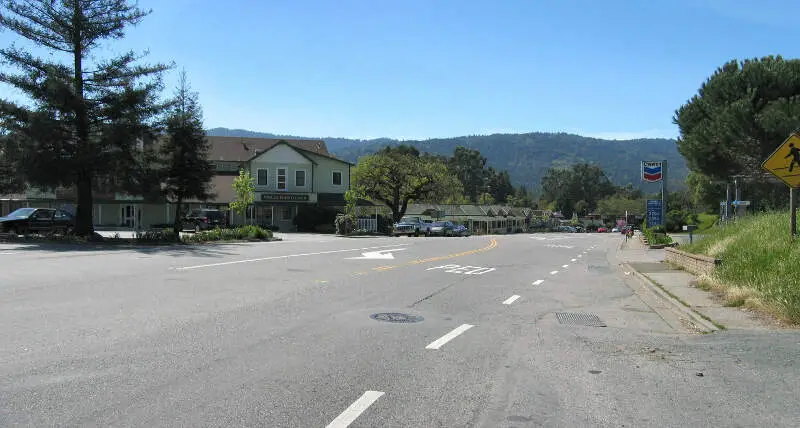
The overall cost of living in Woodside is 345. The median income in Woodside comes in at $250,001 and the average home value is $3,891,384 for 2026.

/10
Population: 9,012
Cost Of Living Index: 342
Median Income: $232,969
Average Home Price: $3,020,895
Home Price To Income Ratio: 13.0x
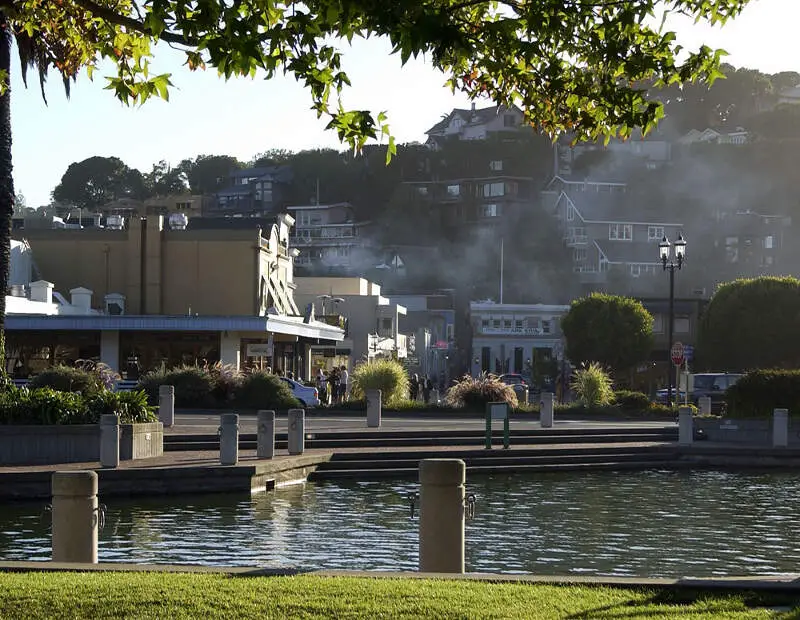
More on Tiburon: Data | Crime | Cost Of Living | Movers
The overall cost of living in Tiburon is 342. The median income in Tiburon comes in at $232,969 and the average home value is $3,020,895 for 2026.

/10
Population: 67,237
Cost Of Living Index: 341
Median Income: $231,101
Average Home Price: $3,722,200
Home Price To Income Ratio: 16.1x
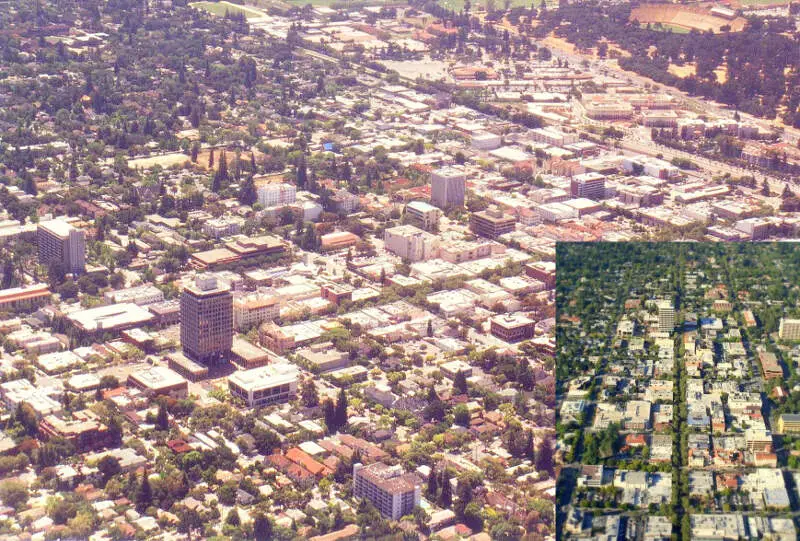
More on Palo Alto: Data | Crime | Cost Of Living | Movers
The overall cost of living in Palo Alto is 341. The median income in Palo Alto comes in at $231,101 and the average home value is $3,722,200 for 2026.

/10
Population: 30,698
Cost Of Living Index: 341
Median Income: $250,001
Average Home Price: $4,713,314
Home Price To Income Ratio: 18.9x
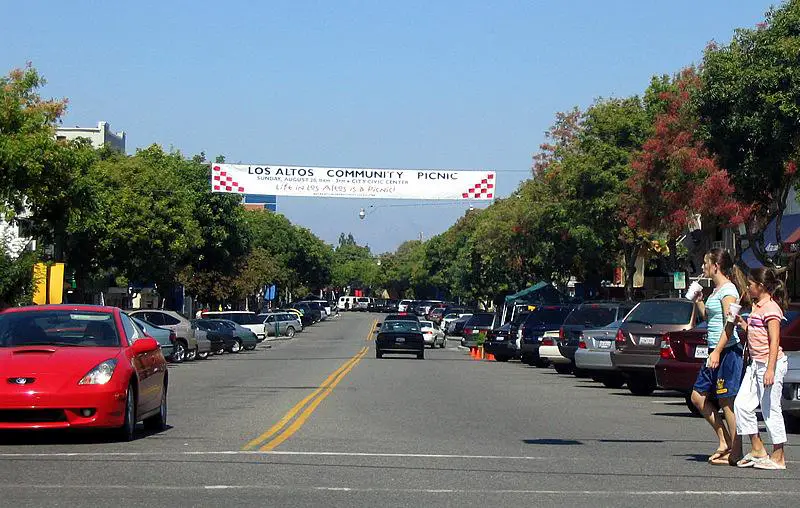
More on Los Altos: Data | Crime | Cost Of Living | Movers
The overall cost of living in Los Altos is 341. The median income in Los Altos comes in at $250,001 and the average home value is $4,713,314 for 2026.

/10
Population: 34,210
Cost Of Living Index: 340
Median Income: $204,306
Average Home Price: $3,227,202
Home Price To Income Ratio: 15.8x
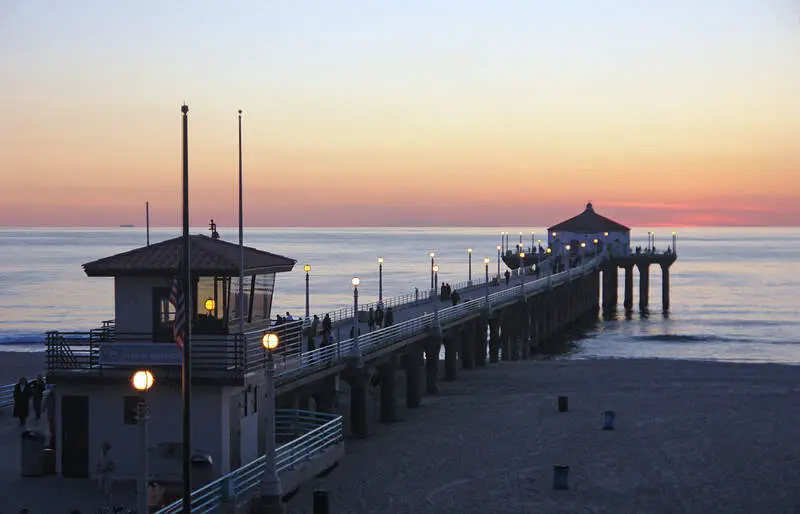
More on Manhattan Beach: Data | Crime | Cost Of Living | Movers
The overall cost of living in Manhattan Beach is 340. The median income in Manhattan Beach comes in at $204,306 and the average home value is $3,227,202 for 2026.

/10
Population: 31,624
Cost Of Living Index: 338
Median Income: $132,977
Average Home Price: $3,662,756
Home Price To Income Ratio: 27.5x
More on Beverly Hills: Data | Crime | Cost Of Living | Movers
The overall cost of living in Beverly Hills is 338. The median income in Beverly Hills comes in at $132,977 and the average home value is $3,662,756 for 2026.

/10
Population: 30,319
Cost Of Living Index: 338
Median Income: $250,001
Average Home Price: $4,189,622
Home Price To Income Ratio: 16.8x
More on Saratoga: Data | Crime | Cost Of Living | Movers
The overall cost of living in Saratoga is 338. The median income in Saratoga comes in at $250,001 and the average home value is $4,189,622 for 2026.
Methodology: How We Determined The Most Expensive Places To Live In The Golden State For 2026
The two most important things to think about when it comes to being able to afford a city in California are:
- How much money do I make?
- How much do I have to spend to live there?
You need to understand your costs in the context of how much money you make.
For example, if the median household earns $100,000 and spends $40,000 on housing, it’s actually cheaper to live there than a place with a median income of $50,000 and housing costs of $21,000. You might spend more on housing, but you have more money overall to play with.
With that example in mind, we derived several statistics from the latest Census American Community Survey 2020-2024 around incomes and costs. They are:
- Overall Cost Of Living Index
- Median Home Price / Median Income (lower is better)
- Median Income / Median Rent (Higher is better)
- Median Home Price
You can then compare these metrics in each of the places in California to figure out which is the most expensive.
You are left with a “Cost of Living Index” by taking the average rank of each of these metrics for each city.
So we used that cost of living index to rank all of the 428 places in California that have more than 5,000 people.
The place with the highest cost of living in California according to the data is Piedmont. We updated this article for 2026. This article is our eleventh time ranking the most expensive places to live in California.
Summary: Taking A Chunk Out Of Your Paycheck In California For 2026
Well, there you have it, the places in California that have the highest cost of living, with Piedmont ranking as the most expensive city in the Golden State.
The most expensive cities in California are Piedmont, Hillsborough, Atherton, Woodside, Tiburon, Palo Alto, Los Altos, Manhattan Beach, Beverly Hills, and Saratoga.
Here’s a look at the most affordable cities in California according to the data:
- Blythe
- Susanville
- Calipatria
For more California reading, check out:
- Best Places To Live In California
- Cheapest Places To Live In California
- Most Dangerous Cities In California
- Best Places To Raise A Family In California
- Safest Places In California
- Worst Places To Live In California
Most Expensive Cities In California
| Rank | City | Cost Of Living | Population | Median Income | Average Home Price | Home/Income Ratio |
|---|---|---|---|---|---|---|
| 1 | Piedmont | 349 | 10,945 | $250,001 | $2,459,056 | 9.8x |
| 2 | Hillsborough | 348 | 11,099 | $250,001 | $5,279,135 | 21.1x |
| 3 | Atherton | 347 | 6,993 | $250,001 | $7,890,840 | 31.6x |
| 4 | Woodside | 345 | 5,126 | $250,001 | $3,891,384 | 15.6x |
| 5 | Tiburon | 342 | 9,012 | $232,969 | $3,020,895 | 13.0x |
| 6 | Palo Alto | 341 | 67,237 | $231,101 | $3,722,200 | 16.1x |
| 7 | Los Altos | 341 | 30,698 | $250,001 | $4,713,314 | 18.9x |
| 8 | Manhattan Beach | 340 | 34,210 | $204,306 | $3,227,202 | 15.8x |
| 9 | Beverly Hills | 338 | 31,624 | $132,977 | $3,662,756 | 27.5x |
| 10 | Saratoga | 338 | 30,319 | $250,001 | $4,189,622 | 16.8x |
| 11 | Newport Beach | 337 | 83,845 | $156,867 | $3,625,145 | 23.1x |
| 12 | Menlo Park | 337 | 32,727 | $210,025 | $2,865,158 | 13.6x |
| 13 | Burlingame | 337 | 30,525 | $174,000 | $2,761,629 | 15.9x |
| 14 | Malibu | 337 | 10,421 | $194,421 | $3,142,247 | 16.2x |
| 15 | Los Altos Hills | 337 | 8,377 | $250,001 | $6,102,344 | 24.4x |
| 16 | San Marino | 335 | 12,216 | $214,167 | $2,837,216 | 13.2x |
| 17 | Palos Verdes Estates | 331 | 12,925 | $242,014 | $2,763,820 | 11.4x |
| 18 | Cupertino | 329 | 58,566 | $234,707 | $3,189,451 | 13.6x |
| 19 | Laguna Beach | 324 | 22,710 | $143,843 | $2,949,835 | 20.5x |
| 20 | San Carlos | 311 | 29,614 | $237,470 | $2,459,877 | 10.4x |
| 21 | Los Gatos | 306 | 32,786 | $217,554 | $2,705,289 | 12.4x |
| 22 | Coronado | 300 | 19,015 | $134,534 | $2,508,030 | 18.6x |
| 23 | Mill Valley | 293 | 14,012 | $206,212 | $2,073,166 | 10.1x |
| 24 | Hermosa Beach | 290 | 19,063 | $166,442 | $2,245,351 | 13.5x |
| 25 | Villa Park | 290 | 5,748 | $202,245 | $2,343,977 | 11.6x |
| 26 | Sausalito | 289 | 7,141 | $182,357 | $1,505,306 | 8.3x |
| 27 | Millbrae | 288 | 22,689 | $163,476 | $2,082,464 | 12.7x |
| 28 | Mountain View | 287 | 83,732 | $189,917 | $2,037,086 | 10.7x |
| 29 | Belmont | 286 | 27,337 | $205,297 | $2,332,686 | 11.4x |
| 30 | Lafayette | 281 | 25,285 | $228,250 | $1,934,580 | 8.5x |
| 31 | Foster City | 275 | 32,792 | $199,143 | $1,911,067 | 9.6x |
| 32 | Santa Monica | 274 | 91,169 | $114,885 | $1,703,947 | 14.8x |
| 33 | Orinda | 274 | 19,514 | $250,001 | $1,985,116 | 7.9x |
| 34 | Rolling Hills Estates | 274 | 8,131 | $191,895 | $1,901,413 | 9.9x |
| 35 | Sunnyvale | 271 | 154,236 | $186,170 | $2,168,909 | 11.7x |
| 36 | Redwood City | 267 | 82,447 | $157,814 | $1,897,528 | 12.0x |
| 37 | Solana Beach | 257 | 12,823 | $152,167 | $2,183,118 | 14.3x |
| 38 | Larkspur | 256 | 12,854 | $140,417 | $2,129,544 | 15.2x |
| 39 | Corte Madera | 253 | 10,077 | $232,763 | $1,838,958 | 7.9x |
| 40 | St. Helena | 251 | 5,318 | $148,750 | $1,633,317 | 11.0x |
| 41 | San Mateo | 250 | 103,105 | $153,504 | $1,686,905 | 11.0x |
| 42 | San Francisco | 247 | 830,235 | $140,970 | $1,356,661 | 9.6x |
| 43 | Rancho Palos Verdes | 243 | 40,864 | $179,623 | $1,824,947 | 10.2x |
| 44 | Santa Clara | 242 | 130,256 | $178,958 | $1,782,191 | 10.0x |
| 45 | Moraga | 242 | 16,769 | $216,193 | $1,666,829 | 7.7x |
| 46 | Calabasas | 240 | 22,669 | $165,288 | $1,722,904 | 10.4x |
| 47 | El Segundo | 235 | 16,769 | $150,737 | $1,759,407 | 11.7x |
| 48 | San Anselmo | 235 | 12,679 | $173,641 | $1,647,301 | 9.5x |
| 49 | Campbell | 234 | 42,781 | $145,268 | $1,977,422 | 13.6x |
| 50 | Danville | 233 | 43,401 | $232,216 | $1,908,520 | 8.2x |
| 51 | Pleasanton | 232 | 76,960 | $190,124 | $1,601,646 | 8.4x |
| 52 | South Pasadena | 229 | 26,068 | $127,175 | $1,692,677 | 13.3x |
| 53 | Fremont | 227 | 228,295 | $181,506 | $1,543,131 | 8.5x |
| 54 | Half Moon Bay | 227 | 11,391 | $157,884 | $1,573,307 | 10.0x |
| 55 | Westlake Village | 225 | 7,743 | $179,954 | $1,585,474 | 8.8x |
| 56 | Santa Barbara | 223 | 87,779 | $106,182 | $1,834,094 | 17.3x |
| 57 | Arcadia | 223 | 55,170 | $113,516 | $1,414,450 | 12.5x |
| 58 | Berkeley | 222 | 120,257 | $108,092 | $1,443,683 | 13.4x |
| 59 | San Ramon | 221 | 85,993 | $196,161 | $1,543,534 | 7.9x |
| 60 | La Habra Heights | 219 | 5,478 | $179,583 | $1,399,870 | 7.8x |
| 61 | Milpitas | 218 | 78,578 | $178,798 | $1,502,890 | 8.4x |
| 62 | Sierra Madre | 217 | 10,940 | $143,547 | $1,437,492 | 10.0x |
| 63 | San Jose | 216 | 990,138 | $146,427 | $1,463,614 | 10.0x |
| 64 | Dublin | 215 | 70,803 | $214,385 | $1,305,295 | 6.1x |
| 65 | San Bruno | 214 | 42,307 | $141,272 | $1,327,402 | 9.4x |
| 66 | Redondo Beach | 213 | 69,291 | $150,245 | $1,500,192 | 10.0x |
| 67 | Encinitas | 213 | 61,480 | $162,229 | $1,889,066 | 11.6x |
| 68 | Pacifica | 212 | 37,261 | $160,523 | $1,284,847 | 8.0x |
| 69 | San Rafael | 211 | 60,433 | $119,435 | $1,319,431 | 11.0x |
| 70 | East Palo Alto | 211 | 29,069 | $113,493 | $1,034,440 | 9.1x |
| 71 | Irvine | 209 | 311,690 | $136,719 | $1,557,981 | 11.4x |
| 72 | Dana Point | 208 | 32,790 | $141,520 | $1,736,392 | 12.3x |
| 73 | Alameda | 207 | 77,238 | $137,697 | $1,155,483 | 8.4x |
| 74 | Culver City | 207 | 39,931 | $117,389 | $1,301,741 | 11.1x |
| 75 | San Clemente | 206 | 63,273 | $140,062 | $1,721,005 | 12.3x |
| 76 | Santa Cruz | 206 | 61,607 | $115,475 | $1,344,332 | 11.6x |
| 77 | South San Francisco | 205 | 64,305 | $136,578 | $1,242,213 | 9.1x |
| 78 | Albany | 205 | 19,414 | $144,107 | $1,261,176 | 8.8x |
| 79 | Laguna Niguel | 204 | 64,139 | $140,452 | $1,499,545 | 10.7x |
| 80 | Daly City | 203 | 101,964 | $123,547 | $1,143,595 | 9.3x |
| 81 | Union City | 203 | 67,464 | $133,715 | $1,276,126 | 9.5x |
| 82 | Yorba Linda | 203 | 67,170 | $157,582 | $1,419,512 | 9.0x |
| 83 | El Cerrito | 203 | 25,994 | $127,876 | $1,142,478 | 8.9x |
| 84 | Agoura Hills | 203 | 19,721 | $171,302 | $1,259,726 | 7.4x |
| 85 | Carlsbad | 202 | 114,373 | $142,748 | $1,370,648 | 9.6x |
| 86 | Morgan Hill | 202 | 45,425 | $163,920 | $1,356,869 | 8.3x |
| 87 | Clayton | 202 | 10,937 | $175,707 | $1,057,924 | 6.0x |
| 88 | Fairfax | 200 | 7,516 | $141,653 | $1,213,199 | 8.6x |
| 89 | Livermore | 199 | 85,522 | $160,775 | $1,122,822 | 7.0x |
| 90 | Walnut | 199 | 27,611 | $129,449 | $1,197,951 | 9.3x |
| 91 | Pasadena | 198 | 136,969 | $105,192 | $1,209,228 | 11.5x |
| 92 | Costa Mesa | 198 | 110,330 | $111,505 | $1,413,322 | 12.7x |
| 93 | Walnut Creek | 198 | 70,088 | $130,432 | $1,045,017 | 8.0x |
| 94 | Pacific Grove | 197 | 14,951 | $106,065 | $1,405,345 | 13.2x |
| 95 | Torrance | 196 | 142,130 | $116,217 | $1,124,931 | 9.7x |
| 96 | Scotts Valley | 196 | 12,044 | $143,750 | $1,260,977 | 8.8x |
| 97 | Glendale | 195 | 190,748 | $88,393 | $1,201,879 | 13.6x |
| 98 | Novato | 195 | 52,546 | $115,736 | $1,078,523 | 9.3x |
| 99 | Huntington Beach | 194 | 195,240 | $120,919 | $1,366,657 | 11.3x |
| 100 | Newark | 194 | 46,903 | $169,064 | $1,260,997 | 7.5x |