
Most Native American places in Arizona research summary. We used Saturday Night Science to research the Arizona cities with the highest percentage of Native American residents for 2026. The data comes from the American Community Survey 2020-2024 vintage, which breaks down race by origin.
-
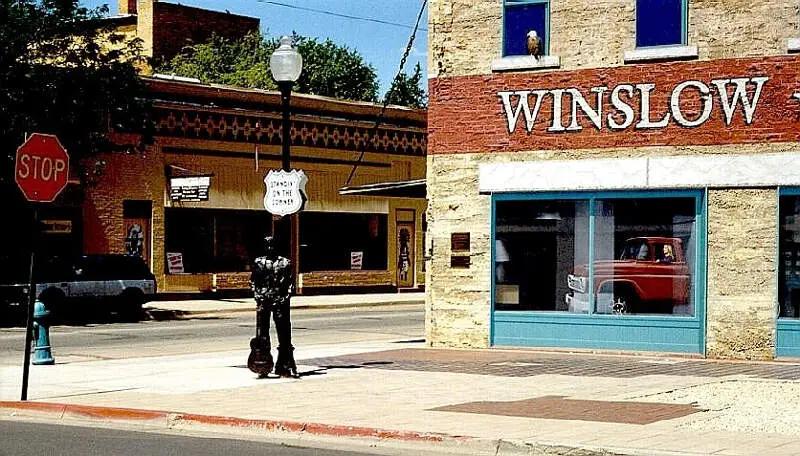
The city with the highest percentage of Native Americans is Winslow. 37.98% of people in Winslow are Native Americans.
-
The city with the lowest percentage of Native Americans is Paradise Valley. 0.09% of people in Paradise Valley are Native American.
-
The city with the most Native Americans is Phoenix. 23,063 people in Phoenix are Native American.
-
The city with the fewest Native Americans is Paradise Valley. 11 people in Paradise Valley are Native American.
-
The United States has 1,698,432 Native Americans and is 0.51% Native American.
Table Of Contents: Top Ten | Methodology | Summary | Table
The 10 Cities In Arizona With The Largest Native American Population For 2026
Which city in Arizona had the largest Native American population? The place with the largest Native American population in Arizona for 2026 is Winslow. 37.98 of Winslow identify as Native American.
To see where Arizona ranked as a state on diversity, we have a ranking of the most diverse states in America.
And if you already knew these places were Native American, check out the best places to live in Arizona or the most diverse places in Arizona.
Read below to see how we crunched the numbers and how your town ranked.
Cities In Arizona With The Largest Native American Population For 2026

/10
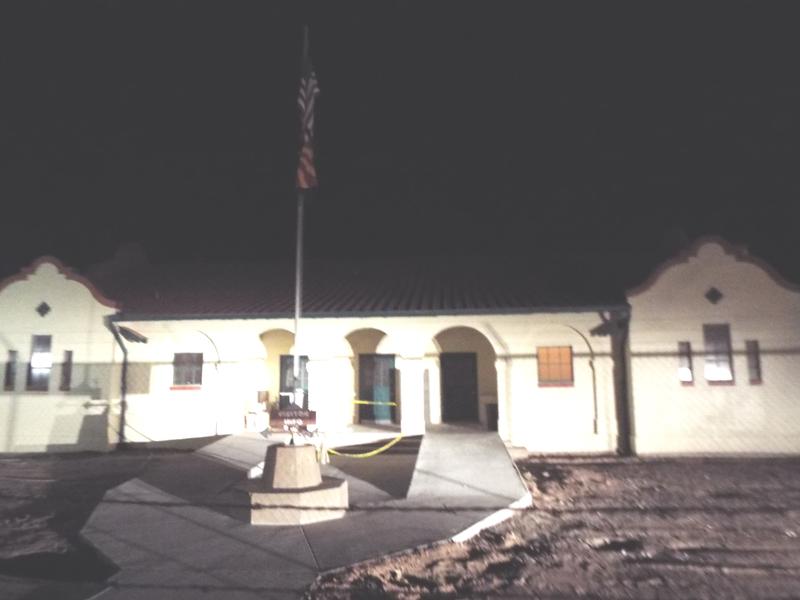
Population: 8,773
# Of Native American Residents: 3,332
% Native American: 37.98%
More on Winslow: Data | Crime | Cost Of Living | Movers

/10
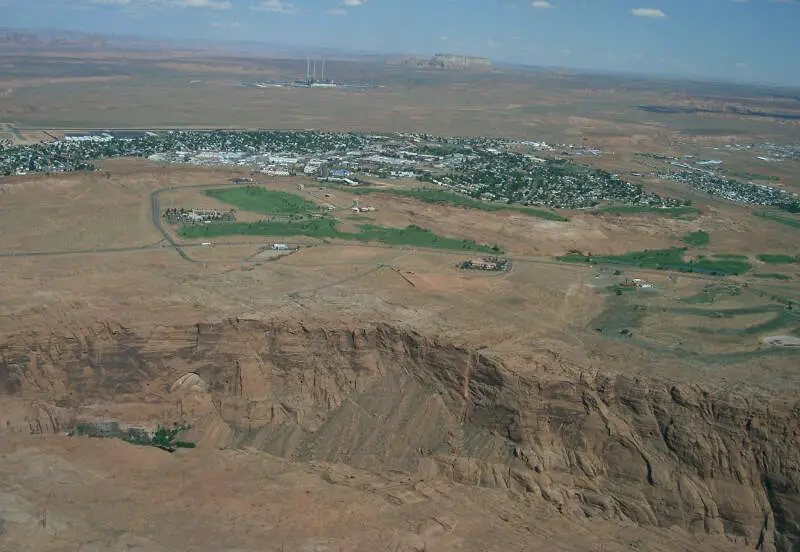
Population: 7,345
# Of Native American Residents: 2,626
% Native American: 35.75%
More on Page: Data | Crime | Cost Of Living | Movers

/10
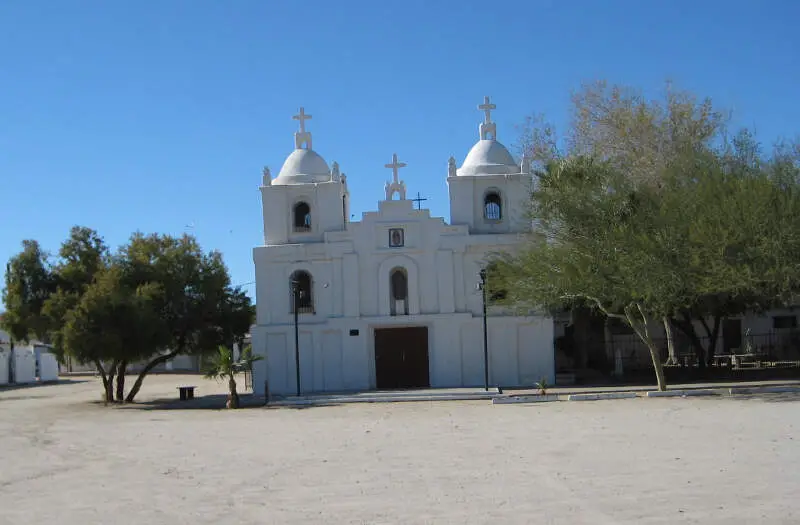
Population: 5,272
# Of Native American Residents: 974
% Native American: 18.47%
More on Guadalupe: Data | Cost Of Living | Movers

/10
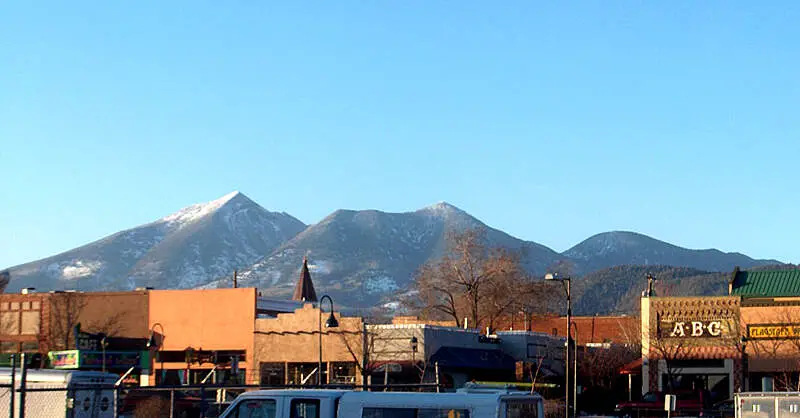
Population: 76,445
# Of Native American Residents: 9,803
% Native American: 12.82%
More on Flagstaff: Data | Crime | Cost Of Living | Movers

/10
Population: 12,521
# Of Native American Residents: 835
% Native American: 6.67%
More on Camp Verde: Data | Crime | Cost Of Living | Movers

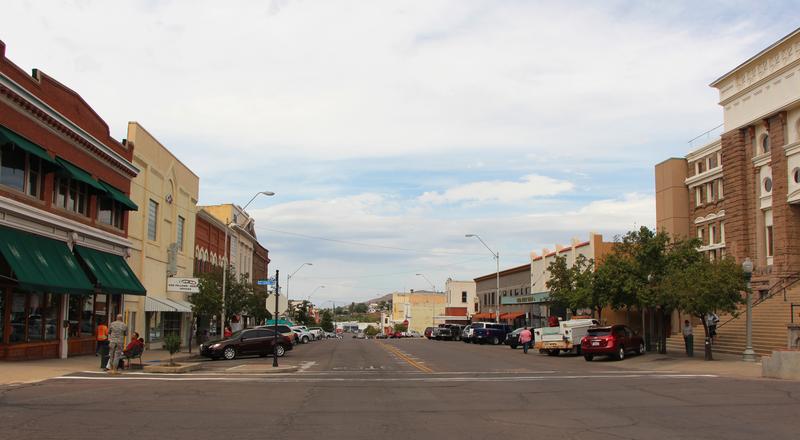
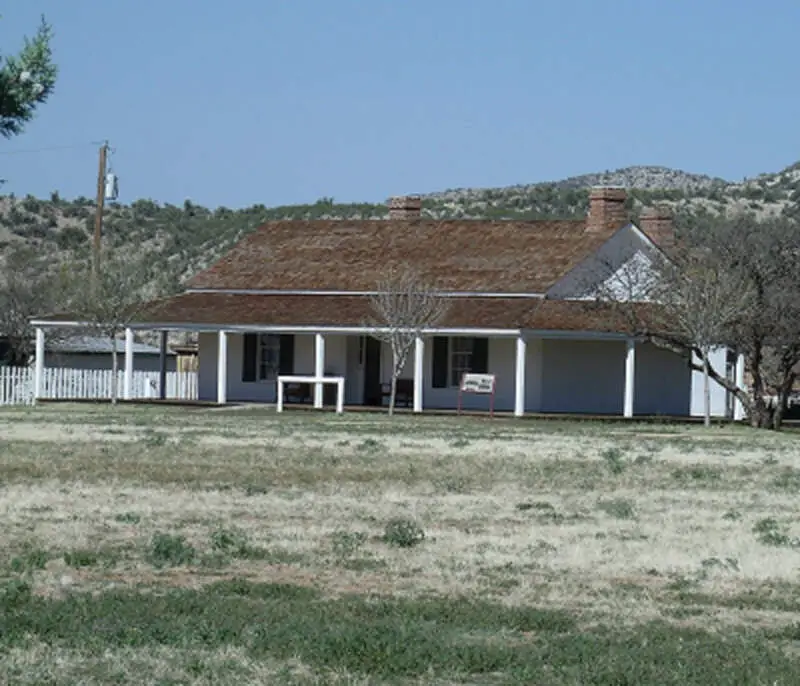
/10
Population: 7,195
# Of Native American Residents: 373
% Native American: 5.18%
More on Globe: Data | Crime | Cost Of Living | Movers

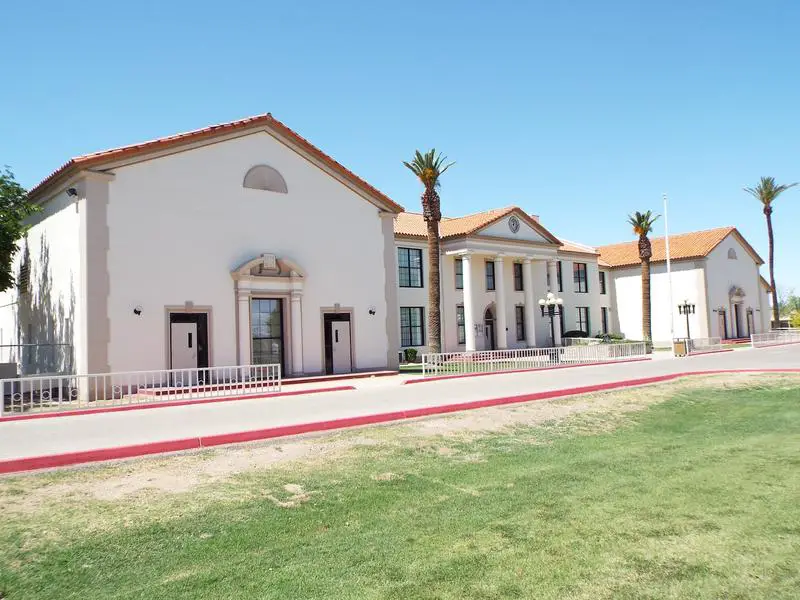
/10
Population: 16,636
# Of Native American Residents: 753
% Native American: 4.53%
More on Coolidge: Data | Crime | Cost Of Living | Movers

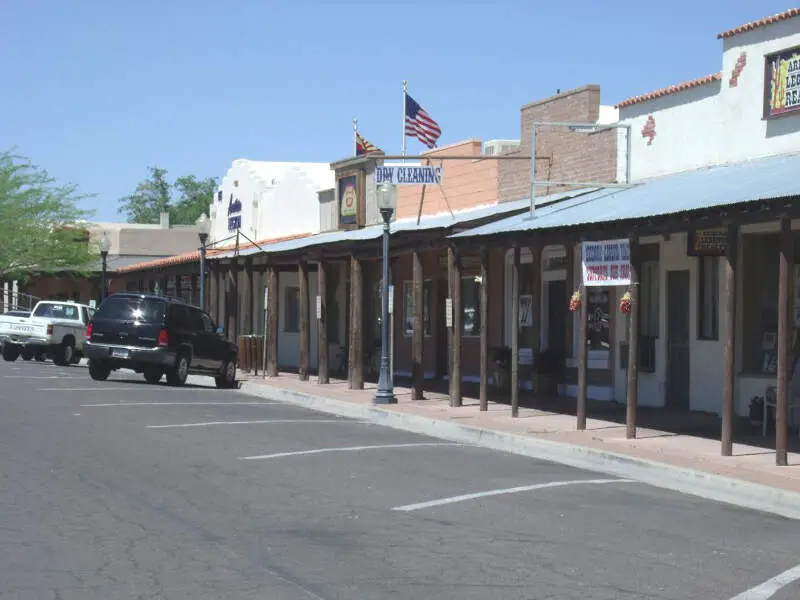
/10
Population: 8,059
# Of Native American Residents: 250
% Native American: 3.1%
More on Wickenburg: Data | Crime | Cost Of Living | Movers

/10
Population: 17,433
# Of Native American Residents: 531
% Native American: 3.05%
More on Eloy: Data | Cost Of Living | Movers

/10
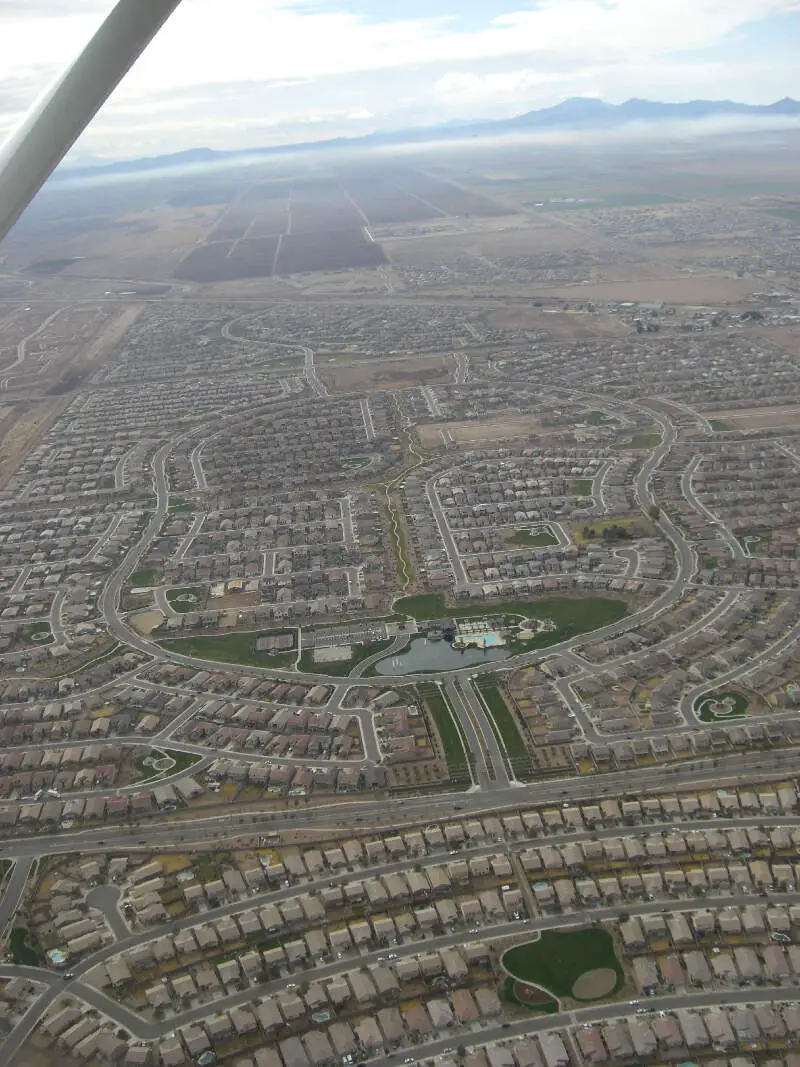
Population: 67,163
# Of Native American Residents: 1,565
% Native American: 2.33%
More on Maricopa: Data | Crime | Cost Of Living | Movers
Methodology: How We Determined The Cities In Arizona With The Largest Native American Population For 2026
We still believe in the accuracy of data — especially from the Census. So that’s where we went to get the race breakdown across Arizona.
We used Saturday Night Science to analyze the Census’s most recently available data, the 2020-2024 American Community Survey data.
Specifically, we looked at table B03002: Hispanic OR LATINO ORIGIN BY RACE. Here are the category names as defined by the Census:
- Hispanic or Latino
- White alone*
- Black or African American alone*
- American Indian and Alaska Native alone*
- Asian alone*
- Native Hawaiian and Other Pacific Islander alone*
- Some other race alone*
- Two or more races*
Our particular column of interest here was the number of people identifying as American Indian and Alaska Native alone.
We limited our analysis to places with a population greater than 5,000 people. That left us with 54 cities.
We then calculated the percentage of residents that are American Indian and Alaska Native. The percentages ranked from 37.98 to 0.09.
Finally, we ranked each city based on the percentage of the American Indian and Alaska Native population, with a higher score being more American Indian and Alaska Native than a lower score. Winslow took the distinction of being the most American Indian and Alaska Native, while Paradise Valley was the least Native American city.
We updated this article for 2026. This article is our eleventh time ranking the cities in Arizona with the largest Native American population.
Summary: Native American Populations Across Arizona
If you’re looking for a breakdown of Native American populations across Arizona according to the most recent data, this is an accurate list.
The most Native American cities in Arizona are Winslow, Page, Guadalupe, Flagstaff, Camp Verde, Globe, Coolidge, Wickenburg, Eloy, and Maricopa.
If you’re curious enough, here are the least Native American places in Arizona:
- Paradise Valley
- Oro Valley
- Sahuarita
For more Arizona reading, check out:
- Best Places To Retire In Arizona
- Best Counties To Live In Arizona
- Best Places To Buy A House In Arizona
Most Native American Places In Arizona
| Rank | City | Population | Native American Population | % Native American |
|---|---|---|---|---|
| 1 | Winslow | 8,773 | 3,332 | 37.98% |
| 2 | Page | 7,345 | 2,626 | 35.75% |
| 3 | Guadalupe | 5,272 | 974 | 18.47% |
| 4 | Flagstaff | 76,445 | 9,803 | 12.82% |
| 5 | Camp Verde | 12,521 | 835 | 6.67% |
| 6 | Globe | 7,195 | 373 | 5.18% |
| 7 | Coolidge | 16,636 | 753 | 4.53% |
| 8 | Wickenburg | 8,059 | 250 | 3.1% |
| 9 | Eloy | 17,433 | 531 | 3.05% |
| 10 | Maricopa | 67,163 | 1,565 | 2.33% |
| 11 | Florence | 25,570 | 588 | 2.3% |
| 12 | Casa Grande | 60,905 | 1,166 | 1.91% |
| 13 | Tempe | 188,065 | 3,384 | 1.8% |
| 14 | Phoenix | 1,642,323 | 23,063 | 1.4% |
| 15 | El Mirage | 36,088 | 468 | 1.3% |
| 16 | Mesa | 511,764 | 6,618 | 1.29% |
| 17 | Chandler | 280,136 | 3,588 | 1.28% |
| 18 | Tucson | 547,073 | 6,800 | 1.24% |
| 19 | Show Low | 12,102 | 143 | 1.18% |
| 20 | Avondale | 92,477 | 1,010 | 1.09% |
| 21 | Goodyear | 107,645 | 1,116 | 1.04% |
| 22 | Benson | 5,417 | 56 | 1.03% |
| 23 | Douglas | 15,981 | 140 | 0.88% |
| 24 | Glendale | 252,833 | 2,193 | 0.87% |
| 25 | Tolleson | 7,668 | 66 | 0.86% |
| 26 | Kingman | 34,375 | 274 | 0.8% |
| 27 | Marana | 56,938 | 431 | 0.76% |
| 28 | Gilbert | 280,262 | 1,970 | 0.7% |
| 29 | Yuma | 100,139 | 695 | 0.69% |
| 30 | Snowflake | 6,444 | 44 | 0.68% |
| 31 | Prescott | 47,400 | 314 | 0.66% |
| 32 | Prescott Valley | 49,179 | 324 | 0.66% |
| 33 | San Luis | 37,337 | 226 | 0.61% |
| 34 | Payson | 16,622 | 100 | 0.6% |
| 35 | Cottonwood | 12,580 | 71 | 0.56% |
| 36 | Chino Valley | 13,602 | 76 | 0.56% |
| 37 | Peoria | 196,906 | 1,092 | 0.55% |
| 38 | Youn | 7,015 | 38 | 0.54% |
| 39 | Surprise | 154,948 | 818 | 0.53% |
| 40 | Scottsdale | 243,821 | 1,266 | 0.52% |
| 41 | Apache Junction | 41,058 | 203 | 0.49% |
| 42 | Bullhead City | 42,496 | 202 | 0.48% |
| 43 | Sedona | 9,777 | 44 | 0.45% |
| 44 | Somerton | 14,574 | 57 | 0.39% |
| 45 | Sierra Vista | 45,155 | 155 | 0.34% |
| 46 | Queen Creek | 71,867 | 214 | 0.3% |
| 47 | Litchfield Park | 6,916 | 20 | 0.29% |
| 48 | Lake Havasu City | 58,359 | 158 | 0.27% |
| 49 | Nogales | 19,841 | 31 | 0.16% |
| 50 | Fountain Hills | 23,789 | 34 | 0.14% |
| 51 | Safford | 10,239 | 12 | 0.12% |
| 52 | Sahuarita | 35,862 | 37 | 0.1% |
| 53 | Oro Valley | 48,162 | 43 | 0.09% |
| 54 | Paradise Valley | 12,611 | 11 | 0.09% |