The unfortunate fact of the matter is that some places in the Buckeye State have a larger percent of their population that never graduated from high school.
While the emphasis on going to college might be overblown, the fact is that not graduating from high school puts you at a significant disadvantage on average. Educational attainment might not be the best way to measure one person’s intelligence, but it does shine a light on the state.
We will use Saturday Night Science to determine what places in Ohio have the highest percentage of adults without a high school degree.
A recent study we published found that Ohio is the 18th smartest state in the United States, with an average IQ of 101.
But that doesn’t mean that a few cities in Ohio are a bit slower than others due to a lack of basic education.

#1 dumbest in Ohio
Uhrichsville is a city in Tuscarawas County, Ohio, United States. The population was 5,413 at the 2010 census. Claymont City School District is the major education provider for the city of Uhrichsville and for the village of Dennison, Ohio. The Twin cities is a nickname used to describe Uhrichsville and Dennison because they are adjacent and similar.
Data | Crime | Cost of living | Movers
#2 dumbest in Ohio
Grafton is a village in Lorain County, Ohio, United States, along the East Branch of the Black River. The population was 6,636 at the 2010 census. The Lorain Correctional Institution and several other prisons are located in and near Grafton.
Data | Crime | Cost of living | Movers
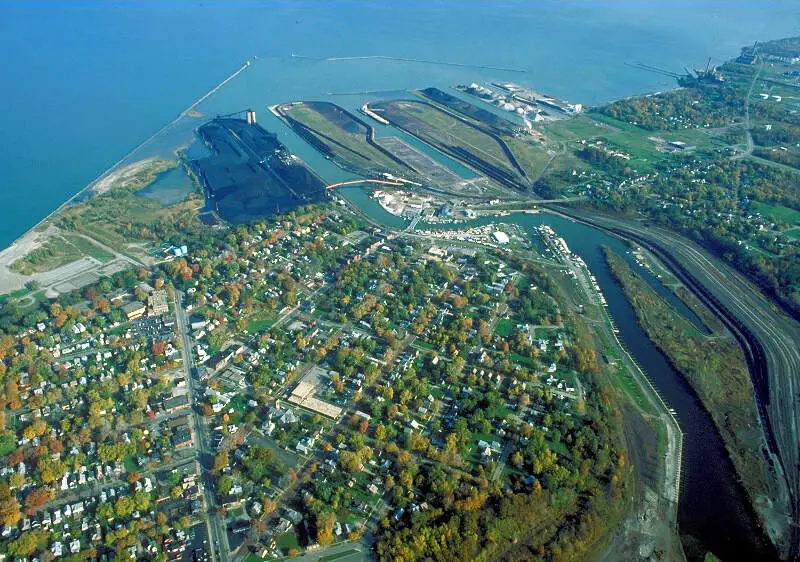
#3 dumbest in Ohio
Ashtabula ash-t-BEW-l is a city in Ashtabula County, Ohio, United States, and the center of the Ashtabula Micropolitan Statistical Area. It is located at the mouth of the Ashtabula River on Lake Erie, one of the Great Lakes, across from the province of Ontario, Canada. The name Ashtabula is derived from ashtepihle, which means ‘always enough fish to be shared around’ in the Lenape language.
Data | Crime | Cost of living | Movers
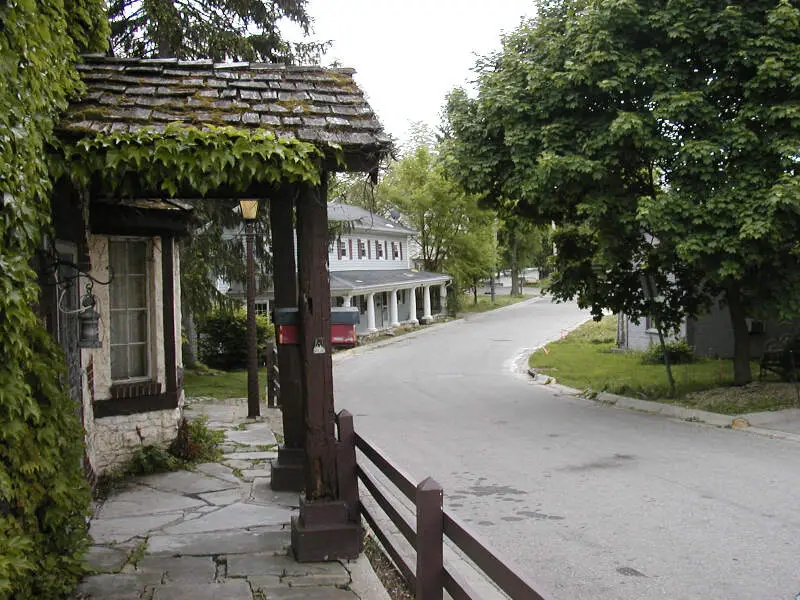
#4 dumbest in Ohio
New Carlisle is a city in Clark County, Ohio, United States. The population was 5,785 at the 2010 census. It is part of the Springfield, Ohio Metropolitan Statistical Area.
Data | Crime | Cost of living | Movers
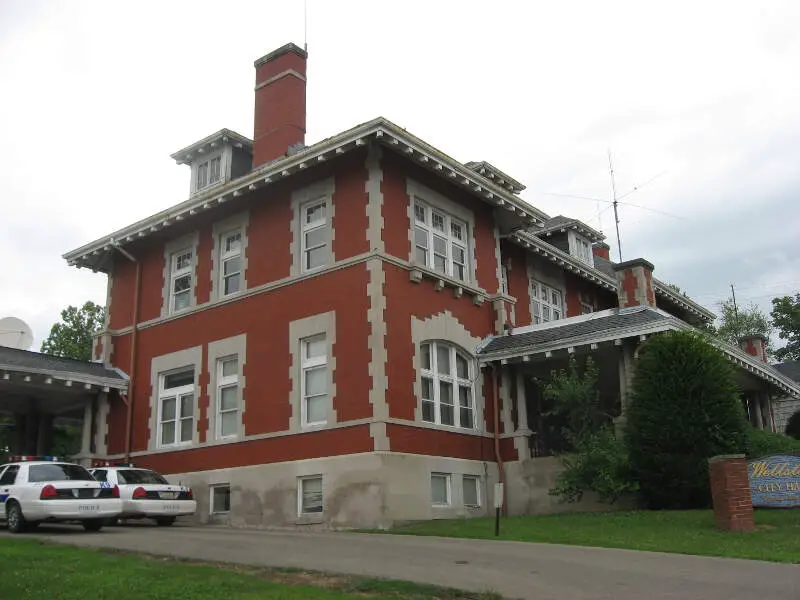
#5 dumbest in Ohio
Wellston is a city in Jackson County, Ohio, United States, in the southeastern part of the state. The population was 5,663 at the 2010 census.
Data | Crime | Cost of living | Movers
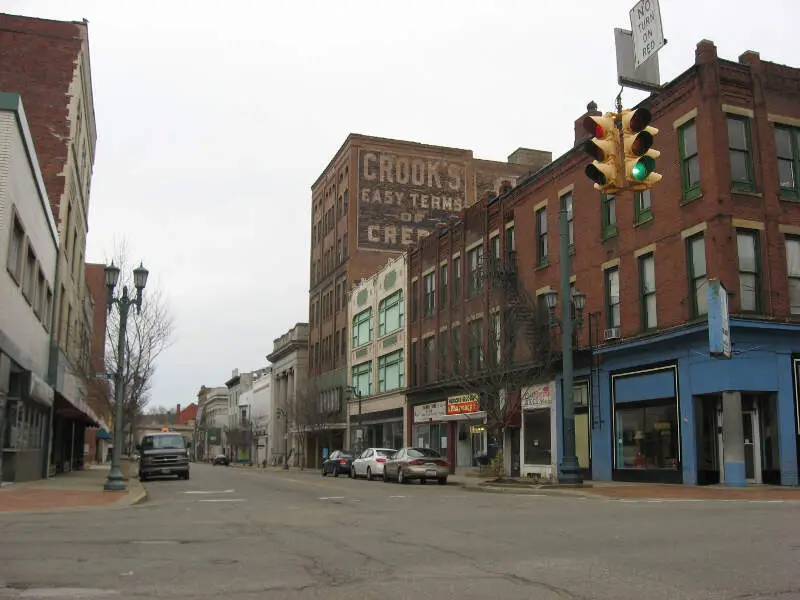
#6 dumbest in Ohio
East Liverpool is a city in Columbiana County, Ohio, United States. The population was 11,195 at the time of the 2010 census. It is located along the Ohio River and borders the states of Pennsylvania and West Virginia. East Liverpool is a major city in the Salem, OH Micropolitan Statistical Area, approximately 40 miles from downtown Pittsburgh.
Data | Crime | Cost of living | Movers
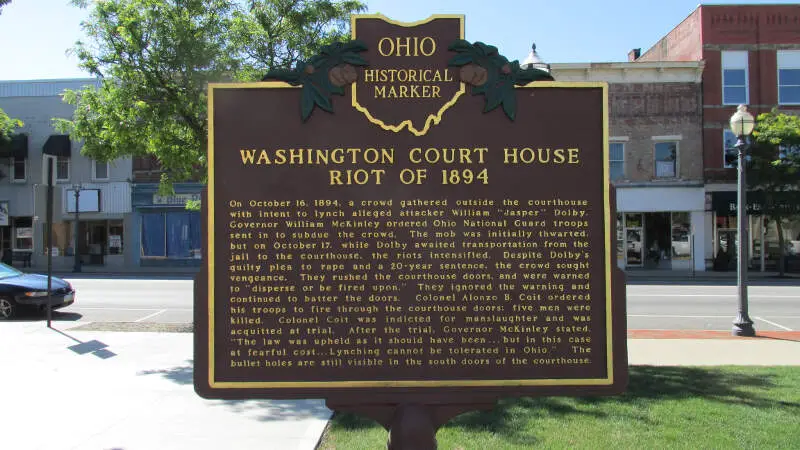
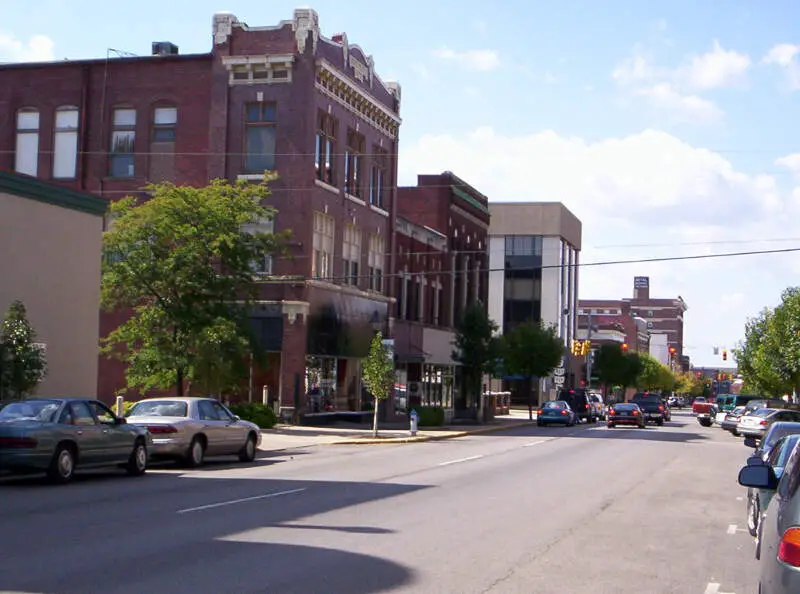
#7 dumbest in Ohio
Washington Court House is a city in Fayette County, Ohio, United States. It is the county seat of Fayette County and is located between Cincinnati and Columbus, Ohio. The population was 14,192 in 2010 at the 2010 census. Until 2002, the official name of the city was City of Washington, but there also existed a municipality in Guernsey County, Ohio with the name Washington. The area was originally settled by Virginia war veterans who received the land from the government as payment for their service in the American Revolution. In 2002, a new charter was adopted, officially changing the name to the “City of Washington Court House.” The name is often abbreviated as “Washington C.H.”
Data | Crime | Cost of living | Movers
#8 dumbest in Ohio
Marion is a city in and the county seat of Marion County, Ohio, United States. The municipality is located in north-central Ohio, approximately 50 miles north of Columbus.
Data | Crime | Cost of living | Movers
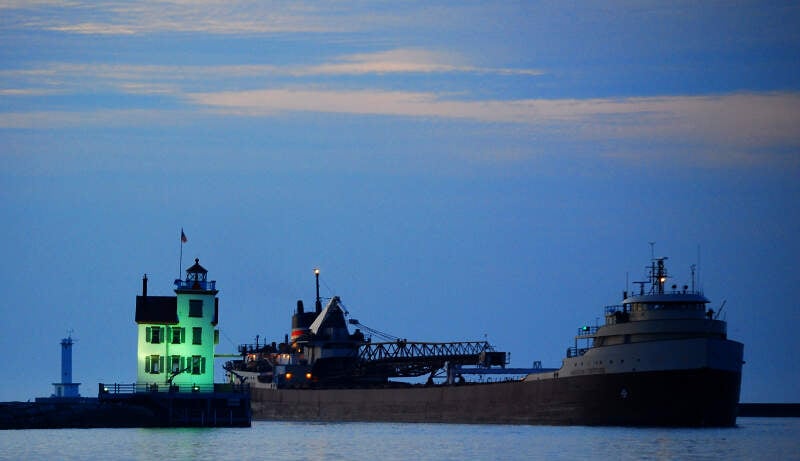
#9 dumbest in Ohio
Lorain is a city in Lorain County, Ohio, United States. The municipality is located in northeastern Ohio on Lake Erie, at the mouth of the Black River, approximately 30 miles west of Cleveland. As of the 2010 census, the city had a total population of 64,097, making it Ohio’s tenth largest city, the second largest in Greater Cleveland, and the largest in Lorain County by population.
Data | Crime | Cost of living | Movers
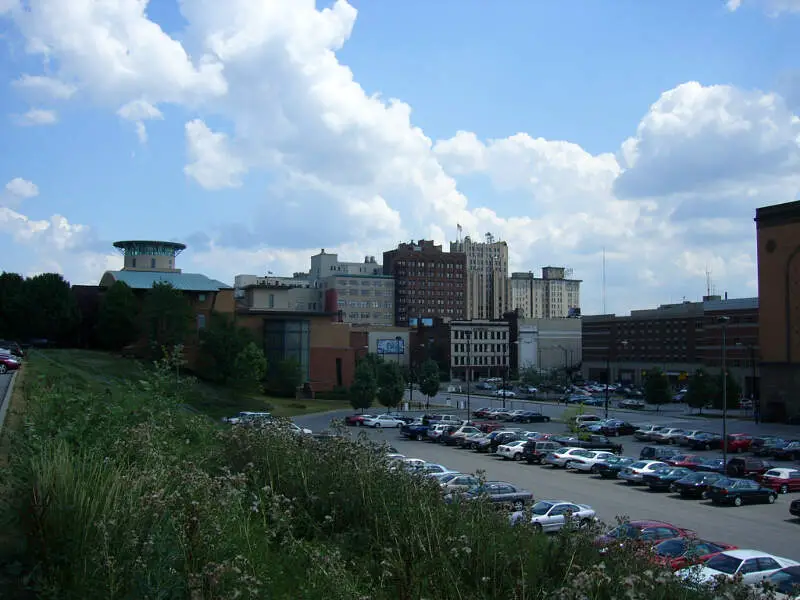
#10 dumbest in Ohio
Youngstown is a city in and the county seat of Mahoning County in the U.S. state of Ohio, with small portions extending into Trumbull County. According to the 2010 Census, Youngstown had a city proper population of 66,982, while the Youngstown-Warren-Boardman, OH-PA Metropolitan Statistical Area it anchors contained 565,773 people in Mahoning and Trumbull counties in Ohio, and Mercer County in Pennsylvania.
Data | Crime | Cost of living | Movers
The receipts
Compare the top ten
Pick a metric. The bars rescale. The red line is Ohio’s statewide median.
On the map
Where Ohio’s dumbest cities are
Saturday Night Science
Methodology: How we determined the dumbest cities in the Buckeye State
We realize that formal education is only part of it when it comes to being intelligent, but on the other hand, knowing the difference between they’re, their, and there is always going to make you look pretty stupid.
So, we used Saturday Night Science to narrow down our criteria to focus on a city’s educational opportunities and what percentage of the population takes advantage of those opportunities.
In short, we came up with these criteria to determine the dumbest cities in Ohio:
- % of the city’s population with less than a high school education (Age 25+)
- % of city’s population with a college degree (Age 25+)
We got the data from the U.S. Census 2020-2024 American Community Survey.
Then, our algorithm generates a rank for each place in these categories. After crunching all the numbers, a ranking of the cities in Ohio from dumbest to brightest.
For this ranking, we used every Ohio city with at least 5,000 residents. We updated this article for 2026, and it’s our eleventh time ranking the dumbest cities in Ohio.
The full plate
Dumbest Cities In Ohio For 2026
Click any column to sort. Search by city name.
| Rank | City | Population | % Adult High School Dropout | % Highly Educated |
|---|---|---|---|---|
| 1 | Uhrichsville | 5,189 | 20.0% | 10.0% |
| 2 | Grafton | 5,657 | 17.0% | 11.0% |
| 3 | Ashtabula | 17,856 | 17.0% | 11.0% |
| 4 | New Carlisle | 5,544 | 17.0% | 11.0% |
| 5 | Wellston | 5,452 | 15.0% | 11.0% |
| 6 | East Liverpool | 9,783 | 14.0% | 8.0% |
| 7 | Washington Court House | 14,439 | 15.0% | 12.0% |
| 8 | Marion | 35,669 | 14.0% | 10.0% |
| 9 | Lorain | 65,395 | 16.0% | 14.0% |
| 10 | Youngstown | 59,331 | 16.0% | 15.0% |
| 11 | Portsmouth | 17,728 | 17.0% | 16.0% |
| 12 | Canton | 69,755 | 14.0% | 15.0% |
| 13 | Mansfield | 47,663 | 16.0% | 16.0% |
| 14 | Cambridge | 10,060 | 14.0% | 15.0% |
| 15 | Zanesville | 24,740 | 14.0% | 15.0% |
| 16 | Martins Ferry | 6,140 | 12.0% | 13.0% |
| 17 | Whitehall | 20,019 | 13.0% | 14.0% |
| 18 | East Cleveland | 13,534 | 17.0% | 17.0% |
| 19 | Lima | 35,010 | 12.0% | 13.0% |
| 20 | Piqua | 20,646 | 13.0% | 15.0% |
| 21 | Warren | 38,912 | 14.0% | 16.0% |
| 22 | Galion | 10,339 | 12.0% | 14.0% |
| 23 | Garfield Heights | 29,269 | 12.0% | 14.0% |
| 24 | Hamilton | 63,468 | 15.0% | 17.0% |
| 25 | Conneaut | 12,357 | 13.0% | 16.0% |
| 26 | Bryan | 8,631 | 11.0% | 14.0% |
| 27 | Campbell | 7,784 | 17.0% | 19.0% |
| 28 | Urbana | 11,204 | 13.0% | 17.0% |
| 29 | Bucyrus | 11,594 | 9.0% | 13.0% |
| 30 | Springfield | 58,190 | 14.0% | 18.0% |
| 31 | Bellevue | 8,187 | 9.0% | 13.0% |
| 32 | Greenville | 12,741 | 11.0% | 16.0% |
| 33 | Alliance | 21,478 | 11.0% | 16.0% |
| 34 | Fostoria | 12,344 | 9.0% | 10.0% |
| 35 | Bellefontaine | 13,807 | 10.0% | 15.0% |
| 36 | Willard | 6,164 | 12.0% | 17.0% |
| 37 | Sidney | 20,501 | 13.0% | 18.0% |
| 38 | Salem | 11,758 | 15.0% | 20.0% |
| 39 | Logan | 6,993 | 9.0% | 14.0% |
| 40 | Brooklyn | 11,158 | 13.0% | 19.0% |
| 41 | Brook Park | 18,284 | 10.0% | 16.0% |
| 42 | Middletown | 51,617 | 12.0% | 18.0% |
| 43 | Elyria | 53,035 | 12.0% | 18.0% |
| 44 | Ravenna | 11,274 | 14.0% | 20.0% |
| 45 | Jackson | 6,231 | 12.0% | 18.0% |
| 46 | Cleveland | 366,097 | 16.0% | 22.0% |
| 47 | Franklin | 11,712 | 9.0% | 16.0% |
| 48 | Maple Heights | 23,258 | 9.0% | 16.0% |
| 49 | Belpre | 6,654 | 9.0% | 16.0% |
| 50 | Geneva | 5,886 | 10.0% | 17.0% |
| 51 | Moraine | 6,536 | 10.0% | 17.0% |
| 52 | Trenton | 13,583 | 10.0% | 17.0% |
| 53 | Rittman | 6,044 | 13.0% | 21.0% |
| 54 | Painesville | 20,548 | 16.0% | 23.0% |
| 55 | Ironton | 10,768 | 10.0% | 18.0% |
| 56 | Port Clinton | 5,970 | 12.0% | 21.0% |
| 57 | Circleville | 14,142 | 12.0% | 21.0% |
| 58 | Eaton | 8,339 | 8.0% | 16.0% |
| 59 | Shelby | 8,865 | 7.0% | 15.0% |
| 60 | Xenia | 25,689 | 11.0% | 21.0% |
| 61 | Forest Park | 20,025 | 15.0% | 25.0% |
| 62 | West Carrollton | 12,976 | 10.0% | 21.0% |
| 63 | Dayton | 136,579 | 11.0% | 22.0% |
| 64 | Toledo | 267,463 | 11.0% | 22.0% |
| 65 | Kenton | 7,663 | 8.0% | 17.0% |
| 66 | Northwood | 5,193 | 14.0% | 25.0% |
| 67 | London | 10,484 | 11.0% | 22.0% |
| 68 | Barberton | 24,844 | 9.0% | 19.0% |
| 69 | Akron | 189,247 | 12.0% | 23.0% |
| 70 | Van Wert | 10,790 | 7.0% | 16.0% |
| 71 | Fremont | 15,835 | 7.0% | 16.0% |
| 72 | Chillicothe | 21,902 | 9.0% | 21.0% |
| 73 | Delphos | 7,143 | 8.0% | 18.0% |
| 74 | Sandusky | 24,606 | 10.0% | 22.0% |
| 75 | Coshocton | 11,068 | 9.0% | 20.0% |
| 76 | Norwalk | 17,095 | 8.0% | 19.0% |
| 77 | Struthers | 9,923 | 7.0% | 16.0% |
| 78 | Riverside | 24,435 | 11.0% | 23.0% |
| 79 | Trotwood | 23,041 | 8.0% | 20.0% |
| 80 | Hillsboro | 6,527 | 8.0% | 19.0% |
| 81 | Mount Vernon | 17,052 | 9.0% | 23.0% |
| 82 | Massillon | 32,338 | 7.0% | 18.0% |
| 83 | Newark | 50,783 | 9.0% | 23.0% |
| 84 | Mount Healthy | 6,919 | 9.0% | 24.0% |
| 85 | Wapakoneta | 9,894 | 7.0% | 20.0% |
| 86 | Ontario | 6,667 | 9.0% | 23.0% |
| 87 | Warrensville Heights | 13,545 | 9.0% | 24.0% |
| 88 | Euclid | 48,823 | 9.0% | 24.0% |
| 89 | Toronto | 5,293 | 7.0% | 19.0% |
| 90 | Sheffield Lake | 8,966 | 6.0% | 18.0% |
| 91 | Brookville | 5,779 | 7.0% | 22.0% |
| 92 | Steubenville | 18,124 | 10.0% | 29.0% |
| 93 | Cheviot | 8,660 | 7.0% | 21.0% |
| 94 | Orrville | 8,343 | 8.0% | 24.0% |
| 95 | New Philadelphia | 17,520 | 8.0% | 24.0% |
| 96 | Ashland | 18,911 | 8.0% | 23.0% |
| 97 | Springdale | 11,033 | 9.0% | 26.0% |
| 98 | Marietta | 13,203 | 9.0% | 28.0% |
| 99 | Girard | 9,505 | 6.0% | 20.0% |
| 100 | Bedford | 12,931 | 6.0% | 20.0% |
Source: U.S. Census ACS 2020-2024. 244 cities with more than 5,000 residents.
Summary
There You Have It – Now That You’re Asleep
If you’re measuring the locations in Ohio where there are a high number of dropouts and adults who never received a formal education, this is an accurate ranking.
The dumbest cities in Ohio are Uhrichsville, Grafton, Ashtabula, New Carlisle, Wellston, East Liverpool, Washington Court House, Marion, Lorain, and Youngstown. Not sold on Ohio? Take the two-minute Find Your Place quiz and see which state actually fits you.