Welcome to the happiest places in Michigan.
Using Saturday Night Science and data, we determined the cities and towns with the most rainbows, butterflies, puppies, and unicorns.
You know, the places where people have jobs, white-picked fences, and friendly neighbors – unicorn cities.
After analyzing the 153 largest cities, we happily present the happiest cities in the Wolverine State.
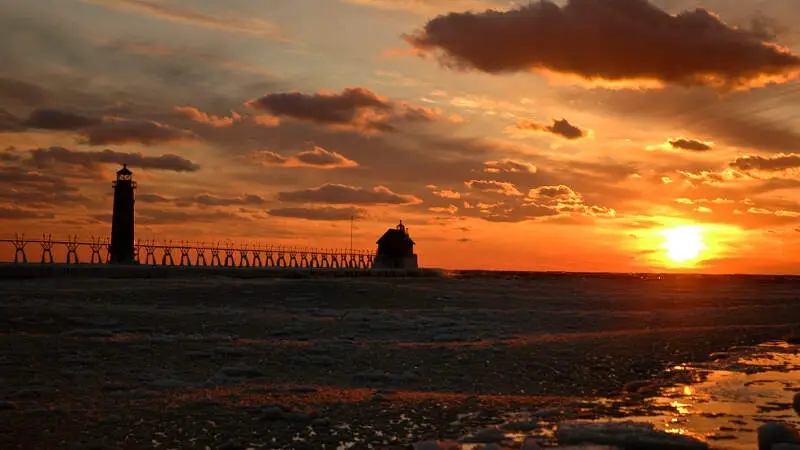
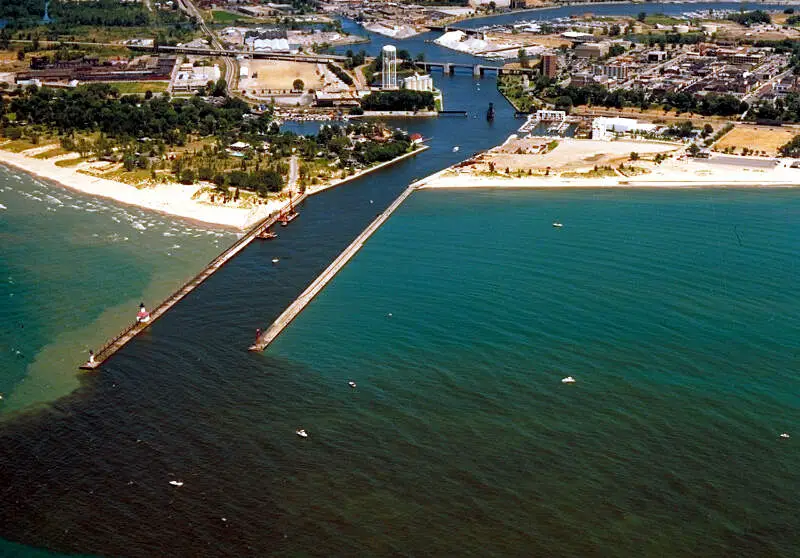
37.0% married households · 14.5% poverty · #1 happiest in Michigan
Grand Haven is by far the happiest place in the state of Michigan. Let’s see why.
First off, having a solid family life is a good indication of how happy someone is. Lots of the residents of Grand Haven aren’t missing out on love; more than 37% of them are married. Plus, the average commute time here is only about 16 minutes each way. That means a lot more time with the spouse and kids.
Data | Crime | Cost of living | Movers
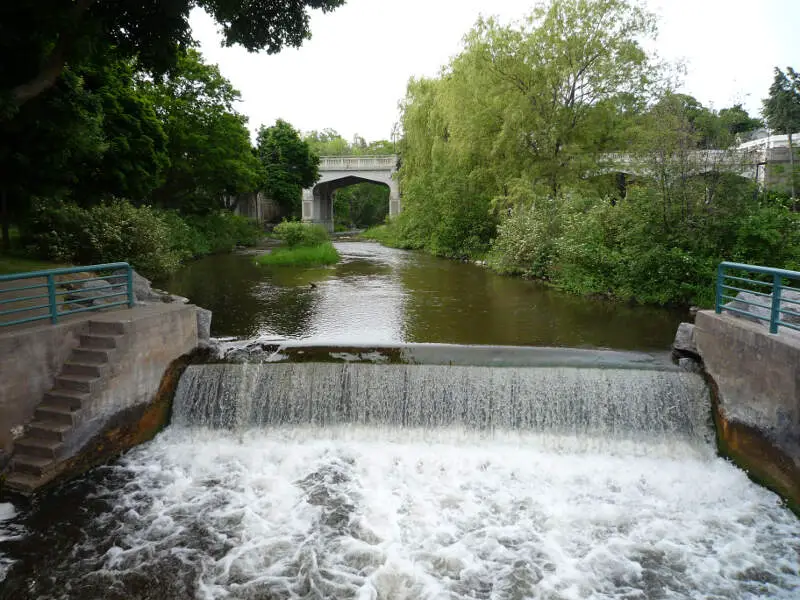
39.0% married households · 9.0% poverty · #2 happiest in Michigan
Things look to be pretty pleasant in Petoskey. Crime is really low here, and the percentage of married residents (39%) mean there’s lots of stability at home.
In addition to those factors, there is a thriving amount of community involvement. Studies have shown that a key factor to happiness is when people volunteer, especially in their own neighborhoods.
Data | Crime | Cost of living | Movers
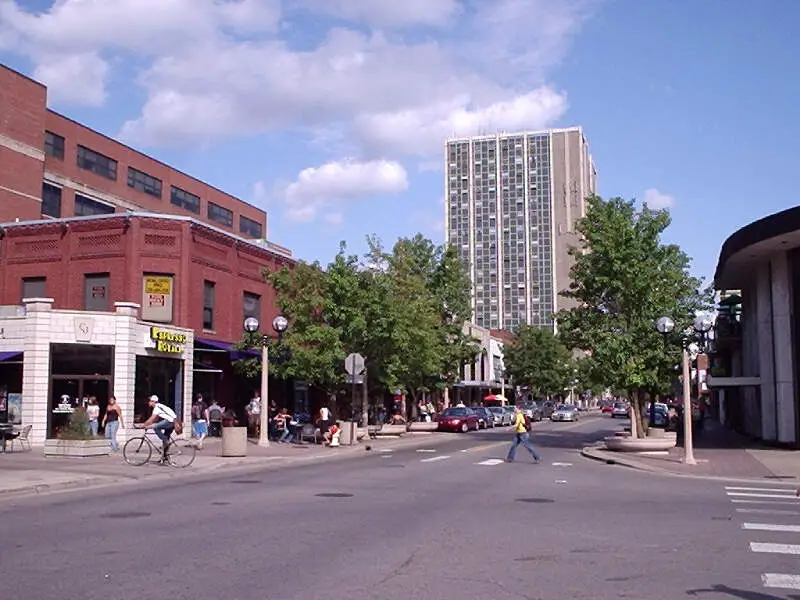
13.0% married households · 23.8% poverty · #3 happiest in Michigan
The people who live in Ann Arbor have a lot going for them. 78% of them have college degrees, and they command some of the highest salaries in MI. 13% of the people here are married.
Most of these all tops in the entire state.
Data | Crime | Cost of living | Movers
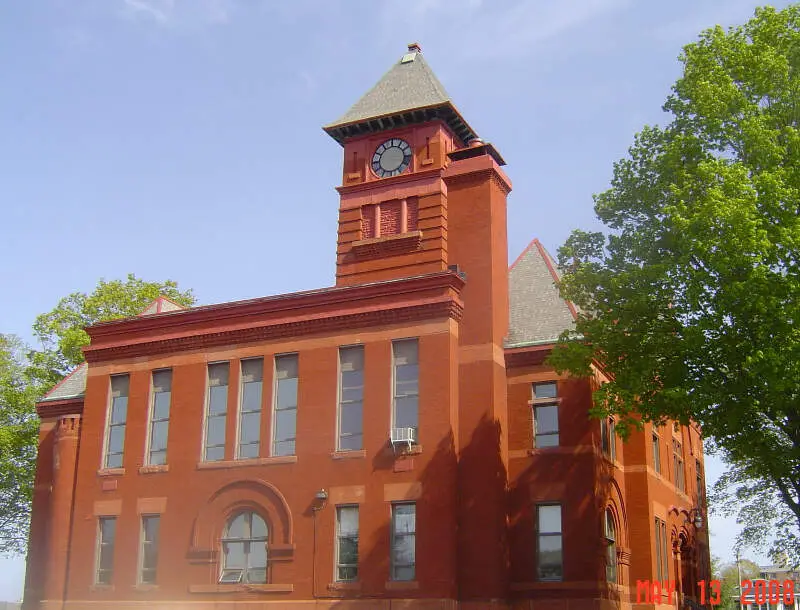
37.0% married households · 22.5% poverty · #4 happiest in Michigan
Ludington is where you can bet there are lots of smiley and happy people all over town. Crime is essentially something that just doesn’t happen here very often. And when you can let your guard down and relax a little, the lack of stress really makes a difference.
Same goes on the job front. Only 3.6% of residents here are out of work. Sounds like there are jobs for just about everyone who wants one. Which must be a good feeling to have.
Data | Crime | Cost of living | Movers
21.0% married households · 22.4% poverty · #5 happiest in Michigan
If you want to see a bunch of happy people, go to Marquette. It seriously looks like something out of a commercial.
They have a 13 minute commute time, which means lots more time with the kids.
Data | Crime | Cost of living | Movers
9.0% married households · 33.0% poverty · #6 happiest in Michigan
For those who say that money doesn’t buy happiness, you’re half right. Studies have shown that people are happy up to a certain point when it comes to annual salaries, somewhere around $72,000 a year. After that, it doesn’t matter how much you make, you’re not going to be much happier.
The residents of East Lansing have that covered. Plus about 9% of households are married.
Data | Crime | Cost of living | Movers
31.0% married households · 12.3% poverty · #7 happiest in Michigan
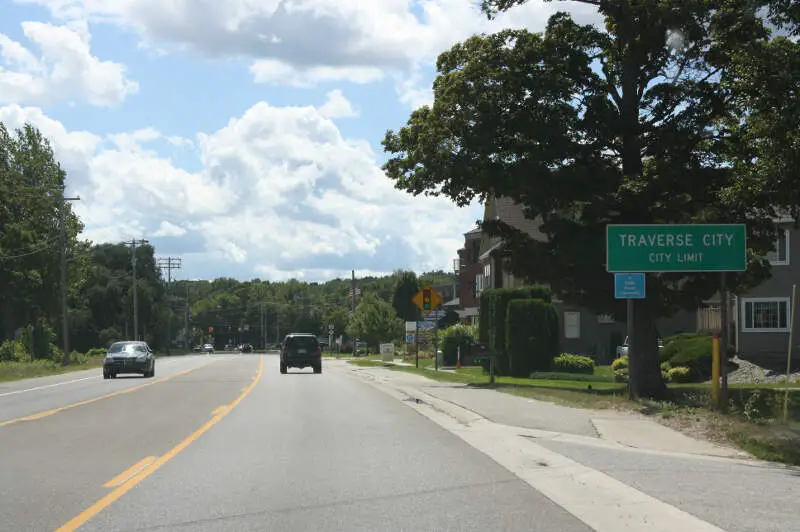
Most of the people in Traverse City have to be ‘plum’ happy. True happiness is ‘Home Sweet Home’ with your kids and spouse, being reminded to do chores, run errands and fold the clothes right.
Data | Crime | Cost of living | Movers
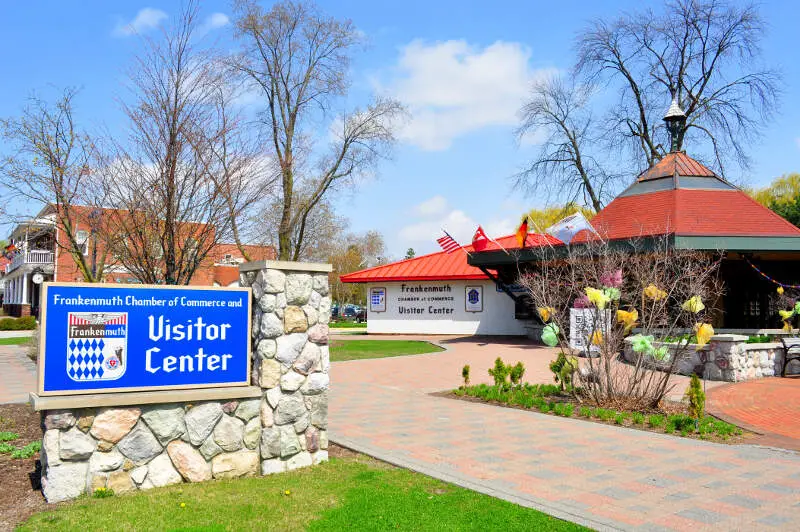
47.0% married households · 4.9% poverty · #8 happiest in Michigan
Less than 4.7% of the residents in Frankenmuth are jobless, which is just about as low as you’ll see.
Incomes are steady, and commute times are really low as well. That really takes away the stress factors that stop folks from relaxing and enjoying their ‘down time’ to do the little things that matter: Walks in the park, time alone with a book and extra face time with the children.
Data | Crime | Cost of living | Movers
21.0% married households · 7.3% poverty · #9 happiest in Michigan
About 56% of residents in St. Joseph, MI have a college degree. While we’ve all heard the saying, ‘Ignorance is bliss,’ our argument is: Ignorance is also broke.
Not only are most of the residents of St. Joseph smart, they’re safe, too.
Data | Crime | Cost of living | Movers
47.0% married households · 2.2% poverty · #10 happiest in Michigan
In Huntington Woods, most of the population is married, and most own their own homes.
The commute times (20 minutes each way) might eventually start to turn the corners of those smiles sideways.
But for now, it’s all roses in Huntington Woods.
Data | Crime | Cost of living | Movers
The receipts
Compare the top ten
Pick a metric. The bars rescale. The red line is Michigan’s statewide median.
Michigan statewide median: $259,857
Michigan statewide median: 13.2%
On the map
Where the happiest places in Michigan are
Saturday Night Science
Methodology: How We Measured The Happiest Cities In The Wolverine State
To rank the happiest places in Michigan, we had to determine what criteria make people happy. It isn’t a stretch to assume that happy people earn great salaries, are relatively stress-free, and have a stable home life.
So we went to the Census’s American Community Survey 2020-2024 report for the happy criteria, added some Saturday Night Science, and generated the answer.
Here are the criteria we used to measure happiness:
- Percentage of residents with a college degree
- Average commute times
- Unemployment rates
- Cost of living
- % of married couples
- % of families with kids
- Poverty rate
After we decided on the criteria, we gathered the data for the 153 places in Michigan with over 5,000 people.
We then ranked each place from one to 153 for each of the seven criteria, with a score of one being the happiest.
Next, we averaged the seven rankings into a Happy Index for each place with the lowest overall Happy Index “earning” the title “Happiest City In Michigan.”
If you’d like to see the complete list of cities, happiest to saddest, scroll to the bottom of this post to see the unabridged chart.
We updated this article for 2026, and it’s our eleventh time ranking the happiest cities in Michigan.
The full plate
Happiest Cities In Michigan For 2026
Click any column to sort. Search by city name.
| Rank | City | Happy Index | Population | Poverty Level | Median Home Value | % Married | % Kids |
|---|---|---|---|---|---|---|---|
| 1 | Grand Haven | 30.93 | 10,996 | 14.5% | $391,797 | 37.0% | 18.2% |
| 2 | Petoskey | 35.00 | 5,856 | 9.0% | $472,426 | 39.0% | 25.9% |
| 3 | Ann Arbor | 39.57 | 122,036 | 23.8% | $523,391 | 13.0% | 17.1% |
| 4 | Ludington | 40.14 | 7,676 | 22.5% | $298,513 | 37.0% | 24.5% |
| 5 | Marquette | 41.86 | 21,325 | 22.4% | $323,189 | 21.0% | 15.1% |
| 6 | East Lansing | 48.50 | 45,758 | 33.0% | $311,383 | 9.0% | 15.0% |
| 7 | Traverse City | 49.29 | 15,593 | 12.3% | $437,525 | 31.0% | 23.2% |
| 8 | Frankenmuth | 49.71 | 5,157 | 4.9% | $315,291 | 47.0% | 18.1% |
| 9 | St. Joseph | 50.00 | 7,986 | 7.3% | $328,307 | 21.0% | 14.9% |
| 10 | Huntington Woods | 50.79 | 6,328 | 2.2% | $537,208 | 47.0% | 33.5% |
| 11 | Grandville | 51.07 | 16,356 | 7.3% | $353,731 | 43.0% | 30.4% |
| 12 | Berkley | 51.43 | 15,149 | 4.5% | $314,815 | 40.0% | 24.9% |
| 13 | Brighton | 52.00 | 7,688 | 8.1% | $432,666 | 34.0% | 18.9% |
| 14 | Walker | 52.00 | 25,386 | 7.6% | $352,818 | 36.0% | 25.0% |
| 15 | East Grand Rapids | 52.50 | 11,445 | 3.6% | $664,184 | 44.0% | 50.3% |
| 16 | Zeeland | 53.07 | 5,665 | 10.4% | $382,237 | 40.0% | 31.6% |
| 17 | Grosse Pointe Farms | 55.29 | 9,904 | 2.5% | $513,933 | 46.0% | 29.5% |
| 18 | St. Johns | 55.71 | 7,715 | 12.5% | $286,182 | 40.0% | 25.1% |
| 19 | Houghton | 56.36 | 8,474 | 40.1% | $262,335 | 8.0% | 19.4% |
| 20 | Beverly Hills | 57.71 | 10,524 | 1.7% | $587,951 | 43.0% | 37.3% |
| 21 | Royal Oak | 57.93 | 57,950 | 6.2% | $331,359 | 27.0% | 17.3% |
| 22 | Grand Ledge | 58.57 | 7,804 | 6.2% | $296,333 | 47.0% | 25.2% |
| 23 | Milford | 58.79 | 6,487 | 7.6% | $481,467 | 41.0% | 27.4% |
| 24 | Wixom | 59.43 | 17,295 | 10.9% | $384,492 | 25.0% | 16.6% |
| 25 | Birmingham | 59.86 | 21,763 | 5.1% | $733,351 | 33.0% | 28.4% |
| 26 | Ferndale | 60.07 | 19,190 | 9.0% | $250,328 | 26.0% | 12.6% |
| 27 | Chelsea | 60.21 | 5,426 | 4.1% | $411,817 | 36.0% | 18.7% |
| 28 | Manistee | 60.57 | 6,275 | 16.8% | $257,759 | 36.0% | 24.9% |
| 29 | Big Rapids | 61.00 | 8,477 | 34.1% | $215,285 | 13.0% | 19.6% |
| 30 | Grosse Pointe Park | 61.29 | 11,319 | 4.9% | $502,195 | 40.0% | 29.3% |
| 31 | Mount Pleasant | 61.43 | 21,236 | 31.4% | $220,400 | 14.0% | 16.1% |
| 32 | Midland | 61.79 | 42,724 | 10.3% | $247,417 | 35.0% | 26.8% |
| 33 | Northville | 61.86 | 6,069 | 2.8% | $588,077 | 38.0% | 28.2% |
| 34 | St. Clair | 62.71 | 5,585 | 7.1% | $311,688 | 37.0% | 27.9% |
| 35 | Holland | 62.93 | 34,423 | 10.3% | $364,546 | 27.0% | 31.7% |
| 36 | Gladstone | 63.00 | 5,253 | 14.1% | $204,038 | 37.0% | 24.9% |
| 37 | Grand Rapids | 63.79 | 198,535 | 16.9% | $303,298 | 22.0% | 26.5% |
| 38 | Grosse Pointe | 64.00 | 5,541 | 2.8% | $469,116 | 40.0% | 27.9% |
| 39 | Plymouth | 64.14 | 9,214 | 3.2% | $471,425 | 31.0% | 27.3% |
| 40 | Cadillac | 64.86 | 10,445 | 18.2% | $228,847 | 30.0% | 24.5% |
| 41 | Hastings | 65.07 | 7,520 | 12.5% | $235,811 | 34.0% | 23.7% |
| 42 | Portage | 65.14 | 49,259 | 7.1% | $292,450 | 33.0% | 27.7% |
| 43 | Clawson | 65.71 | 11,374 | 5.9% | $286,026 | 30.0% | 18.8% |
| 44 | Farmington | 65.71 | 11,504 | 4.8% | $327,491 | 29.0% | 24.6% |
| 45 | Rochester | 65.86 | 12,934 | 4.2% | $486,537 | 29.0% | 27.0% |
| 46 | Kalamazoo | 65.93 | 73,076 | 24.9% | $236,274 | 16.0% | 22.9% |
| 47 | Howell | 66.79 | 10,021 | 7.7% | $377,375 | 32.0% | 20.2% |
| 48 | Hudsonville | 66.79 | 7,769 | 8.3% | $417,204 | 50.0% | 41.2% |
| 49 | Mason | 67.07 | 8,249 | 5.3% | $275,133 | 33.0% | 25.1% |
| 50 | Livonia | 67.21 | 93,851 | 4.7% | $309,576 | 38.0% | 24.1% |
| 51 | Marshall | 67.36 | 6,804 | 5.7% | $240,469 | 35.0% | 17.7% |
| 52 | Escanaba | 67.50 | 12,354 | 17.7% | $175,184 | 29.0% | 20.7% |
| 53 | Utica | 67.50 | 5,180 | 7.5% | $253,468 | 25.0% | 18.3% |
| 54 | Alpena | 68.14 | 10,154 | 21.2% | $187,287 | 30.0% | 18.8% |
| 55 | South Lyon | 68.29 | 11,950 | 4.0% | $467,292 | 36.0% | 24.7% |
| 56 | Sault Ste. Marie | 68.71 | 13,335 | 17.8% | $156,408 | 25.0% | 24.0% |
| 57 | Ypsilanti | 69.14 | 19,857 | 24.8% | $282,887 | 12.0% | 18.3% |
| 58 | Norton Shores | 69.29 | 25,041 | 6.5% | $287,720 | 47.0% | 31.2% |
| 59 | Auburn Hills | 69.43 | 25,105 | 11.1% | $277,483 | 18.0% | 19.8% |
| 60 | Grosse Pointe Woods | 69.50 | 16,094 | 4.9% | $349,101 | 42.0% | 28.1% |
| 61 | Woodhaven | 70.00 | 12,690 | 13.0% | $266,356 | 36.0% | 22.1% |
| 62 | Menominee | 70.79 | 8,326 | 16.4% | $167,970 | 17.0% | 22.1% |
| 63 | Trenton | 70.86 | 18,125 | 5.5% | $239,684 | 41.0% | 23.5% |
| 64 | Farmington Hills | 71.21 | 83,515 | 7.6% | $387,308 | 28.0% | 25.2% |
| 65 | Alma | 72.00 | 9,396 | 21.7% | $162,540 | 34.0% | 26.0% |
| 66 | Madison Heights | 72.07 | 28,419 | 10.8% | $219,511 | 24.0% | 17.2% |
| 67 | Kingsford | 72.43 | 5,124 | 9.0% | $146,083 | 35.0% | 24.1% |
| 68 | Kentwood | 72.57 | 54,296 | 10.4% | $331,531 | 25.0% | 29.5% |
| 69 | New Baltimore | 72.57 | 12,072 | 5.4% | $354,733 | 44.0% | 26.3% |
| 70 | Allegan | 72.79 | 5,172 | 13.9% | $279,562 | 32.0% | 30.2% |
| 71 | Walled Lake | 72.86 | 7,299 | 10.5% | $242,300 | 24.0% | 22.9% |
| 72 | Iron Mountain | 73.07 | 7,518 | 13.5% | $182,105 | 30.0% | 27.1% |
| 73 | Lapeer | 73.50 | 9,082 | 24.5% | $261,368 | 31.0% | 26.4% |
| 74 | St. Clair Shores | 73.86 | 58,140 | 8.4% | $227,950 | 38.0% | 20.6% |
| 75 | Rochester Hills | 74.00 | 77,089 | 5.2% | $465,253 | 30.0% | 30.8% |
| 76 | Holly | 74.00 | 5,964 | 8.5% | $320,381 | 37.0% | 22.6% |
| 77 | Saline | 74.86 | 9,006 | 5.8% | $465,110 | 27.0% | 22.9% |
| 78 | Wyandotte | 75.07 | 24,489 | 13.0% | $186,227 | 33.0% | 24.2% |
| 79 | Rockford | 77.00 | 6,218 | 5.0% | $450,322 | 46.0% | 33.6% |
| 80 | Ishpeming | 77.07 | 6,181 | 18.7% | $182,186 | 34.0% | 30.4% |
| 81 | Marysville | 77.14 | 9,925 | 6.4% | $227,854 | 46.0% | 27.2% |
| 82 | Fraser | 77.21 | 14,583 | 10.4% | $234,792 | 33.0% | 25.7% |
| 83 | Grand Blanc | 77.64 | 7,987 | 9.0% | $285,257 | 33.0% | 29.5% |
| 84 | Charlotte | 78.21 | 9,277 | 11.1% | $235,060 | 33.0% | 33.0% |
| 85 | Lansing | 78.64 | 113,023 | 20.1% | $163,359 | 21.0% | 22.8% |
| 86 | Riverview | 78.79 | 12,186 | 7.3% | $242,241 | 37.0% | 28.0% |
| 87 | Troy | 79.21 | 87,898 | 5.4% | $457,480 | 24.0% | 31.5% |
| 88 | Southfield | 79.43 | 76,236 | 10.3% | $250,952 | 22.0% | 21.4% |
| 89 | Milan | 79.79 | 5,987 | 10.4% | $303,662 | 34.0% | 27.3% |
| 90 | Flushing | 79.93 | 8,284 | 7.0% | $235,733 | 43.0% | 26.8% |
| 91 | Allen Park | 80.00 | 27,925 | 6.9% | $206,256 | 39.0% | 27.2% |
| 92 | Hillsdale | 80.93 | 8,002 | 22.9% | $199,154 | 17.0% | 32.3% |
| 93 | Southgate | 81.36 | 29,366 | 9.4% | $192,161 | 35.0% | 26.3% |
| 94 | Bay City | 81.43 | 32,320 | 19.1% | $122,423 | 32.0% | 24.7% |
| 95 | Wyoming | 81.50 | 77,353 | 10.5% | $286,890 | 29.0% | 34.4% |
| 96 | New Haven | 81.71 | 6,475 | 13.8% | $308,844 | 39.0% | 53.8% |
| 97 | Ionia | 82.00 | 12,753 | 12.0% | $222,836 | 25.0% | 26.6% |
| 98 | Sterling Heights | 82.00 | 133,573 | 11.1% | $306,785 | 26.0% | 27.1% |
| 99 | Jackson | 83.07 | 31,058 | 24.6% | $187,175 | 22.0% | 24.3% |
| 100 | Eaton Rapids | 83.57 | 5,183 | 13.5% | $250,600 | 32.0% | 27.6% |
Source: U.S. Census ACS 2020-2024. 153 cities with more than 5,000 residents.
Summary
There You Have It – The Happiest Cities In Michigan
As we said earlier, trying to determine the most miserable cities in Michigan is usually a subjective matter.
But if you’re analyzing cities where people are not stable, where you’re stuck in traffic, and no one spent the time to go to college, then this is an accurate list.
The happiest cities in Michigan are Grand Haven, Petoskey, Ann Arbor, Ludington, Marquette, East Lansing, Traverse City, Frankenmuth, St. Joseph, and Huntington Woods.


