If you’re about to move to the Wolverine State but want to avoid living in an outrageously expensive city, you’re in the right place. We’ve done the research to discover which places in Michigan are the most expensive to live in.
While big Michigan cities like Detroit and Grand Rapids may be the first to come to mind, they aren’t among the most expensive cities in the state. Michigan’s priciest places are distributed throughout the state.
To come up with this list, we used Saturday Night Science to narrow the analysis to the 153 cities in Michigan with populations of 5,000 or more. Then we looked at data from American Community Survey on the cost of living for each city.
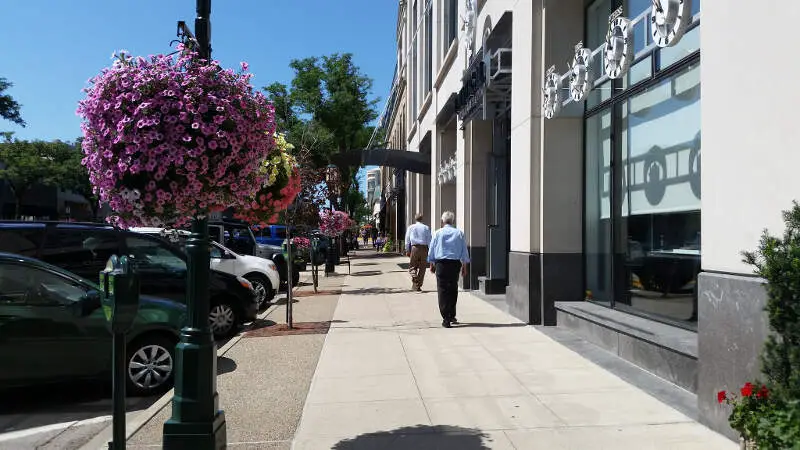
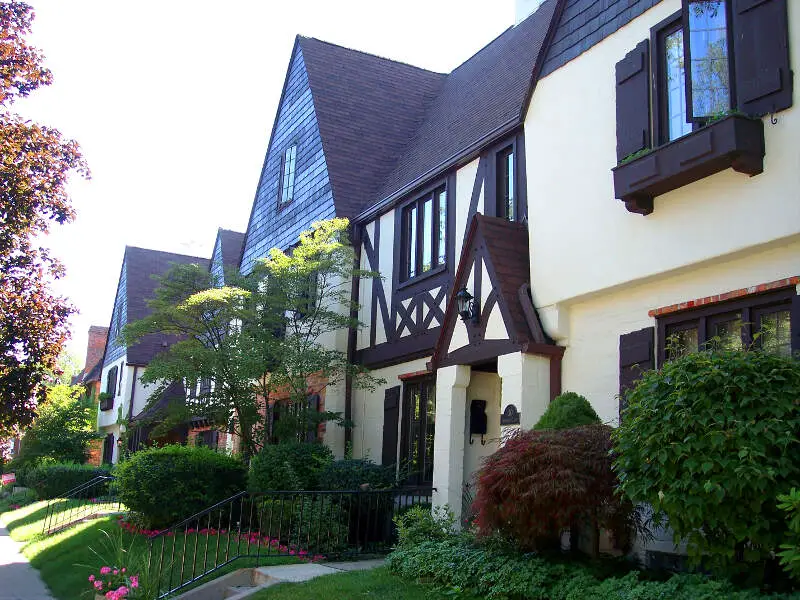
$153,510 median income · $733,351 median home · #1 home prices in Michigan
Birmingham is a city on the north side of Metro Detroit in the U.S. state of Michigan. As of the 2010 census, the population was 20,103.
Data | Crime | Cost of living | Movers
$190,150 median income · $537,208 median home · #5 home prices in Michigan
Data | Crime | Cost of living | Movers
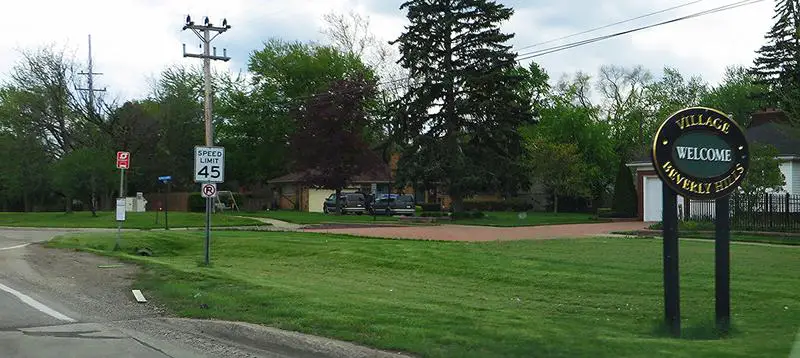
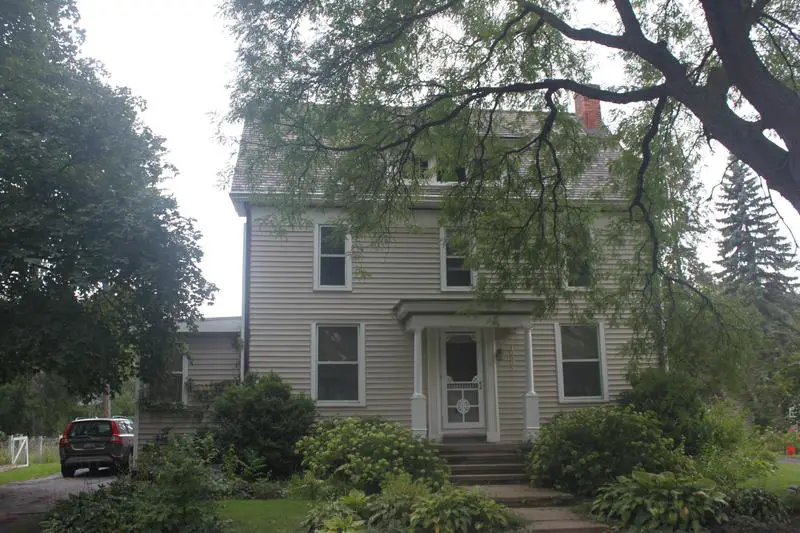
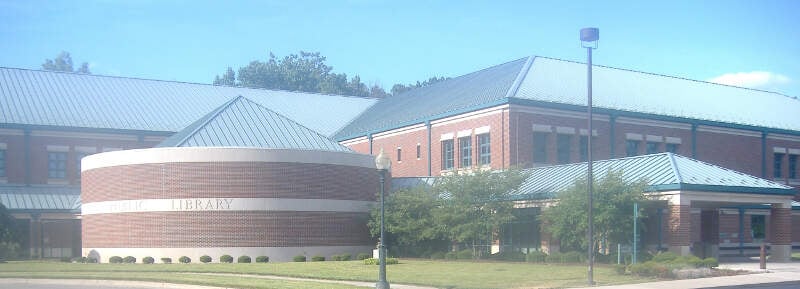
$177,412 median income · $587,951 median home · #4 home prices in Michigan
Beverly Hills is a village in Southfield Township, Oakland County of the U.S. state of Michigan. It is a suburb of Detroit. As of the 2010 census, the population was 10,267 making it by far the most populous village in the state.
Data | Crime | Cost of living | Movers
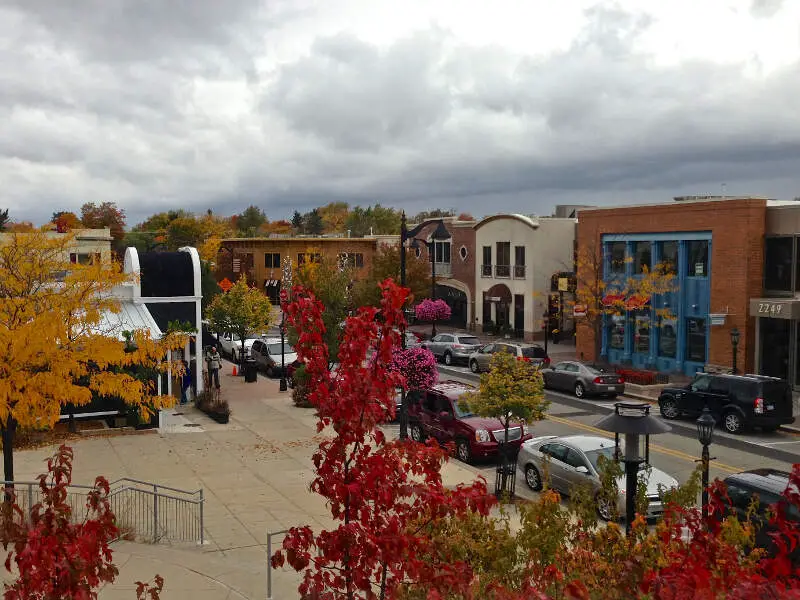
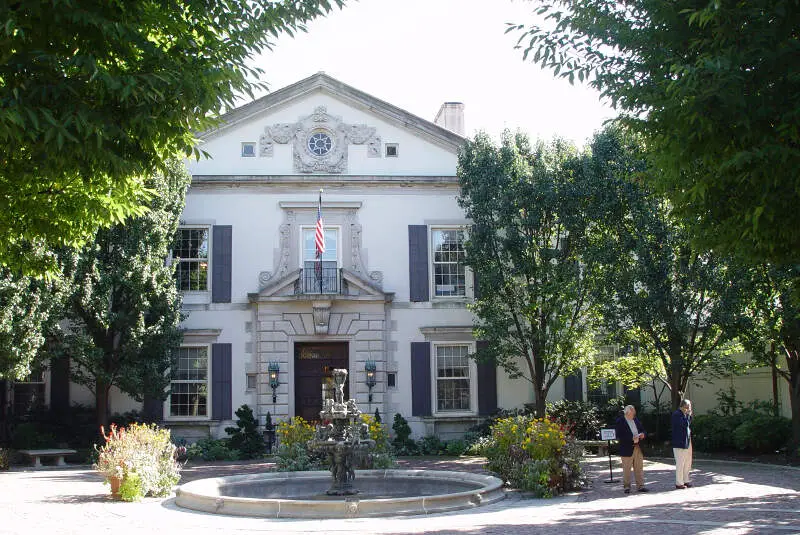
$166,610 median income · $664,184 median home · #2 home prices in Michigan
East Grand Rapids is a city in Kent County in the U.S. state of Michigan. The city is located in the Grand Rapids metropolitan area and is located on the shores of Reeds Lake. As of the 2010 census, the city population was 10,694.
Data | Crime | Cost of living | Movers
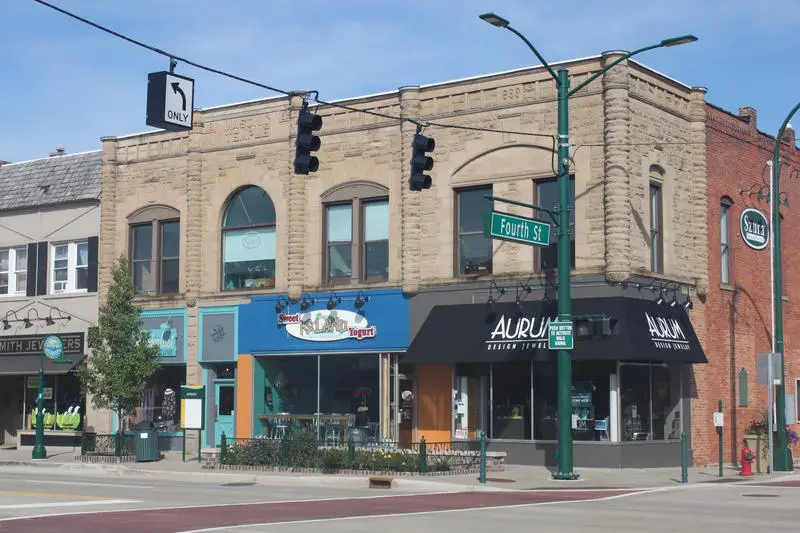
$111,750 median income · $486,537 median home · #9 home prices in Michigan
Rochester is a city on the north side of the Detroit Metropolitan Area, in Oakland County, in the U.S. state of Michigan. The population was 12,711 at the 2010 census.
Data | Crime | Cost of living | Movers
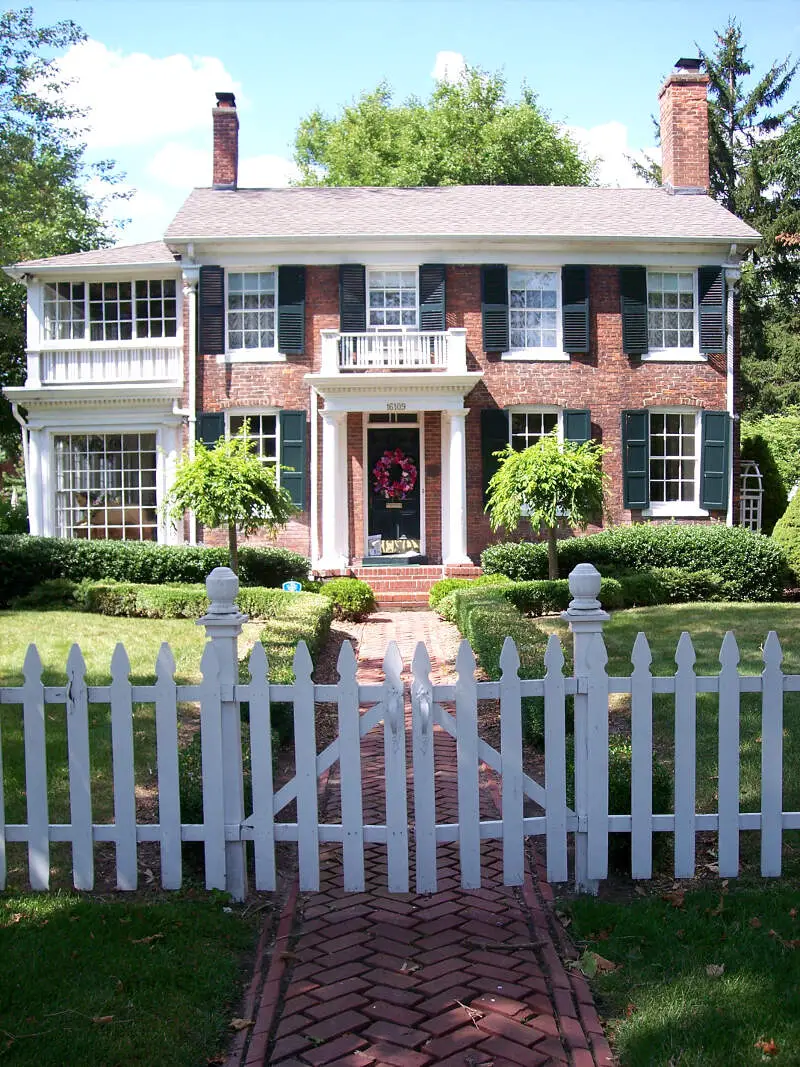
$161,208 median income · $513,933 median home · #7 home prices in Michigan
Grosse Pointe Farms is a suburban town bordering Detroit located in Wayne County in the U.S. state of Michigan. The population was 9,479 at the 2010 census. It is bordered by Canada and Lake Saint Clair on the south and east, Grosse Pointe on the west, Detroit on the north, and Grosse Pointe Woods and Grosse Pointe Shores on the northeast. Lakeshore Drive begins in Grosse Pointe Farms, where, just east of Fisher Road, the eastbound driver or pedestrian on Jefferson Avenue descends to lake level, following the curvature of the lakefront to the northeast.
Data | Crime | Cost of living | Movers
$124,111 median income · $502,195 median home · #8 home prices in Michigan
Grosse Pointe Park is a city in Wayne County in the U.S. state of Michigan. The population was 11,555 at the 2010 census. Bordering on Detroit with frontage on southern Lake Saint Clair, it is the westernmost of the noted Grosse Pointe suburbs, with the oldest overall housing stock of the five cities. Grosse Pointe Park is 6 miles east of downtown Detroit and thus is home to many who commute to the city on a daily basis. The area is often referred to simply as ‘GPP’ or “The Park”. Many locals call the area from Alter Road to Nottingham in between Jefferson Avenue and Mack Avenue the Cabbage Patch, due to how the duplex style houses are closer together than the rest of the city.
Data | Crime | Cost of living | Movers
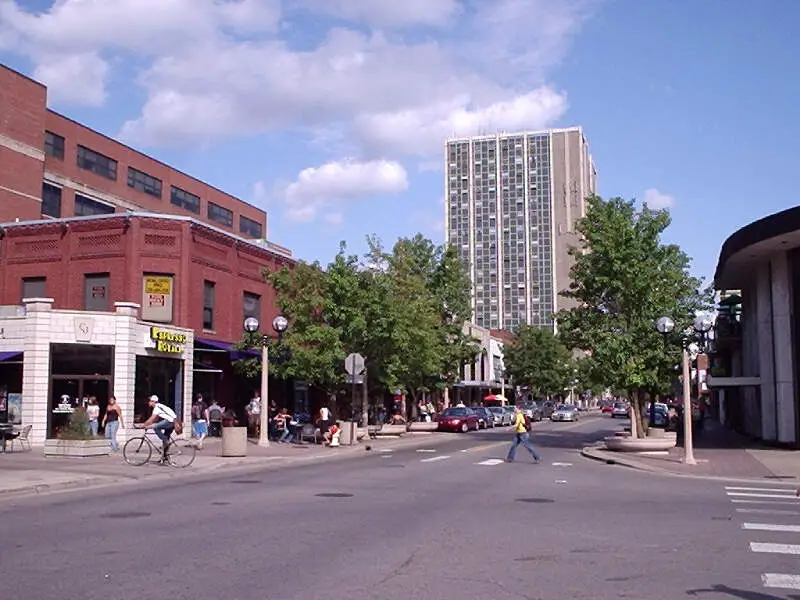
$82,212 median income · $523,391 median home · #6 home prices in Michigan
Ann Arbor is a city in the U.S. state of Michigan and the county seat of Washtenaw County. The 2010 census recorded its population to be 113,934, making it the sixth largest city in Michigan.
Data | Crime | Cost of living | Movers
$158,853 median income · $469,116 median home · #13 home prices in Michigan
Grosse Pointe is a waterfront city adjacent to Detroit in Wayne County in the U.S. state of Michigan. The municipality covers just over one square mile and had a population of 5,421 at the 2010 census. It is bordered on the west by Grosse Pointe Park, on the north by Detroit, on the east by Grosse Pointe Farms, and on the south by Lake Saint Clair. Grosse Pointe is about eight miles east of downtown Detroit, accessible by Jefferson Avenue or several other cross streets. Grosse Pointe is one of five similarly named municipalities in northeastern Wayne County, and is often called “The City” or Grosse Pointe City.
Data | Crime | Cost of living | Movers
$120,694 median income · $465,253 median home · #16 home prices in Michigan
Rochester Hills is a city in northeast Oakland County of the U.S. state of Michigan, in the northern outskirts of Metropolitan Detroit area. As of the 2010 census, the city had a total population of 70,995.
Data | Crime | Cost of living | Movers
The receipts
Compare the top ten
Pick a metric. The bars rescale. The red line is Michigan’s statewide median.
Michigan statewide median: $259,857
Michigan statewide median: $72,875
On the map
Mapping the most expensive places in Michigan
Saturday Night Science
Methodology: How We Determined The Most Expensive Places To Live In The Wolverine State For 2026
The two most important things to think about when it comes to being able to afford a city in Michigan are how much money you make and how much you have to spend to live there.
You need to understand your costs in the context of how much money you make.
For example, if the median household earns $100,000 and spends $40,000 on housing, it’s actually cheaper to live there than a place with a median income of $50,000 and housing costs of $21,000. You might spend more on housing, but you have more money overall to play with.
With that example in mind, we derived several statistics from the latest Census American Community Survey 2020-2024 around incomes and costs. They are:
- Overall Cost Of Living Index
- Median Home Price / Median Income (lower is better)
- Median Income / Median Rent (Higher is better)
- Median Home Price
You can then compare these metrics in each of the places in Michigan to figure out which is the most expensive.
You are left with a “Cost of Living Index” by taking the average rank of each of these metrics for each city.
So we used that cost of living index to rank all of the 153 places in Michigan that have more than 5,000 people.
The place with the highest cost of living in Michigan according to the data is Birmingham. We updated this article for 2026. This article is our eleventh time ranking the most expensive places to live in Michigan. The median Michigan home is 54 years old — old enough that it pays to compare home warranty plans before something expensive breaks.
The full plate
Most Expensive Cities In Michigan
Click any column to sort. Search by city name.
| Rank | City | Cost Of Living | Population | Median Income | Average Home Price | Home/Income Ratio |
|---|---|---|---|---|---|---|
| 1 | Birmingham | 146 | 21,763 | $153,510 | $733,351 | 4.8x |
| 2 | Huntington Woods | 132 | 6,328 | $190,150 | $537,208 | 2.8x |
| 3 | Beverly Hills | 127 | 10,524 | $177,412 | $587,951 | 3.3x |
| 4 | East Grand Rapids | 125 | 11,445 | $166,610 | $664,184 | 4.0x |
| 5 | Rochester | 124 | 12,934 | $111,750 | $486,537 | 4.4x |
| 6 | Grosse Pointe Farms | 124 | 9,904 | $161,208 | $513,933 | 3.2x |
| 7 | Grosse Pointe Park | 123 | 11,319 | $124,111 | $502,195 | 4.0x |
| 8 | Ann Arbor | 122 | 122,036 | $82,212 | $523,391 | 6.4x |
| 9 | Grosse Pointe | 122 | 5,541 | $158,853 | $469,116 | 3.0x |
| 10 | Rochester Hills | 118 | 77,089 | $120,694 | $465,253 | 3.9x |
| 11 | Novi | 116 | 66,717 | $110,723 | $467,223 | 4.2x |
| 12 | Northville | 116 | 6,069 | $145,530 | $588,077 | 4.0x |
| 13 | Troy | 114 | 87,898 | $120,045 | $457,480 | 3.8x |
| 14 | Plymouth | 113 | 9,214 | $112,145 | $471,425 | 4.2x |
| 15 | Farmington Hills | 112 | 83,515 | $104,836 | $387,308 | 3.7x |
| 16 | Traverse City | 111 | 15,593 | $74,087 | $437,525 | 5.9x |
| 17 | Chelsea | 111 | 5,426 | $72,098 | $411,817 | 5.7x |
| 18 | Grosse Pointe Woods | 110 | 16,094 | $126,395 | $349,101 | 2.8x |
| 19 | Saline | 109 | 9,006 | $88,346 | $465,110 | 5.3x |
| 20 | Milford | 108 | 6,487 | $105,713 | $481,467 | 4.6x |
| 21 | Royal Oak | 107 | 57,950 | $101,109 | $331,359 | 3.3x |
| 22 | Berkley | 105 | 15,149 | $116,239 | $314,815 | 2.7x |
| 23 | Farmington | 105 | 11,504 | $97,750 | $327,491 | 3.4x |
| 24 | Rockford | 105 | 6,218 | $107,121 | $450,322 | 4.2x |
| 25 | Wixom | 104 | 17,295 | $65,485 | $384,492 | 5.9x |
| 26 | Brighton | 104 | 7,688 | $80,682 | $432,666 | 5.4x |
| 27 | New Baltimore | 103 | 12,072 | $106,033 | $354,733 | 3.3x |
| 28 | South Lyon | 103 | 11,950 | $92,467 | $467,292 | 5.1x |
| 29 | Sterling Heights | 102 | 133,573 | $79,909 | $306,785 | 3.8x |
| 30 | East Lansing | 102 | 45,758 | $45,687 | $311,383 | 6.8x |
| 31 | Livonia | 101 | 93,851 | $98,460 | $309,576 | 3.1x |
| 32 | Walker | 101 | 25,386 | $76,360 | $352,818 | 4.6x |
| 33 | Ferndale | 101 | 19,190 | $94,640 | $250,328 | 2.6x |
| 34 | Clawson | 101 | 11,374 | $88,636 | $286,026 | 3.2x |
| 35 | Petoskey | 101 | 5,856 | $74,196 | $472,426 | 6.4x |
| 36 | Frankenmuth | 100 | 5,157 | $85,433 | $315,291 | 3.7x |
| 37 | Southfield | 99 | 76,236 | $68,166 | $250,952 | 3.7x |
| 38 | Marquette | 99 | 21,325 | $55,613 | $323,189 | 5.8x |
| 39 | Grand Rapids | 98 | 198,535 | $69,108 | $303,298 | 4.4x |
| 40 | Holland | 98 | 34,423 | $75,865 | $364,546 | 4.8x |
| 41 | Woodhaven | 98 | 12,690 | $78,648 | $266,356 | 3.4x |
| 42 | St. Joseph | 98 | 7,986 | $84,057 | $328,307 | 3.9x |
| 43 | St. Clair | 98 | 5,585 | $69,688 | $311,688 | 4.5x |
| 44 | Dearborn | 97 | 107,423 | $65,324 | $245,068 | 3.8x |
| 45 | Norton Shores | 97 | 25,041 | $76,579 | $287,720 | 3.8x |
| 46 | Riverview | 97 | 12,186 | $73,468 | $242,241 | 3.3x |
| 47 | Milan | 97 | 5,987 | $96,949 | $303,662 | 3.1x |
| 48 | Richmond | 97 | 5,855 | $64,719 | $303,793 | 4.7x |
| 49 | Utica | 97 | 5,180 | $58,718 | $253,468 | 4.3x |
| 50 | Portage | 96 | 49,259 | $83,212 | $292,450 | 3.5x |
| 51 | Auburn Hills | 96 | 25,105 | $84,375 | $277,483 | 3.3x |
| 52 | Trenton | 96 | 18,125 | $82,212 | $239,684 | 2.9x |
| 53 | Grand Blanc | 96 | 7,987 | $68,052 | $285,257 | 4.2x |
| 54 | Zeeland | 96 | 5,665 | $52,628 | $382,237 | 7.3x |
| 55 | Warren | 95 | 137,928 | $64,016 | $196,785 | 3.1x |
| 56 | Oak Park | 95 | 29,318 | $71,510 | $232,982 | 3.3x |
| 57 | Ypsilanti | 95 | 19,857 | $46,588 | $282,887 | 6.1x |
| 58 | Fenton | 95 | 11,906 | $80,000 | $355,969 | 4.4x |
| 59 | Howell | 95 | 10,021 | $60,449 | $377,375 | 6.2x |
| 60 | Mason | 95 | 8,249 | $79,117 | $275,133 | 3.5x |
| 61 | Hudsonville | 95 | 7,769 | $91,280 | $417,204 | 4.6x |
| 62 | Walled Lake | 95 | 7,299 | $72,055 | $242,300 | 3.4x |
| 63 | Dundee | 95 | 5,744 | $78,837 | $286,249 | 3.6x |
| 64 | St. Clair Shores | 94 | 58,140 | $73,500 | $227,950 | 3.1x |
| 65 | Kentwood | 94 | 54,296 | $74,373 | $331,531 | 4.5x |
| 66 | Southgate | 94 | 29,366 | $66,118 | $192,161 | 2.9x |
| 67 | Madison Heights | 94 | 28,419 | $69,503 | $219,511 | 3.2x |
| 68 | Allen Park | 94 | 27,925 | $81,655 | $206,256 | 2.5x |
| 69 | Grandville | 94 | 16,356 | $78,442 | $353,731 | 4.5x |
| 70 | Grand Haven | 94 | 10,996 | $60,669 | $391,797 | 6.5x |
| 71 | Dearborn Heights | 93 | 61,771 | $60,391 | $212,389 | 3.5x |
| 72 | Mount Pleasant | 93 | 21,236 | $44,706 | $220,400 | 4.9x |
| 73 | Flat Rock | 93 | 10,340 | $81,585 | $257,473 | 3.2x |
| 74 | Marysville | 93 | 9,925 | $66,901 | $227,854 | 3.4x |
| 75 | Houghton | 93 | 8,474 | $43,456 | $262,335 | 6.0x |
| 76 | Grand Ledge | 93 | 7,804 | $68,980 | $296,333 | 4.3x |
| 77 | St. Johns | 93 | 7,715 | $68,728 | $286,182 | 4.2x |
| 78 | New Haven | 93 | 6,475 | $66,125 | $308,844 | 4.7x |
| 79 | Westland | 92 | 83,633 | $62,076 | $211,889 | 3.4x |
| 80 | Wyoming | 92 | 77,353 | $73,677 | $286,890 | 3.9x |
| 81 | Midland | 92 | 42,724 | $73,325 | $247,417 | 3.4x |
| 82 | Tecumseh | 92 | 8,646 | $62,835 | $254,886 | 4.1x |
| 83 | Ludington | 92 | 7,676 | $46,411 | $298,513 | 6.4x |
| 84 | Allegan | 92 | 5,172 | $52,925 | $279,562 | 5.3x |
| 85 | Harper Woods | 91 | 15,116 | $65,022 | $153,570 | 2.4x |
| 86 | Fraser | 91 | 14,583 | $64,354 | $234,792 | 3.6x |
| 87 | Marshall | 91 | 6,804 | $76,050 | $240,469 | 3.2x |
| 88 | Garden City | 90 | 26,739 | $67,294 | $200,241 | 3.0x |
| 89 | Romulus | 90 | 24,831 | $69,151 | $203,010 | 2.9x |
| 90 | Ionia | 90 | 12,753 | $63,978 | $222,836 | 3.5x |
| 91 | Charlotte | 90 | 9,277 | $62,681 | $235,060 | 3.8x |
| 92 | Holly | 90 | 5,964 | $64,305 | $320,381 | 5.0x |
| 93 | Davison | 90 | 5,076 | $48,814 | $253,626 | 5.2x |
| 94 | Port Huron | 89 | 28,620 | $50,366 | $170,018 | 3.4x |
| 95 | Hastings | 89 | 7,520 | $58,286 | $235,811 | 4.0x |
| 96 | Manistee | 89 | 6,275 | $60,541 | $257,759 | 4.3x |
| 97 | Belding | 89 | 5,960 | $60,373 | $264,511 | 4.4x |
| 98 | Swartz Creek | 89 | 5,853 | $71,571 | $245,863 | 3.4x |
| 99 | Eaton Rapids | 89 | 5,183 | $63,875 | $250,600 | 3.9x |
| 100 | Lansing | 88 | 113,023 | $54,382 | $163,359 | 3.0x |
Source: U.S. Census ACS 2020-2024, Zillow research. 153 places with more than 5,000 residents.
Summary
Summary: Taking A Chunk Out Of Your Paycheck In Michigan For 2026
Well, there you have it, the places in Michigan that have the highest cost of living, with Birmingham ranking as the most expensive city in the Wolverine State.
The most expensive cities in Michigan are Birmingham, Huntington Woods, Beverly Hills, East Grand Rapids, Rochester, Grosse Pointe Farms, Grosse Pointe Park, Ann Arbor, Grosse Pointe, and Rochester Hills. Not sold on Michigan? Take the two-minute Find Your Place quiz and see which state actually fits you.
Questions and answers
Most Expensive Places In Michigan FAQs
What is the most expensive place to live in Michigan?
Birmingham is the most expensive place to live in Michigan for 2026. The median home there runs $733,351, and it posts the highest cost of living of the 153 places we scored.
What are the 10 most expensive cities in Michigan?
The ten most expensive cities in Michigan are Birmingham, Huntington Woods, Beverly Hills, East Grand Rapids, Rochester, Grosse Pointe Farms, Grosse Pointe Park, Ann Arbor, Grosse Pointe, and Rochester Hills. We ranked all 153 places with more than 5,000 residents on home prices, incomes, and an overall cost of living index.
How expensive are homes in Birmingham?
The median home value in Birmingham is $733,351, versus $259,857 across Michigan as a whole. Across the ten most expensive cities, the median home runs $518,662.
What salary do you need to live in the most expensive parts of Michigan?
The median household income in the ten most expensive Michigan cities starts at $82,212, and in Birmingham it is $153,510. If your paycheck is closer to the statewide median of $72,875, these places will squeeze your budget.
What is the cheapest place to live in Michigan?
River Rouge is the cheapest of the 153 Michigan places we ranked on cost of living. It sits at the very bottom of the same index that put Birmingham on top.


