Are you looking for love in Michigan?
Or are you just hoping to hook up with a hot Michigander?
Either way, we’ve got you covered here.
If you live in Michigan, there’s a pretty good chance there are a lot of singles in your area. The Wolverine State has plenty of people over 18 who aren’t married or in a serious relationship.
That’s great news for people who are single and looking to mingle.
So, where are the best cities for singles in Michigan? We used Saturday Night Science to find out.
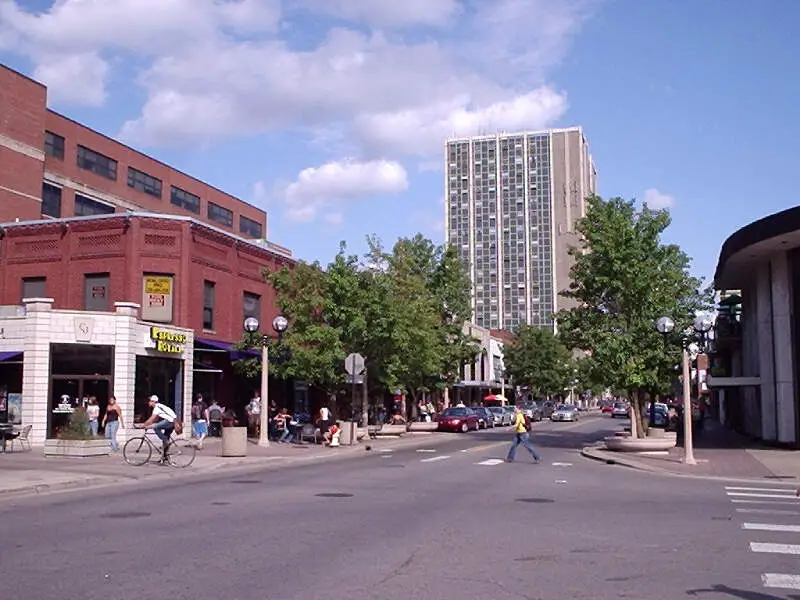
27.7 median age · 13.0% married households
Ann Arbor is a city in the U.S. state of Michigan and the county seat of Washtenaw County. The 2010 census recorded its population to be 113,934, making it the sixth largest city in Michigan.
Data | Crime | Cost of living | Movers
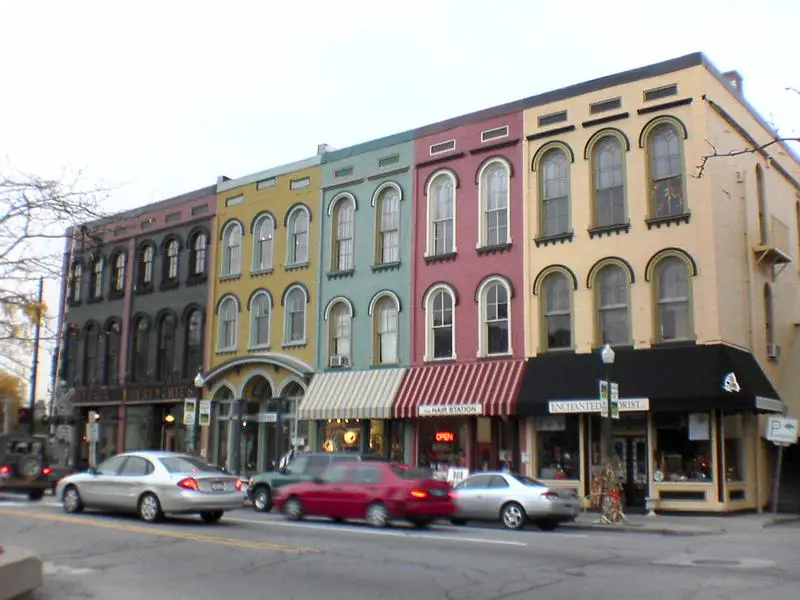
27.7 median age · 12.0% married households
Ypsilanti, commonly shortened to Ypsi, is a city in Washtenaw County in the U.S. state of Michigan, perhaps best known as the home of Eastern Michigan University. As of the 2017 census, the city’s population was 21,018. The city is bounded to the north by Superior Township and on the west, south, and east by Ypsilanti Township. Ypsilanti is located 6 miles east of Ann Arbor and about 18 miles west of the Detroit city limits.
Data | Crime | Cost of living | Movers
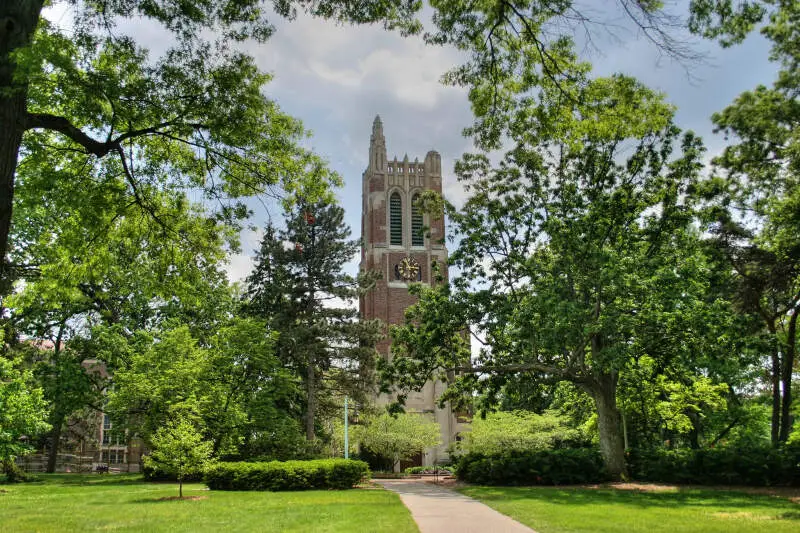
21.3 median age · 9.0% married households
East Lansing is a city in the U.S. state of Michigan directly east of Lansing, the state capital. Most of the city is within Ingham County, with the rest in Clinton County. The population was 48,579 at the 2010 census, an increase from 46,420 in 2000. It is best known as the home of Michigan State University.
Data | Crime | Cost of living | Movers
39.0 median age · 24.0% married households
Madison Heights is a city in Oakland County of the U.S. state of Michigan. It is a suburb of Detroit. As of the 2010 census, its population was 29,694.
Data | Crime | Cost of living | Movers
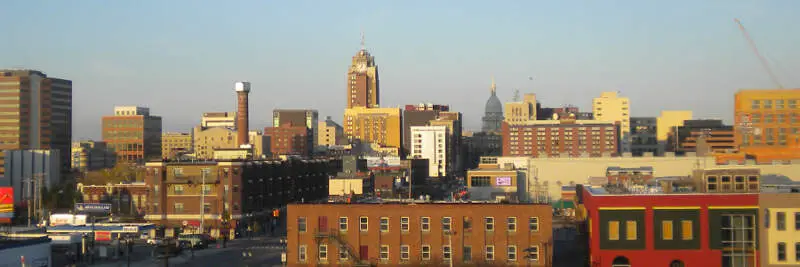
33.7 median age · 21.0% married households
Lansing is the capital of the U.S. state of Michigan. It is mostly in Ingham County, although portions of the city extend west into Eaton County and north into Clinton County. The 2010 Census placed the city’s population at 114,297, making it the fifth largest city in Michigan. The population of its Metropolitan Statistical Area was 464,036, while the even larger Combined Statistical Area population, which includes Shiawassee County, was 534,684. It was named the new state capital of Michigan in 1847, ten years after Michigan became a state.
Data | Crime | Cost of living | Movers
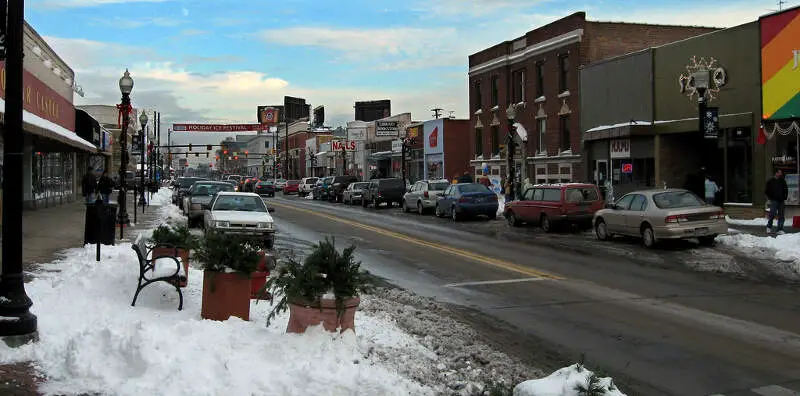
37.3 median age · 26.0% married households
Ferndale is a city in Oakland County of the U.S. state of Michigan. It forms part of the Detroit metropolitan area. As of the 2010 census, the city population was 19,900.
Data | Crime | Cost of living | Movers
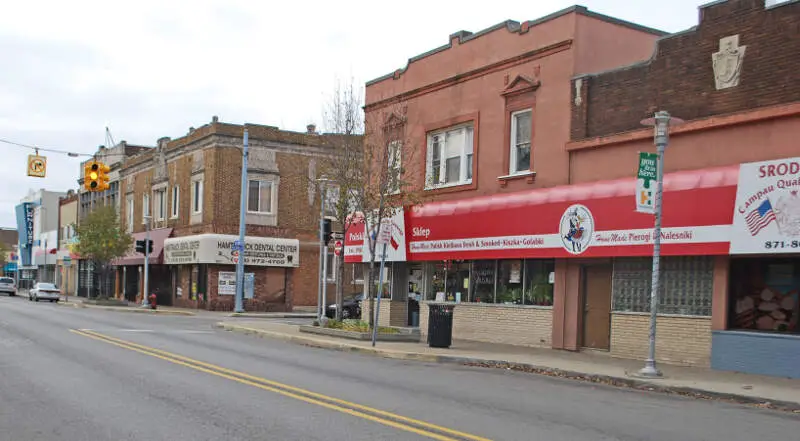
26.5 median age · 6.0% married households
Hamtramck is a city in Wayne County of the U.S. state of Michigan. As of the 2010 census, the city population was 22,423. Hamtramck is surrounded by the city of Detroit except for a small portion of the western border that touches the similarly surrounded city of Highland Park.
Data | Crime | Cost of living | Movers
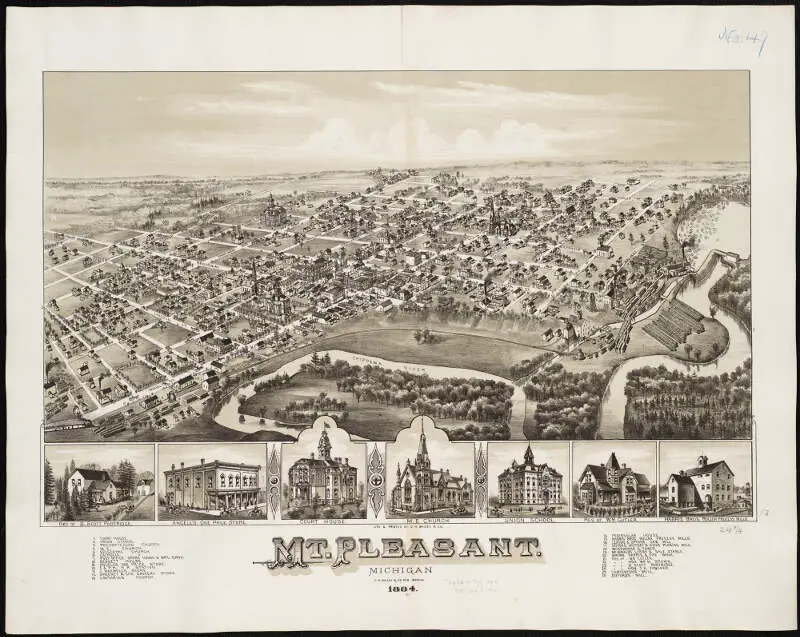
23.9 median age · 14.0% married households
Mount Pleasant is a city in the U.S. state of Michigan and the county seat of Isabella County, located in Central Michigan. The population was 26,016 at the 2010 census.
Data | Crime | Cost of living | Movers
36.9 median age · 27.0% married households
Royal Oak is a city in Oakland County of the U.S. state of Michigan. It is a suburb of Detroit. As of the 2010 census, the city had a population of 57,236. It is the 8th-largest municipality in Oakland County and the 27th-largest municipality in Michigan by population.
Data | Crime | Cost of living | Movers
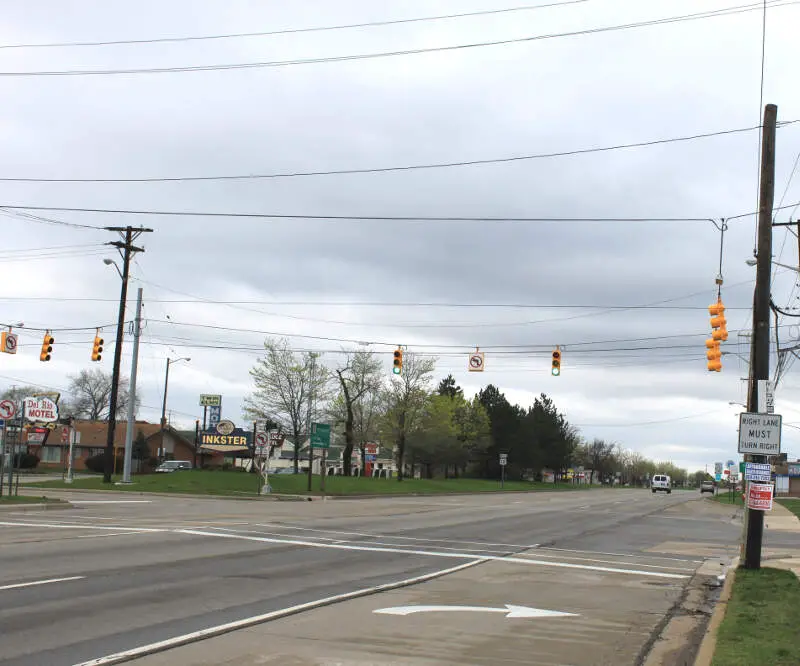
35.0 median age · 15.0% married households
Inkster is a city in Wayne County, Michigan, United States. At the 2010 census, the city population was 25,369. It is one of the few Metro Detroit suburbs whose population is majority African American.
Data | Crime | Cost of living | Movers
The receipts
Compare the top ten
Pick a metric. The bars rescale. The red line is Michigan’s statewide median.
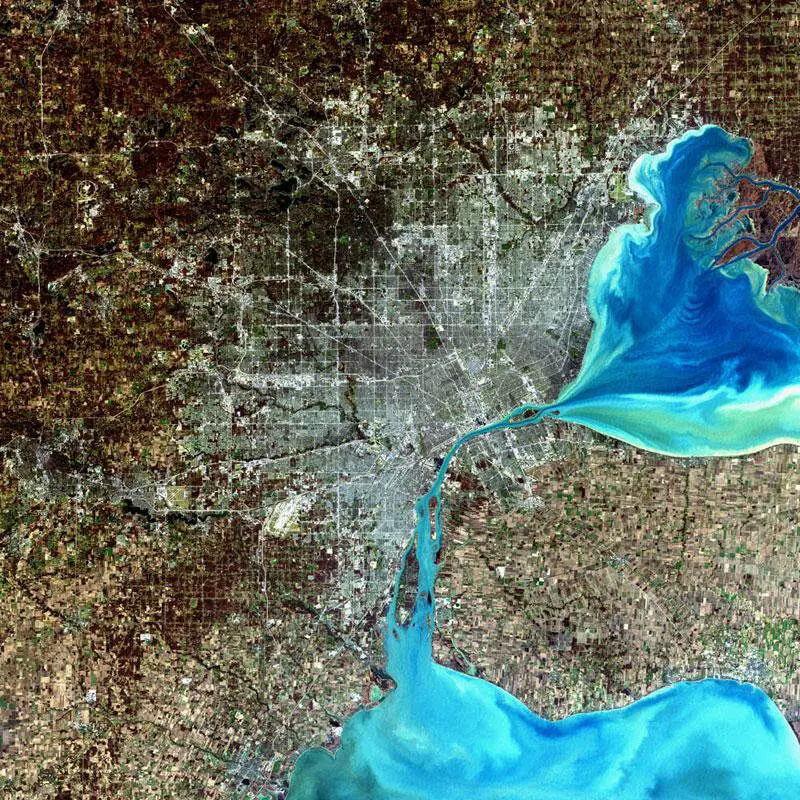
On the map
Where Michigan’s singles cluster
Saturday Night Science
Methodology: How do you determine which city is best for singles in Michigan anyways?
To give you the places in Michigan which are best for singles to find one another, we used Saturday Night Science to look at a handful of metrics. Of course, we want to measure the type of people who live in each city and make some assumptions about what single people like.
So we researched the internet for a database that contains all that information.
We threw a lot of criteria at this one to get the best, most complete results possible. Using the 2020-2024 American Community Survey Census data produced for the state of Michigan, we looked at every single city in the state. We paid particular attention to:
- Population density
- % of population that’s male vs. female (closer to a 50-50 ratio is better)
- % of households with kids
- Median age
- Number of unmarried people in each city
We then gave each city a “Singles Score.”
The higher the score, the better the city is for singles to find one another. We also limited our results to cities with over 10,000 people. For Michigan, that meant a total of 88 cities.
We updated this article for 2026. This is our eleventh time ranking the best cities for singles in Michigan.
Read on to see why Ann Arbor is the talk of the town while Flat Rock is probably a bit on the bland side.
The full plate
Best Cities For Singles In Michigan
Click any column to sort. Search by city name.
| Rank | City | Singles Score | Population | Median Age | % Married Households | % Households w/ Kids |
|---|---|---|---|---|---|---|
| 1 | Ann Arbor | 9.80 | 122,036 | 27.7 | 13.0% | 17.1% |
| 2 | Ypsilanti | 10.60 | 19,857 | 27.7 | 12.0% | 18.3% |
| 3 | East Lansing | 20.00 | 45,758 | 21.3 | 9.0% | 15.0% |
| 4 | Madison Heights | 22.90 | 28,419 | 39.0 | 24.0% | 17.2% |
| 5 | Lansing | 23.60 | 113,023 | 33.7 | 21.0% | 22.8% |
| 6 | Ferndale | 24.80 | 19,190 | 37.3 | 26.0% | 12.6% |
| 7 | Hamtramck | 26.00 | 27,743 | 26.5 | 6.0% | 48.7% |
| 8 | Mount Pleasant | 26.00 | 21,236 | 23.9 | 14.0% | 16.1% |
| 9 | Royal Oak | 26.50 | 57,950 | 36.9 | 27.0% | 17.3% |
| 10 | Inkster | 26.50 | 25,428 | 35.0 | 15.0% | 32.7% |
| 11 | Kalamazoo | 26.70 | 73,076 | 26.9 | 16.0% | 22.9% |
| 12 | Pontiac | 27.00 | 62,104 | 36.5 | 12.0% | 27.6% |
| 13 | Grand Rapids | 27.30 | 198,535 | 32.3 | 22.0% | 26.5% |
| 14 | Flint | 27.50 | 80,175 | 36.9 | 16.0% | 27.4% |
| 15 | Dearborn | 30.40 | 107,423 | 33.3 | 19.0% | 35.2% |
| 16 | Marquette | 31.20 | 21,325 | 30.9 | 21.0% | 15.1% |
| 17 | Hazel Park | 31.20 | 14,963 | 37.5 | 26.0% | 20.5% |
| 18 | Clawson | 32.10 | 11,374 | 39.4 | 30.0% | 18.8% |
| 19 | Dearborn Heights | 32.20 | 61,771 | 35.8 | 22.0% | 31.9% |
| 20 | Detroit | 32.80 | 638,530 | 35.2 | 13.0% | 27.8% |
| 21 | Oak Park | 33.20 | 29,318 | 38.1 | 22.0% | 23.0% |
| 22 | Lincoln Park | 33.30 | 39,257 | 35.2 | 26.0% | 29.6% |
| 23 | Farmington | 33.50 | 11,504 | 39.0 | 29.0% | 24.6% |
| 24 | Muskegon | 36.10 | 37,226 | 36.0 | 20.0% | 31.0% |
| 25 | Berkley | 36.30 | 15,149 | 37.8 | 40.0% | 24.9% |
| 26 | Niles | 36.90 | 11,803 | 39.2 | 18.0% | 25.0% |
| 27 | Jackson | 37.30 | 31,058 | 35.3 | 22.0% | 24.3% |
| 28 | Auburn Hills | 38.50 | 25,105 | 36.5 | 18.0% | 19.8% |
| 29 | Melvindale | 38.50 | 12,554 | 31.3 | 15.0% | 35.1% |
| 30 | Roseville | 38.80 | 47,123 | 41.0 | 30.0% | 24.6% |
| 31 | St. Clair Shores | 38.90 | 58,140 | 43.8 | 38.0% | 20.6% |
| 32 | Adrian | 39.20 | 20,395 | 35.8 | 20.0% | 26.9% |
| 33 | Westland | 39.30 | 83,633 | 38.1 | 25.0% | 24.3% |
| 34 | Wyoming | 39.30 | 77,353 | 34.0 | 29.0% | 34.4% |
| 35 | Wixom | 39.90 | 17,295 | 35.5 | 25.0% | 16.6% |
| 36 | Harper Woods | 41.00 | 15,116 | 37.1 | 18.0% | 31.2% |
| 37 | Wyandotte | 41.90 | 24,489 | 39.3 | 33.0% | 24.2% |
| 38 | Eastpointe | 42.20 | 33,982 | 36.1 | 24.0% | 32.6% |
| 39 | Saginaw | 42.60 | 43,536 | 35.5 | 20.0% | 29.4% |
| 40 | Mount Clemens | 43.10 | 15,511 | 42.0 | 29.0% | 21.3% |
| 41 | Warren | 43.80 | 137,928 | 38.3 | 26.0% | 28.5% |
| 42 | Wayne | 43.80 | 17,310 | 42.5 | 31.0% | 25.3% |
| 43 | Port Huron | 43.90 | 28,620 | 38.6 | 30.0% | 26.6% |
| 44 | Kentwood | 44.40 | 54,296 | 35.1 | 25.0% | 29.5% |
| 45 | Taylor | 45.00 | 62,081 | 37.9 | 28.0% | 28.1% |
| 46 | Howell | 45.10 | 10,021 | 40.8 | 32.0% | 20.2% |
| 47 | South Lyon | 45.30 | 11,950 | 41.8 | 36.0% | 24.7% |
| 48 | Southgate | 46.90 | 29,366 | 39.2 | 35.0% | 26.3% |
| 49 | Sault Ste. Marie | 47.30 | 13,335 | 34.0 | 25.0% | 24.0% |
| 50 | Sturgis | 47.40 | 11,054 | 34.1 | 20.0% | 34.2% |
| 51 | Sterling Heights | 47.60 | 133,573 | 41.7 | 26.0% | 27.1% |
| 52 | Farmington Hills | 48.70 | 83,515 | 42.6 | 28.0% | 25.2% |
| 53 | Livonia | 49.10 | 93,851 | 44.8 | 38.0% | 24.1% |
| 54 | Cadillac | 49.10 | 10,445 | 40.7 | 30.0% | 24.5% |
| 55 | Coldwater | 49.60 | 13,671 | 39.5 | 21.0% | 31.3% |
| 56 | Southfield | 50.30 | 76,236 | 42.3 | 22.0% | 21.4% |
| 57 | East Grand Rapids | 50.70 | 11,445 | 37.0 | 44.0% | 50.3% |
| 58 | Alpena | 51.40 | 10,154 | 46.0 | 30.0% | 18.8% |
| 59 | Birmingham | 51.60 | 21,763 | 41.8 | 33.0% | 28.4% |
| 60 | Riverview | 52.00 | 12,186 | 40.6 | 37.0% | 28.0% |
| 61 | Ionia | 52.20 | 12,753 | 36.6 | 25.0% | 26.6% |
| 62 | Holland | 54.10 | 34,423 | 31.7 | 27.0% | 31.7% |
| 63 | Rochester | 54.20 | 12,934 | 41.2 | 29.0% | 27.0% |
| 64 | Portage | 54.30 | 49,259 | 38.5 | 33.0% | 27.7% |
| 65 | Battle Creek | 54.40 | 52,374 | 38.0 | 23.0% | 28.4% |
| 66 | Novi | 54.70 | 66,717 | 40.0 | 22.0% | 34.9% |
| 67 | Fraser | 54.70 | 14,583 | 43.0 | 33.0% | 25.7% |
| 68 | Walker | 54.80 | 25,386 | 36.9 | 36.0% | 25.0% |
| 69 | Grandville | 55.60 | 16,356 | 34.1 | 43.0% | 30.4% |
| 70 | Owosso | 56.10 | 14,632 | 38.9 | 32.0% | 27.6% |
| 71 | Rochester Hills | 56.20 | 77,089 | 41.0 | 30.0% | 30.8% |
| 72 | Trenton | 56.20 | 18,125 | 48.2 | 41.0% | 23.5% |
| 73 | Troy | 57.30 | 87,898 | 42.0 | 24.0% | 31.5% |
| 74 | Escanaba | 59.60 | 12,354 | 44.4 | 29.0% | 20.7% |
| 75 | Grosse Pointe Park | 60.70 | 11,319 | 41.4 | 40.0% | 29.3% |
| 76 | Midland | 61.30 | 42,724 | 39.3 | 35.0% | 26.8% |
| 77 | Allen Park | 61.60 | 27,925 | 43.1 | 39.0% | 27.2% |
| 78 | Monroe | 61.70 | 20,320 | 37.6 | 32.0% | 30.1% |
| 79 | Grosse Pointe Woods | 63.10 | 16,094 | 43.6 | 42.0% | 28.1% |
| 80 | Fenton | 63.50 | 11,906 | 38.8 | 35.0% | 26.5% |
| 81 | Norton Shores | 63.70 | 25,041 | 40.6 | 47.0% | 31.2% |
| 82 | Romulus | 63.80 | 24,831 | 37.9 | 35.0% | 33.7% |
| 83 | Woodhaven | 64.40 | 12,690 | 45.6 | 36.0% | 22.1% |
| 84 | Grand Haven | 65.70 | 10,996 | 46.8 | 37.0% | 18.2% |
| 85 | New Baltimore | 66.00 | 12,072 | 44.7 | 44.0% | 26.3% |
| 86 | Burton | 67.30 | 29,500 | 43.7 | 32.0% | 25.3% |
| 87 | Beverly Hills | 69.40 | 10,524 | 46.0 | 43.0% | 37.3% |
| 88 | Flat Rock | 71.50 | 10,340 | 39.3 | 42.0% | 31.0% |
Source: U.S. Census ACS 2020-2024. 88 cities with more than 10,000 residents.
Summary
Summary: The Best Cities For Singles In Michigan For 2026
If you’re looking for a breakdown of cities in Michigan ranked by criteria that most agree make a place a great spot for finding a single person (and potentially love), this is an accurate list.
The best cities for singles in Michigan are Ann Arbor, Ypsilanti, East Lansing, Madison Heights, Lansing, Ferndale, Hamtramck, Mount Pleasant, Royal Oak, and Inkster.


