
Everyone wants a bit of a blissful breeze or a scoop of sunny sanctuary when looking for a place to live in Indiana.
The more sun, the more you can go outside. The more you go outside, the more you’ll feel at peace. The more you’ll feel at peace, the more you’ll enjoy where you live.
So it makes sense to try and find the places with the best weather in Indiana. We used Saturday Night Science to compare the number of sunny days, total precipitation, and the deviation from the ideal 70-degree weather for 78 places in Indiana over 10,000 people.
Grab your shades and put away your raincoat as we look at the cities with the best weather in Indiana.
Table Of Contents: Top Ten | Methodology | Table
The 10 Cities With The Best Weather In Indiana For 2025
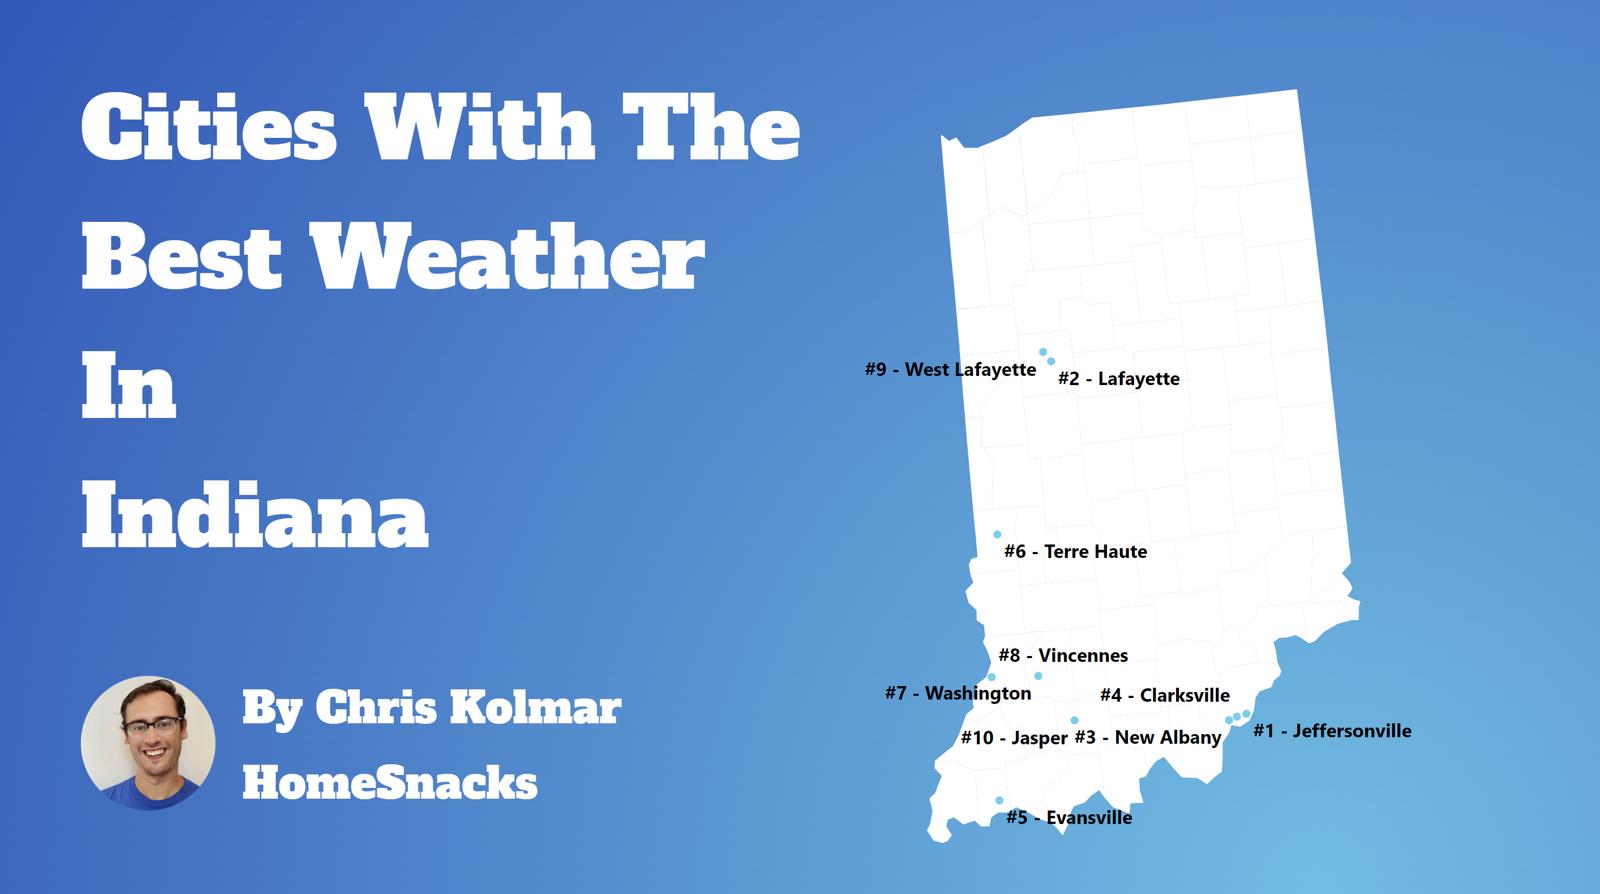
What city has the best weather in Indiana, with more than 10,000 people? The city with the best weather in Indiana is Jeffersonville with 7.8 sunny days and an average high of 67.0 degrees.
Read on below to see where your city ranked.
And if you already knew these places were beautiful, check out the best places to live in Indiana or the cheapest places in Indiana.
The 10 Snowiest Cities In Indiana For 2025

Population: 46,259
Average Annual High: 67.0 degrees
Average Annual Low: 46.7 degrees
Average Annual Snowfall: 7.8 inches
Average Annual Precipitation: 45.0 inches
Sunny Days: 290.8 days
More on Jeffersonville: Data

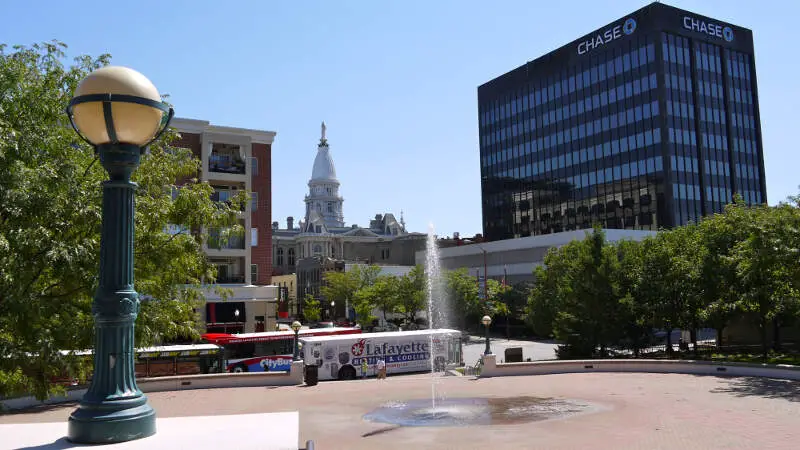
Population: 70,661
Average Annual High: 62.2 degrees
Average Annual Low: 41.8 degrees
Average Annual Snowfall: 19.0 inches
Average Annual Precipitation: 38.0 inches
Sunny Days: 294.4 days
More on Lafayette: Data

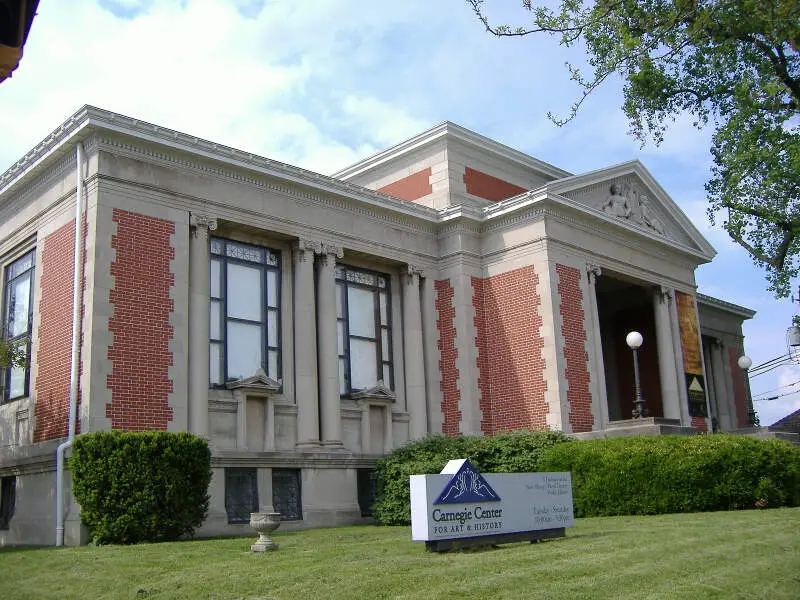
Population: 36,582
Average Annual High: 65.8 degrees
Average Annual Low: 45.1 degrees
Average Annual Snowfall: 9.1 inches
Average Annual Precipitation: 45.4 inches
Sunny Days: 290.2 days
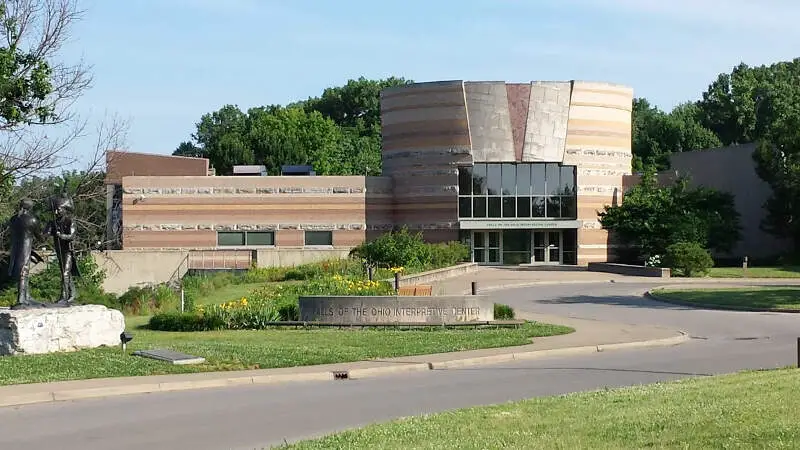
More on New Albany: Data

Population: 21,627
Average Annual High: 66.1 degrees
Average Annual Low: 45.2 degrees
Average Annual Snowfall: 10.4 inches
Average Annual Precipitation: 45.4 inches
Sunny Days: 289.9 days
More on Clarksville: Data

Population: 120,212
Average Annual High: 66.9 degrees
Average Annual Low: 46.9 degrees
Average Annual Snowfall: 11.2 inches
Average Annual Precipitation: 45.9 inches
Sunny Days: 289.9 days
More on Evansville: Data

Population: 61,061
Average Annual High: 64.0 degrees
Average Annual Low: 43.4 degrees
Average Annual Snowfall: 16.6 inches
Average Annual Precipitation: 42.4 inches
Sunny Days: 289.6 days
More on Terre Haute: Data

Population: 11,874
Average Annual High: 65.0 degrees
Average Annual Low: 44.2 degrees
Average Annual Snowfall: 10.7 inches
Average Annual Precipitation: 46.3 inches
Sunny Days: 289.4 days
More on Washington: Data

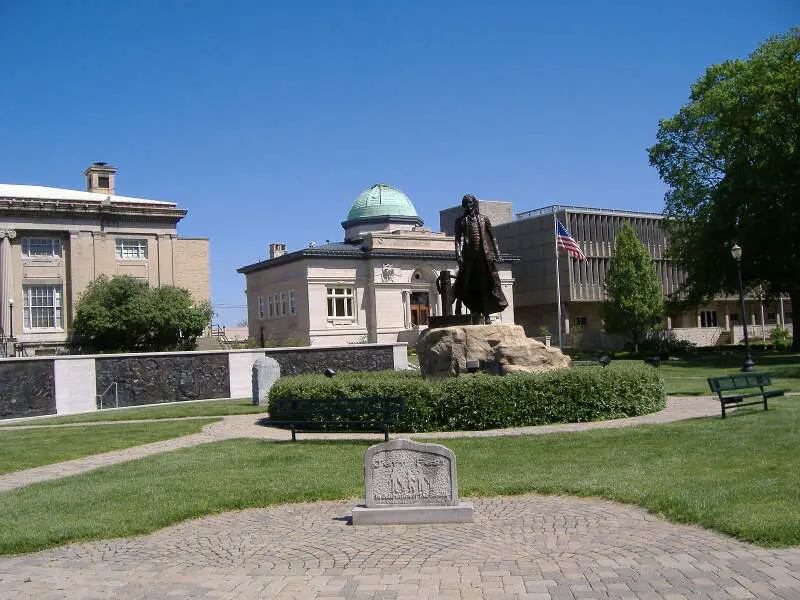
Population: 18,135
Average Annual High: 64.9 degrees
Average Annual Low: 44.5 degrees
Average Annual Snowfall: 11.0 inches
Average Annual Precipitation: 45.5 inches
Sunny Days: 289.3 days
More on Vincennes: Data


Population: 43,999
Average Annual High: 61.8 degrees
Average Annual Low: 41.4 degrees
Average Annual Snowfall: 19.0 inches
Average Annual Precipitation: 38.6 inches
Sunny Days: 293.5 days
More on West Lafayette: Data

Population: 15,538
Average Annual High: 65.6 degrees
Average Annual Low: 44.2 degrees
Average Annual Snowfall: 10.7 inches
Average Annual Precipitation: 47.1 inches
Sunny Days: 287.4 days
More on Jasper: Data
How We Determined The Cities In Indiana With The Best Weather
To rank the most fair weather cities in Indiana, we used Saturday Night Science and the National Oceanic and Atmospheric Administration (NOAA) database, to see which cities in the Hoosier State get the best weather.
We used the following criteria to find the best weather:
- Number of sunny days
- Highest average low
- Average high deviation from 70 degrees
- Least amount of rain
- Least amount of snow
We ranked each city of over 10,000 people in Indiana from best to worst on each criterion. We then averaged each ranking into a weather quality index. The city with the best index, Jeffersonville, was anointed the city with the best weather in Indiana.
Before we get too far, here are the annual precipitation rates for major cities:
- Indianapolis — 42.2 inches
- Fort Wayne — 37.0 inches
- Evansville — 45.9 inches
The cities with the best weather in Indiana are Jeffersonville, Lafayette, New Albany, Clarksville, Evansville, Terre Haute, Washington, Vincennes, West Lafayette, and Jasper.
There’s a complete chart at the bottom.
If you’re curious, here are the places with the worst weather in Indiana:
- Granger
- Mishawaka
- South Bend
For more Indiana reading, check out:
- Most Dangerous Cities In Indiana
- Best Places To Raise A Family In Indiana
- Best Places To Retire In Indiana
Detailed List Of Places With The Best Weather In Indiana
| Rank | City | Population | Sunny Days | Avg. High | Precipitation (Inches) | Snow (Inches) |
|---|---|---|---|---|---|---|
| 1 | Jeffersonville | 46,259 | 290.8 | 67.0 | 45.0 | 7.8 |
| 2 | Lafayette | 70,661 | 294.4 | 62.2 | 38.0 | 19.0 |
| 3 | New Albany | 36,582 | 290.2 | 65.8 | 45.4 | 9.1 |
| 4 | Clarksville | 21,627 | 289.9 | 66.1 | 45.4 | 10.4 |
| 5 | Evansville | 120,212 | 289.9 | 66.9 | 45.9 | 11.2 |
| 6 | Terre Haute | 61,061 | 289.6 | 64.0 | 42.4 | 16.6 |
| 7 | Washington | 11,874 | 289.4 | 65.0 | 46.3 | 10.7 |
| 8 | Vincennes | 18,135 | 289.3 | 64.9 | 45.5 | 11.0 |
| 9 | West Lafayette | 43,999 | 293.5 | 61.8 | 38.6 | 19.0 |
| 10 | Jasper | 15,538 | 287.4 | 65.6 | 47.1 | 10.7 |
| 11 | Columbus | 45,868 | 287.6 | 63.1 | 44.2 | 15.2 |
| 12 | Hammond | 78,983 | 291.2 | 59.7 | 37.4 | 31.0 |
| 13 | Plainfield | 29,710 | 289.5 | 61.8 | 42.1 | 18.7 |
| 14 | East Chicago | 29,178 | 291.1 | 59.3 | 36.4 | 31.2 |
| 15 | Brownsburg | 23,484 | 289.5 | 61.8 | 42.1 | 18.7 |
| 16 | Avon | 15,145 | 289.5 | 61.8 | 42.1 | 18.7 |
| 17 | Beech Grove | 14,000 | 287.4 | 62.1 | 42.7 | 16.0 |
| 18 | Indianapolis | 841,449 | 289.0 | 62.1 | 42.2 | 21.6 |
| 19 | Shelbyville | 19,250 | 287.8 | 62.3 | 43.0 | 17.0 |
| 20 | Madison | 12,054 | 287.1 | 63.9 | 44.9 | 12.6 |
| 21 | Speedway | 12,100 | 288.3 | 62.1 | 42.3 | 21.4 |
| 22 | Noblesville | 58,013 | 288.0 | 61.7 | 41.3 | 19.4 |
| 23 | Franklin | 24,090 | 287.4 | 62.6 | 43.4 | 18.9 |
| 24 | Lebanon | 15,762 | 288.3 | 61.7 | 41.6 | 18.9 |
| 25 | Seymour | 18,861 | 285.0 | 64.4 | 46.1 | 13.1 |
| 26 | Greenwood | 53,828 | 287.4 | 62.3 | 43.1 | 20.3 |
| 27 | Munster | 23,250 | 290.5 | 59.8 | 38.5 | 30.6 |
| 28 | Bloomington | 82,813 | 285.4 | 63.6 | 47.0 | 15.8 |
| 29 | Bedford | 13,371 | 284.8 | 64.7 | 46.6 | 12.5 |
| 30 | New Haven | 15,832 | 293.9 | 60.1 | 36.7 | 28.8 |
| 31 | Martinsville | 11,739 | 287.3 | 62.5 | 43.5 | 19.2 |
| 32 | Highland | 23,285 | 290.5 | 59.7 | 38.4 | 30.6 |
| 33 | Greensburg | 12,054 | 284.5 | 62.9 | 43.9 | 14.2 |
| 34 | Gary | 78,483 | 290.3 | 59.7 | 38.1 | 35.8 |
| 35 | Merrillville | 35,322 | 290.7 | 59.7 | 38.3 | 31.9 |
| 36 | Schererville | 28,987 | 290.7 | 59.7 | 38.3 | 31.9 |
| 37 | Hobart | 28,943 | 290.7 | 59.7 | 38.3 | 31.9 |
| 38 | Griffith | 16,643 | 290.7 | 59.7 | 38.3 | 31.9 |
| 39 | Dyer | 16,257 | 290.7 | 59.7 | 38.3 | 31.9 |
| 40 | Lake Station | 12,268 | 290.7 | 59.7 | 38.3 | 31.9 |
| 41 | Crawfordsville | 15,982 | 288.4 | 61.6 | 41.5 | 18.8 |
| 42 | Anderson | 55,630 | 287.9 | 61.0 | 41.2 | 17.4 |
| 43 | Carmel | 85,367 | 287.1 | 61.7 | 41.9 | 22.7 |
| 44 | Westfield | 33,744 | 287.0 | 61.5 | 41.6 | 22.5 |
| 45 | St. John | 15,789 | 290.5 | 59.4 | 38.9 | 26.5 |
| 46 | Fort Wayne | 257,059 | 288.0 | 60.2 | 37.0 | 31.8 |
| 47 | Zionsville | 25,072 | 285.0 | 61.8 | 41.9 | 22.8 |
| 48 | Lawrence | 47,120 | 285.3 | 61.7 | 43.1 | 22.0 |
| 49 | Huntington | 17,231 | 289.0 | 60.6 | 39.2 | 27.4 |
| 50 | Greencastle | 10,314 | 284.6 | 62.0 | 43.4 | 19.8 |
| 51 | Connersville | 13,241 | 284.0 | 62.4 | 42.4 | 20.9 |
| 52 | Cedar Lake | 11,757 | 290.5 | 59.5 | 39.0 | 26.8 |
| 53 | Marion | 29,075 | 287.5 | 60.7 | 40.6 | 25.1 |
| 54 | Frankfort | 16,467 | 286.4 | 61.2 | 40.4 | 22.8 |
| 55 | Fishers | 83,177 | 283.2 | 61.6 | 42.0 | 21.5 |
| 56 | Muncie | 70,173 | 286.6 | 60.9 | 40.4 | 22.4 |
| 57 | Crown Point | 28,444 | 290.5 | 59.6 | 38.9 | 34.8 |
| 58 | Logansport | 17,716 | 287.4 | 60.2 | 39.8 | 24.4 |
| 59 | Yor | 11,268 | 286.5 | 60.9 | 40.8 | 22.9 |
| 60 | Richmond | 36,291 | 286.4 | 60.9 | 41.6 | 19.3 |
| 61 | Greenfield | 21,179 | 283.6 | 61.4 | 43.2 | 20.7 |
| 62 | Portage | 37,197 | 289.4 | 59.4 | 39.2 | 36.9 |
| 63 | Valparaiso | 32,123 | 289.4 | 59.4 | 39.2 | 36.9 |
| 64 | Chesterton | 14,124 | 289.4 | 59.4 | 39.2 | 36.9 |
| 65 | Auburn | 12,979 | 287.3 | 59.8 | 38.2 | 34.6 |
| 66 | Peru | 11,197 | 286.0 | 60.6 | 40.2 | 27.1 |
| 67 | Warsaw | 14,385 | 287.8 | 59.5 | 38.9 | 33.0 |
| 68 | Wabash | 10,469 | 286.3 | 60.2 | 39.9 | 28.9 |
| 69 | Kokomo | 58,054 | 282.3 | 61.0 | 41.4 | 32.5 |
| 70 | Michigan City | 31,412 | 278.9 | 58.8 | 38.0 | 48.6 |
| 71 | New Castle | 17,755 | 283.6 | 60.7 | 43.0 | 24.2 |
| 72 | Elkhart | 52,354 | 286.9 | 59.2 | 38.8 | 41.7 |
| 73 | Goshen | 32,946 | 286.9 | 59.2 | 38.8 | 41.7 |
| 74 | Plymouth | 10,031 | 286.9 | 59.5 | 40.1 | 44.7 |
| 75 | La Porte | 22,242 | 285.6 | 59.2 | 39.5 | 46.5 |
| 76 | South Bend | 100,590 | 286.5 | 59.1 | 39.3 | 64.3 |
| 77 | Mishawaka | 48,121 | 286.1 | 59.1 | 39.5 | 61.6 |
| 78 | Granger | 30,690 | 284.0 | 59.1 | 39.6 | 63.7 |