Everyone wants a bit of a blissful breeze or a scoop of sunny sanctuary when looking for a place to live in Ohio.
The more sun, the more you can go outside. The more you go outside, the more you’ll feel at peace. The more you’ll feel at peace, the more you’ll enjoy where you live.
So it makes sense to try and find the places with the best weather in Ohio. We used Saturday Night Science to compare the number of sunny days, total precipitation, and the deviation from the ideal 70-degree weather for 184 places in Ohio over 10,000 people.
Grab your shades and put away your raincoat as we look at the cities with the best weather in Ohio.
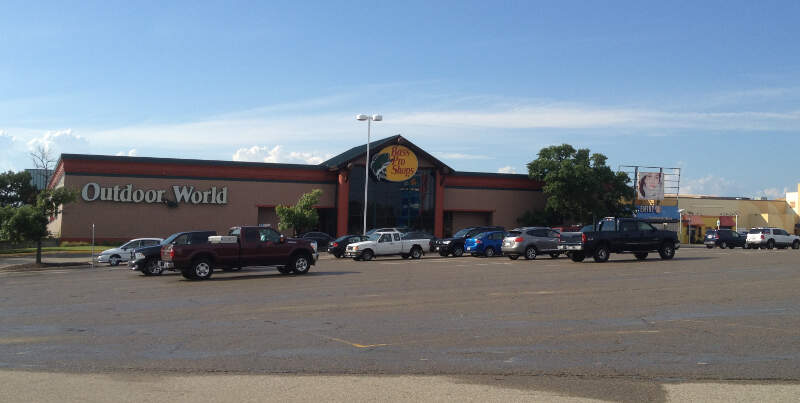
287.7 sunny days · 65.4 degree average high
Data | Crime | Cost of living | Movers
292.0 sunny days · 64.5 degree average high
Trenton is a city in northeastern Butler County, Ohio, United States, west of Middletown. Originally in Madison Township, it later annexed land in Wayne Township. The population was 11,869 at the 2010 census.
Data | Crime | Cost of living | Movers
287.7 sunny days · 65.0 degree average high
Forest Park is a city in Hamilton County, Ohio, United States. The population was 18,720 at the 2010 census.
Data | Crime | Cost of living | Movers

292.0 sunny days · 64.3 degree average high
Data | Crime | Cost of living | Movers
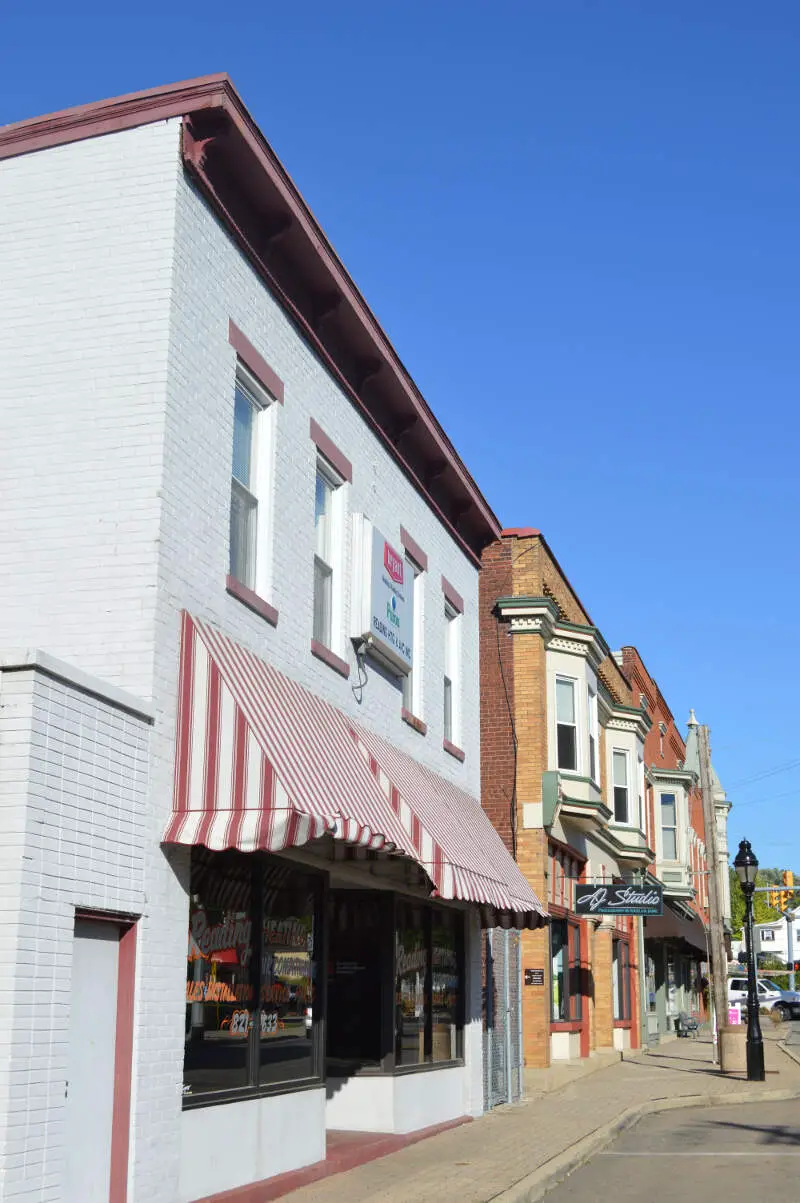
285.9 sunny days · 65.6 degree average high
Reading is a city in Hamilton County, Ohio, United States. The population was 10,385 at the 2010 census. It is a suburb of Cincinnati.
Data | Crime | Cost of living | Movers
287.7 sunny days · 65.3 degree average high
Fairfield is a city in Butler and Hamilton counties in the U.S. state of Ohio, and a residential suburb of nearby Cincinnati. Fairfield was incorporated in 1955. The population was 42,510 at the 2010 census. It includes the former hamlet of Symmes Corner, named after Celadon Symmes. The city school district is one of the largest in Ohio, with Fairfield High School graduating 842 students in June 2009.
Data | Crime | Cost of living | Movers
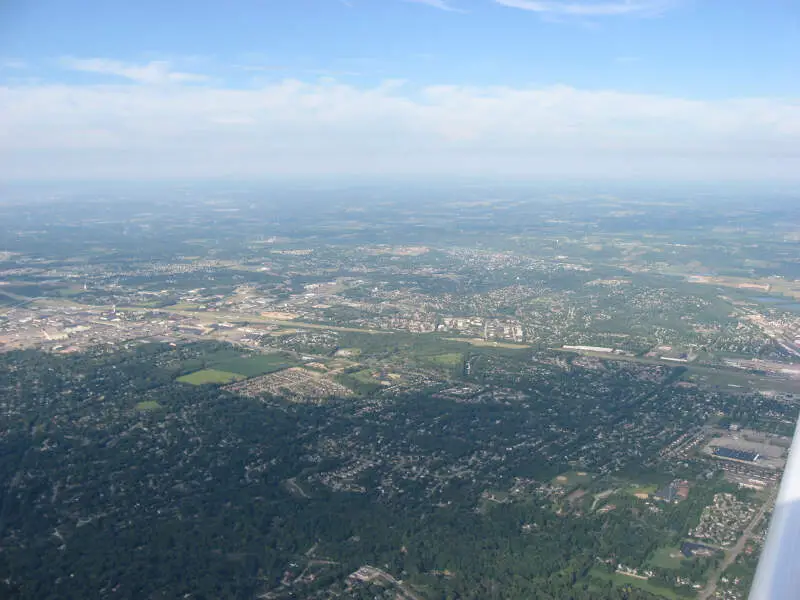
288.3 sunny days · 62.9 degree average high
West Carrollton is a city in Montgomery County, Ohio, United States. The population was 13,143 at the 2010 census. It is part of the Dayton Metropolitan Statistical Area. The Great Miami River runs through the town and forms most of its northern border.
Data | Crime | Cost of living | Movers
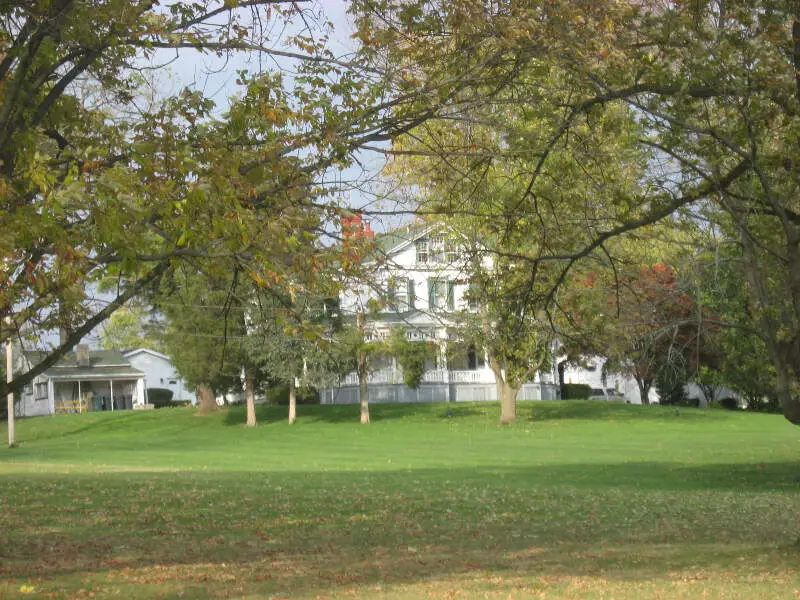
287.4 sunny days · 63.0 degree average high
Circleville is a city in and the county seat of Pickaway County, Ohio, United States, along the Scioto River. The population was 13,314 at the 2010 census.
Data | Crime | Cost of living | Movers
292.0 sunny days · 64.0 degree average high
Monroe is a city located in east central Butler and west central Warren counties in the southwestern part of the U.S. state of Ohio. As of the 2010 Census, the city population was 12,442, up from 4,008 in 1990.
Data | Crime | Cost of living | Movers
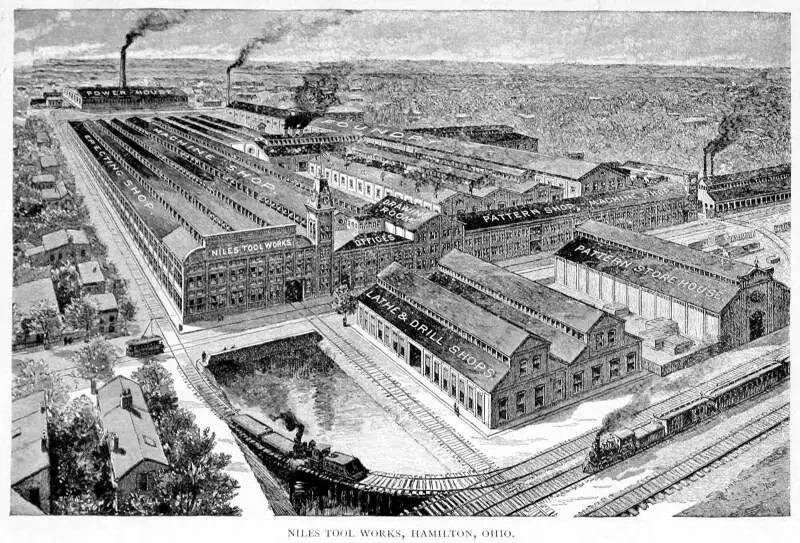
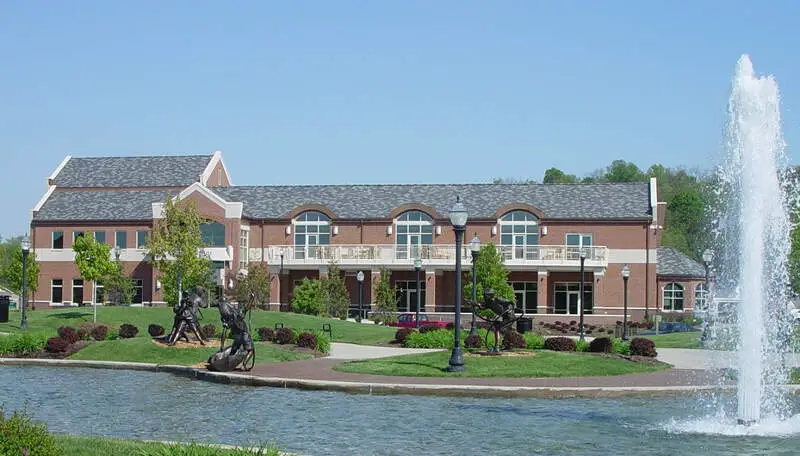
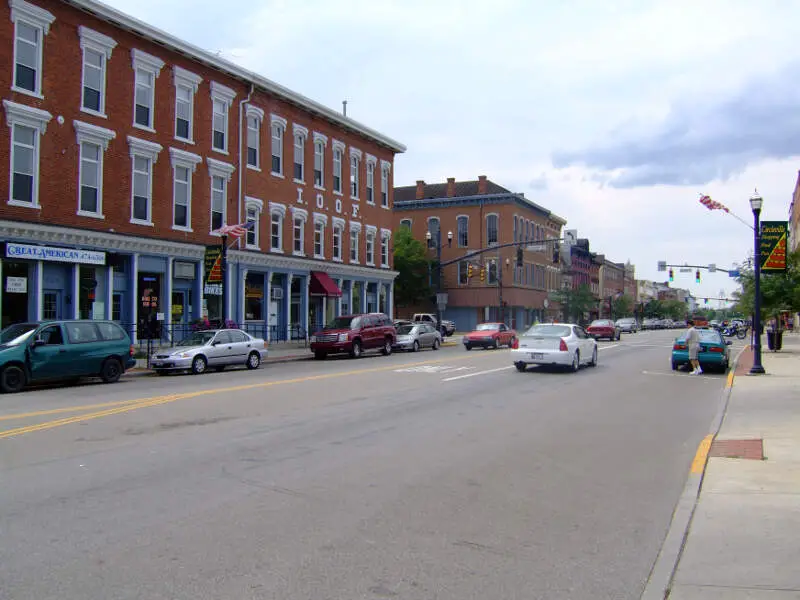
287.7 sunny days · 64.7 degree average high
Hamilton is a city in and the county seat of Butler County, Ohio, United States, in the state’s southwestern corner. The population was 62,447 at the 2010 census. The city is part of the Cincinnati metropolitan area. Hamilton has three designated National Historic Districts including Dayton Lane, German Village, and Rossville.
Data | Crime | Cost of living | Movers
The receipts
Compare the top ten
Pick a metric. The bars rescale. The red line is Ohio’s statewide median.
On the map
Where Ohio’s best weather is
Saturday Night Science
How We Determined The Cities In Ohio With The Best Weather
To rank the most fair weather cities in Ohio, we used Saturday Night Science and the National Oceanic and Atmospheric Administration (NOAA) database, to see which cities in the Buckeye State get the best weather.
We used the following criteria to find the best weather:
- Number of sunny days
- Highest average low
- Average high deviation from 70 degrees
- Least amount of rain
- Least amount of snow
We ranked each city of over 10,000 people in Ohio from best to worst on each criterion. We then averaged each ranking into a weather quality index. The city with the best index, Springdale, was anointed the city with the best weather in Ohio.
Before we get too far, here are the annual precipitation rates for major cities: Columbus (38.5 inches), Cleveland (39.6 inches), and Cincinnati (41.6 inches).
The cities with the best weather in Ohio are Springdale, Trenton, Forest Park, Middletown, Reading, Fairfield, West Carrollton, Circleville, Monroe, and Hamilton.
There’s a complete chart at the bottom.
The full plate
Detailed List Of Places With The Best Weather In Ohio
Click any column to sort. Search by city name.
| Rank | City | Population | Sunny Days | Avg. High | Precipitation (Inches) | Snow (Inches) |
|---|---|---|---|---|---|---|
| 1 | Springdale | 11,194 | 287.7 | 65.4 | 39.9 | 14.3 |
| 2 | Trenton | 12,176 | 292.0 | 64.5 | 40.1 | 11.0 |
| 3 | Forest Park | 18,667 | 287.7 | 65.0 | 40.2 | 13.8 |
| 4 | Middletown | 48,563 | 292.0 | 64.3 | 40.0 | 10.9 |
| 5 | Reading | 10,349 | 285.9 | 65.6 | 40.1 | 14.0 |
| 6 | Fairfield | 42,678 | 287.7 | 65.3 | 40.7 | 13.1 |
| 7 | West Carrollton | 13,051 | 288.3 | 62.9 | 40.1 | 14.1 |
| 8 | Circleville | 13,706 | 287.4 | 63.0 | 38.8 | 14.6 |
| 9 | Monroe | 13,666 | 292.0 | 64.0 | 40.6 | 12.3 |
| 10 | Hamilton | 62,359 | 287.7 | 64.7 | 40.7 | 12.7 |
| 11 | Norwood | 19,316 | 285.9 | 65.4 | 41.2 | 13.3 |
| 12 | Upper Arlington | 34,465 | 284.6 | 62.4 | 38.0 | 22.2 |
| 13 | Dayton | 141,368 | 288.3 | 62.6 | 40.6 | 15.1 |
| 14 | Oxford | 21,762 | 288.2 | 64.1 | 40.8 | 13.5 |
| 15 | Columbus | 824,663 | 286.4 | 62.3 | 38.5 | 22.3 |
| 16 | Lancaster | 39,312 | 287.0 | 62.5 | 38.1 | 16.5 |
| 17 | Grove City | 37,751 | 286.3 | 62.3 | 38.5 | 22.3 |
| 18 | Hilliard | 31,803 | 286.3 | 62.3 | 38.5 | 22.3 |
| 19 | Worthington | 13,867 | 286.3 | 62.3 | 38.5 | 22.3 |
| 20 | Bexley | 13,442 | 286.3 | 62.3 | 38.5 | 22.3 |
| 21 | Riverside | 25,075 | 288.3 | 62.3 | 40.4 | 15.6 |
| 22 | Centerville | 23,952 | 288.3 | 62.3 | 40.4 | 15.6 |
| 23 | Miamisburg | 20,119 | 288.3 | 62.3 | 40.4 | 15.6 |
| 24 | Whitehall | 18,521 | 286.5 | 62.4 | 39.0 | 24.7 |
| 25 | Cincinnati | 297,397 | 283.5 | 65.2 | 41.6 | 14.3 |
| 26 | Delaware | 36,794 | 288.4 | 61.2 | 37.8 | 21.9 |
| 27 | Trotwood | 24,258 | 288.3 | 62.3 | 40.5 | 17.3 |
| 28 | Dublin | 43,224 | 284.6 | 62.1 | 37.3 | 22.3 |
| 29 | Sharonville | 13,872 | 278.9 | 65.4 | 40.9 | 14.1 |
| 30 | Sandusky | 25,488 | 295.6 | 58.2 | 32.8 | 18.0 |
| 31 | Huber Heights | 38,897 | 288.3 | 62.0 | 40.6 | 17.5 |
| 32 | Beavercreek | 45,999 | 286.3 | 62.4 | 40.6 | 16.8 |
| 33 | Mason | 31,654 | 285.3 | 63.9 | 42.2 | 14.0 |
| 34 | Blue Ash | 12,102 | 278.9 | 65.4 | 41.6 | 14.2 |
| 35 | Kettering | 55,944 | 288.3 | 61.9 | 40.5 | 16.9 |
| 36 | Chillicothe | 21,765 | 286.5 | 63.2 | 40.0 | 15.1 |
| 37 | Bridgetown | 13,628 | 282.6 | 65.1 | 41.8 | 14.7 |
| 38 | Monfort Heights | 12,454 | 282.6 | 65.1 | 41.8 | 14.7 |
| 39 | Loveland | 12,451 | 282.6 | 65.1 | 41.8 | 14.7 |
| 40 | Finneytown | 12,366 | 282.6 | 65.1 | 41.8 | 14.7 |
| 41 | Mack | 11,213 | 282.6 | 65.1 | 41.8 | 14.7 |
| 42 | Dent | 11,043 | 282.6 | 65.1 | 41.8 | 14.7 |
| 43 | Northbrook | 10,545 | 282.6 | 65.1 | 41.8 | 14.7 |
| 44 | Forestville | 10,535 | 282.6 | 65.1 | 41.8 | 14.7 |
| 45 | Harrison | 10,366 | 282.6 | 65.1 | 41.8 | 14.7 |
| 46 | Montgomery | 10,363 | 282.6 | 65.1 | 41.8 | 14.7 |
| 47 | Westerville | 37,540 | 284.6 | 62.2 | 38.9 | 20.8 |
| 48 | Reynoldsburg | 36,899 | 286.5 | 62.2 | 39.1 | 23.4 |
| 49 | Lebanon | 20,450 | 285.3 | 63.6 | 41.2 | 13.6 |
| 50 | Celina | 10,373 | 289.7 | 60.7 | 38.2 | 22.3 |
| 51 | Van Wert | 10,769 | 290.4 | 60.3 | 37.3 | 18.9 |
| 52 | Gahanna | 34,095 | 284.8 | 62.1 | 39.0 | 23.7 |
| 53 | Lima | 38,232 | 286.9 | 60.2 | 37.8 | 19.7 |
| 54 | Springboro | 17,585 | 285.6 | 63.5 | 41.4 | 14.9 |
| 55 | Franklin | 11,840 | 285.6 | 63.5 | 41.4 | 14.9 |
| 56 | Troy | 25,411 | 287.3 | 61.4 | 39.9 | 15.4 |
| 57 | Portsmouth | 20,376 | 283.7 | 64.8 | 40.1 | 8.8 |
| 58 | Clayton | 13,196 | 286.9 | 62.0 | 40.4 | 18.1 |
| 59 | Powell | 12,298 | 285.4 | 61.4 | 38.4 | 21.9 |
| 60 | Englewood | 13,456 | 286.9 | 61.8 | 40.3 | 18.6 |
| 61 | Findlay | 41,278 | 288.1 | 59.8 | 35.7 | 23.6 |
| 62 | Greenville | 13,081 | 289.1 | 60.7 | 39.2 | 18.9 |
| 63 | Washington Court House | 14,057 | 287.1 | 61.9 | 40.0 | 19.9 |
| 64 | White Oak | 18,664 | 280.0 | 64.9 | 42.5 | 16.6 |
| 65 | Bowling Green | 31,506 | 291.6 | 59.7 | 34.1 | 27.8 |
| 66 | Oregon | 20,207 | 292.4 | 58.9 | 34.0 | 29.7 |
| 67 | Springfield | 60,007 | 290.3 | 61.7 | 40.9 | 19.3 |
| 68 | Pickerington | 19,157 | 285.1 | 62.1 | 39.2 | 18.3 |
| 69 | Vandalia | 15,168 | 286.9 | 61.6 | 40.4 | 20.4 |
| 70 | Marysville | 22,732 | 284.7 | 61.6 | 38.3 | 22.6 |
| 71 | Fairborn | 33,251 | 285.6 | 62.1 | 40.7 | 18.4 |
| 72 | Ironton | 11,172 | 278.7 | 65.9 | 42.7 | 11.7 |
| 73 | Toledo | 282,275 | 292.4 | 59.2 | 34.0 | 31.7 |
| 74 | Cuyahoga Falls | 49,287 | 288.2 | 59.4 | 37.5 | 42.8 |
| 75 | Maumee | 14,083 | 292.4 | 59.5 | 34.3 | 32.7 |
| 76 | Barberton | 26,340 | 288.2 | 59.4 | 37.7 | 39.0 |
| 77 | Perrysburg | 21,243 | 295.2 | 59.4 | 34.3 | 30.6 |
| 78 | Fostoria | 13,187 | 287.5 | 59.7 | 36.2 | 25.8 |
| 79 | Sylvania | 18,943 | 292.6 | 59.2 | 34.2 | 32.3 |
| 80 | Defiance | 16,571 | 287.9 | 59.9 | 35.3 | 25.7 |
| 81 | Akron | 198,329 | 288.2 | 59.3 | 37.0 | 42.7 |
| 82 | Zanesville | 25,470 | 285.7 | 62.6 | 39.7 | 19.8 |
| 83 | East Liverpool | 10,999 | 282.8 | 60.7 | 38.7 | 17.5 |
| 84 | Xenia | 26,002 | 282.3 | 62.3 | 40.7 | 19.5 |
| 85 | Pataskala | 15,120 | 286.5 | 61.2 | 39.8 | 21.4 |
| 86 | Tiffin | 17,793 | 287.5 | 59.9 | 37.4 | 29.6 |
| 87 | Athens | 24,220 | 285.0 | 63.8 | 40.2 | 17.1 |
| 88 | Vermilion | 10,462 | 283.7 | 58.3 | 36.4 | 40.2 |
| 89 | Piqua | 20,681 | 284.4 | 61.7 | 40.8 | 19.5 |
| 90 | Struthers | 10,515 | 292.0 | 60.6 | 38.6 | 43.1 |
| 91 | Green | 25,868 | 287.3 | 59.3 | 37.6 | 45.5 |
| 92 | Norton | 12,054 | 287.3 | 59.3 | 37.6 | 45.5 |
| 93 | Amherst | 12,114 | 281.5 | 59.5 | 37.5 | 47.9 |
| 94 | Fremont | 16,484 | 284.0 | 59.7 | 35.5 | 25.6 |
| 95 | Sidney | 20,981 | 286.9 | 60.6 | 40.4 | 17.5 |
| 96 | Tallmadge | 17,459 | 288.2 | 59.0 | 37.4 | 43.6 |
| 97 | Wilmington | 12,428 | 283.3 | 61.7 | 41.1 | 20.0 |
| 98 | Urbana | 11,618 | 285.3 | 61.1 | 39.9 | 20.2 |
| 99 | Cambridge | 10,511 | 282.3 | 62.1 | 39.3 | 23.1 |
| 100 | Marietta | 13,996 | 281.0 | 64.6 | 42.8 | 19.7 |
Source: NOAA climate data. 184 Ohio cities with more than 10,000 residents.
Summary
Summary: The Cities With The Best Weather In Ohio For 2026
If you’re looking for the Ohio cities with the most sunny days, the least rain and snow, and highs closest to a perfect 70 degrees, this is an accurate list.
The cities with the best weather in Ohio are Springdale, Trenton, Forest Park, Middletown, Reading, Fairfield, West Carrollton, Circleville, Monroe, and Hamilton.