Racial diversity in Florida is a mixed bag.
There are parts of Florida where there’s a high level of diversity. But where will you find the most diverse places in Florida?
To answer that question, we went to the US Census data. Using Saturday Night Science, we measured the Gini coefficient for all 222 cities in Florida to rank them from most to least diverse.
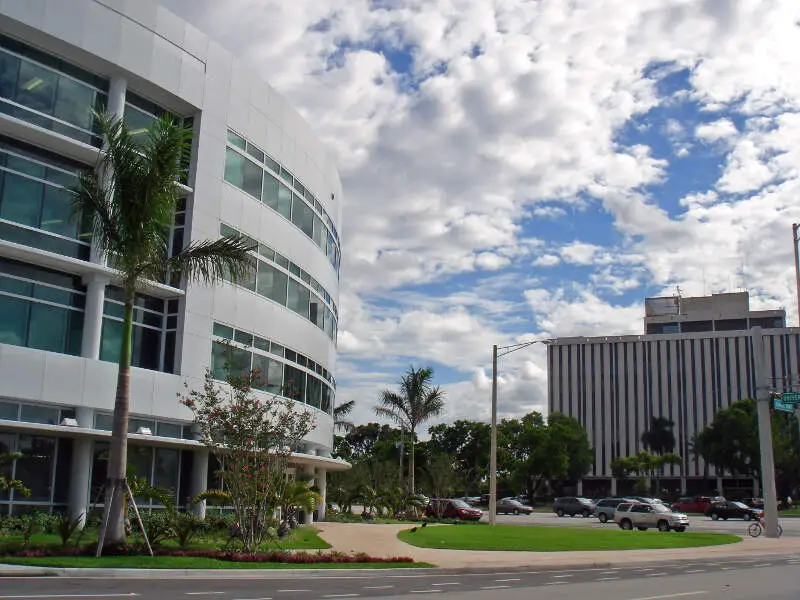
#1 most diverse in Florida
Coral Springs, officially the City of Coral Springs, is a city in Broward County, Florida, United States, approximately 20 miles northwest of Fort Lauderdale. As of the 2010 United States Census, the city had a population of 121,096. It is a principal city of the Miami metropolitan area, which was home to an estimated 6,012,331 people at the 2015 census.
Data | Crime | Cost of living | Movers
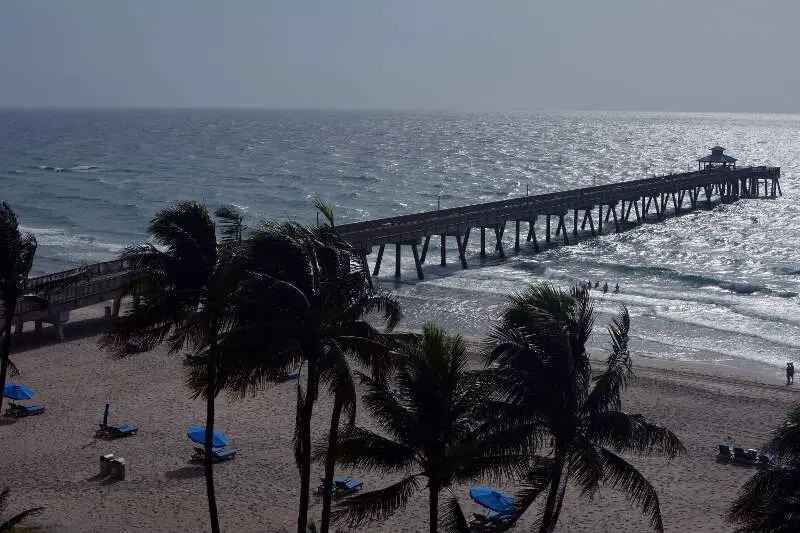
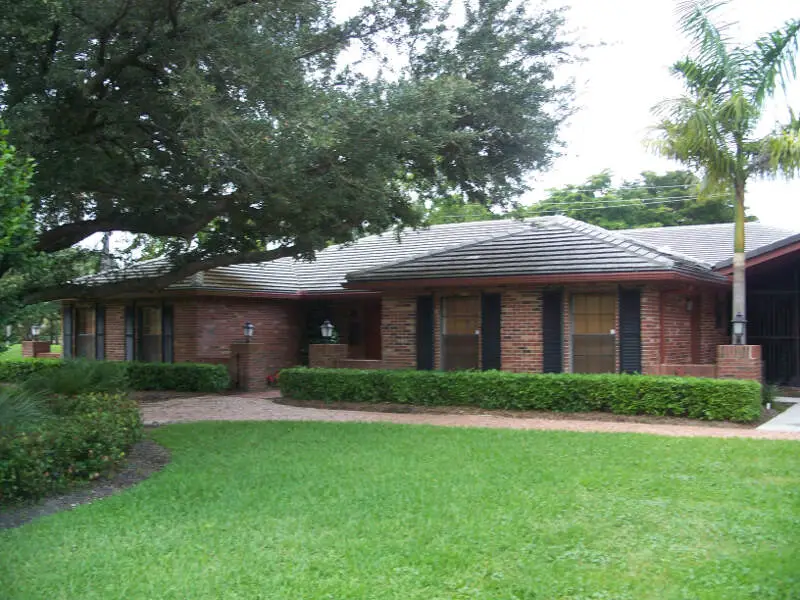
#2 most diverse in Florida
Deerfield Beach is a city in Broward County, Florida, United States. It is located just south of the Palm Beach County line. The city is named for the numerous deer that once roamed the area. As of the 2010 United States Census, the population was 75,018. It is a principal city of the Miami metropolitan area, which was home to an estimated 6,012,331 people at the 2015 census.
Data | Crime | Cost of living | Movers
#3 most diverse in Florida
Data | Crime | Cost of living | Movers
#4 most diverse in Florida
Ocoee is a city in Orange County, Florida, United States. As of the 2010 census, the city had a population of 35,579. It is part of the Orlando-Kissimmee-Sanford, Florida Metropolitan Statistical Area.
Data | Crime | Cost of living | Movers
#5 most diverse in Florida
Royal Palm Beach is a village in southeast Florida, located within Palm Beach County. The population was measured at 21,523 in the 2000 census. As of April 2008, the recorded population was 31,864. The village is located approximately fifteen miles inland from the Atlantic Ocean.
Data | Crime | Cost of living | Movers
#6 most diverse in Florida
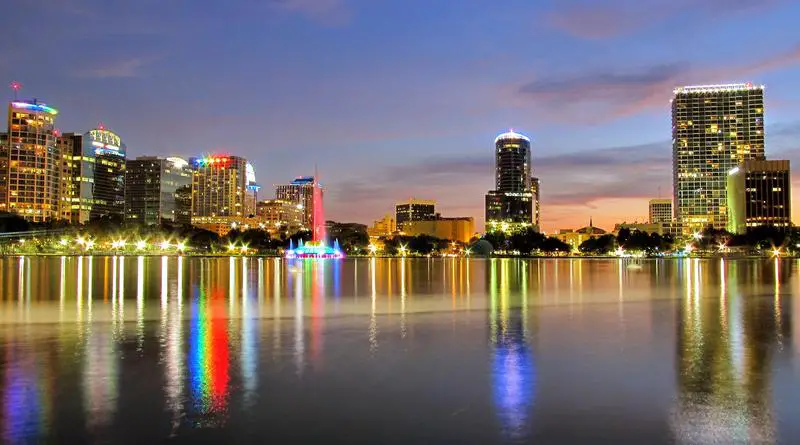
Orlando is a city in the U.S. state of Florida and the county seat of Orange County. Located in Central Florida, it is the center of the Orlando metropolitan area, which had a population of 2,387,138, according to U.S. Census Bureau figures released in March 2016, making it the 24th-largest metropolitan area in the United States, the sixth-largest metropolitan area in the Southern United States, and the third-largest metropolitan area in Florida. As of 2015, Orlando had an estimated city-proper population of 270,934, making it the 73rd-largest city in the United States, the fourth-largest city in Florida, and the state’s largest inland city.
Data | Crime | Cost of living | Movers
#7 most diverse in Florida
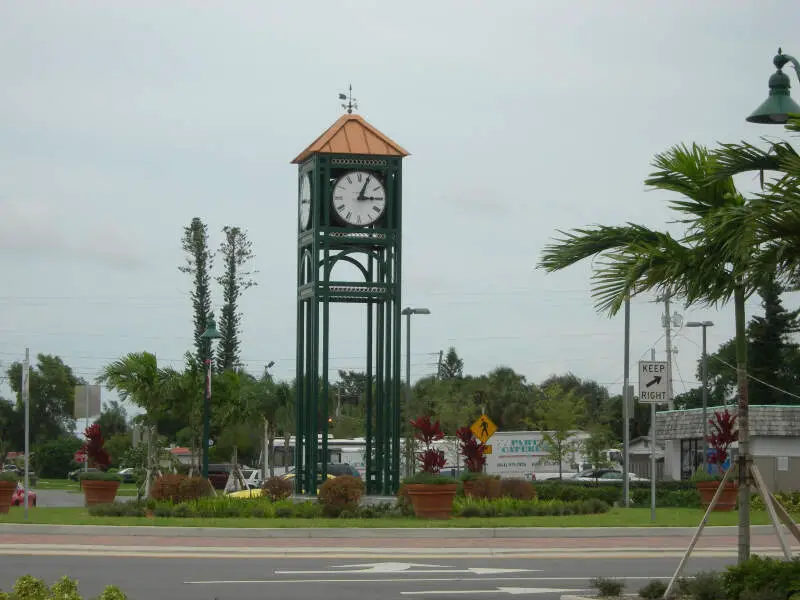
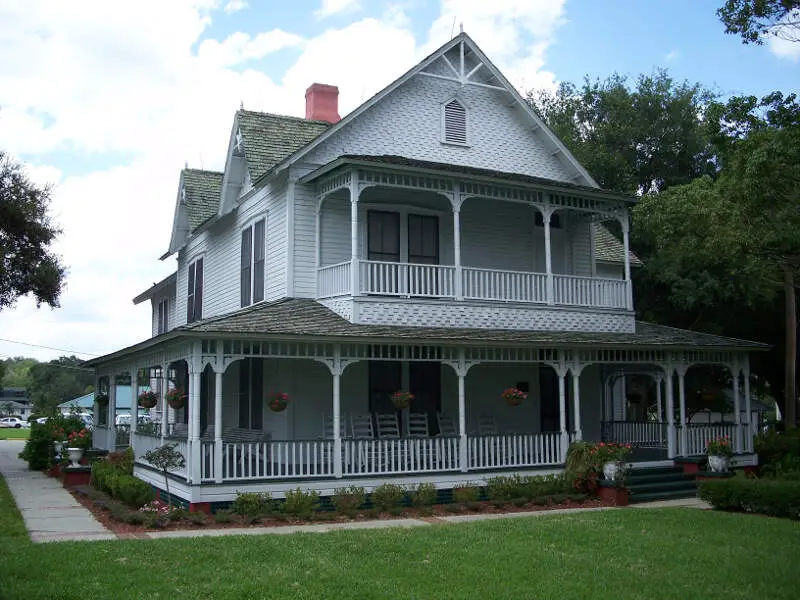
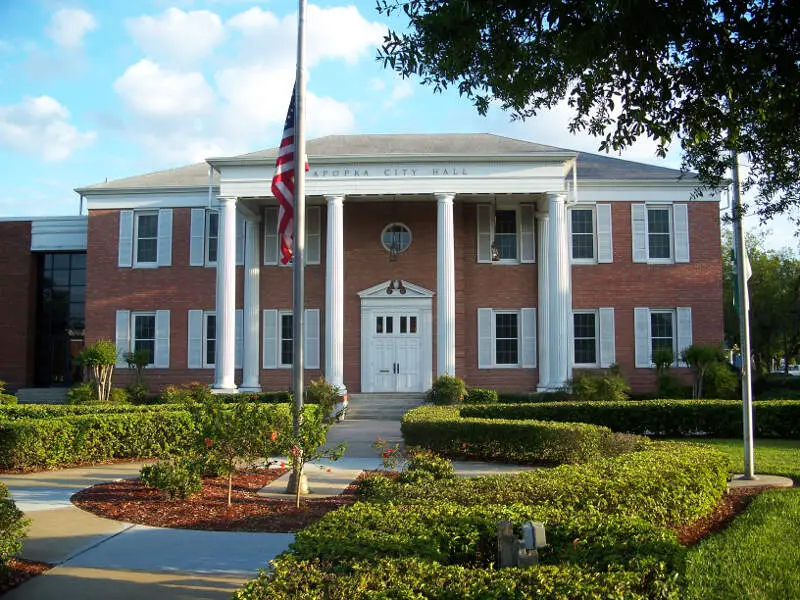
Apopka is a city in Orange County, Florida. The city’s population was 41,542 at the 2010 census, up from 26,969 at the 2000 U.S. Census. It is part of the Orlando-Kissimmee-Sanford Metropolitan Statistical Area. Apopka comes from Seminole word “Ahapopka” for “Potato eating place”. Apopka is often referred to as the “Indoor Foliage Capital of the World”.
Data | Crime | Cost of living | Movers
#8 most diverse in Florida
Data | Crime | Cost of living | Movers
#9 most diverse in Florida
Data | Crime | Cost of living | Movers
#10 most diverse in Florida
Oakland Park, officially the City of Oakland Park, is a city in Broward County, Florida, United States. As of the 2010 United States Census, the city’s population was 41,363, mainly due to annexation of North Andrews Gardens and Twin Lakes South. It is part of the Miami-Fort Lauderdale-Pompano Beach Metropolitan Statistical Area, which was home to 5,564,635 people at the 2010 census.
Data | Crime | Cost of living | Movers
The receipts
Compare the top ten
Pick a metric. The bars rescale. The red line is Florida’s statewide median.
On the map
Where diversity lives in Florida
Saturday Night Science
Methodology: How we determined the most diverse cities in Florida for 2026
We still believe in the accuracy of data — especially from the Census — and Saturday Night Science. So that’s where we went to get the race breakdown across Florida.
That leads us to the Census’s most recently available data, the 2020-2024 American Community Survey data from the US Census.
Specifically, we looked at table B03002: HISPANIC OR LATINO ORIGIN BY RACE. Here are the category names as defined by the Census:
- White alone*
- Black or African American alone*
- American Indian and Alaska Native alone*
- Asian alone*
- Native Hawaiian and Other Pacific Islander alone*
- Some other race alone*
- Two or more races*
- Hispanic or Latino
We limited our analysis to non-CDPs with a population greater than 5,000 people. That left us with 222 cities.
We then calculated the HHI for each city by finding the racial breakdown of a city in percent terms, squaring them, and then adding the squares together. This left us with scores ranging from 2,691 (Coral Springs) to 9,308 (Hialeah Gardens).
Finally, we ranked each city based on the HHI, with a lower score being more diverse than a high score. Coral Springs took the distinction of being the most diverse, while Hialeah Gardens was the least diverse city.
We updated this article for 2026. This report is our eleventh time ranking the most diverse places in Florida.
The full plate
Race By City In Florida For 2026
Click any column to sort. Search by city name.
| Rank | City | Population | HHI | % White | % Black | % Hispanic | % Asian |
|---|---|---|---|---|---|---|---|
| 1 | Coral Springs | 136,103 | 2,691 | 33.0% | 24.0% | 31.2% | 4.9% |
| 2 | Deerfield Beach | 88,093 | 2,697 | 36.7% | 26.5% | 23.4% | 1.6% |
| 3 | Margate | 59,198 | 2,710 | 29.2% | 33.2% | 26.7% | 3.2% |
| 4 | Ocoee | 49,033 | 2,712 | 38.0% | 20.5% | 28.0% | 5.7% |
| 5 | Royal Palm Beach | 40,344 | 2,771 | 35.1% | 23.4% | 30.7% | 5.7% |
| 6 | Orlando | 319,758 | 2,772 | 31.2% | 22.2% | 35.4% | 4.8% |
| 7 | Apopka | 58,232 | 2,812 | 35.2% | 25.5% | 29.8% | 3.5% |
| 8 | Plantation | 96,293 | 2,839 | 37.1% | 22.0% | 30.6% | 5.2% |
| 9 | Sunrise | 97,918 | 2,857 | 21.6% | 32.5% | 36.0% | 4.7% |
| 10 | Oakland Park | 44,682 | 2,901 | 32.6% | 26.8% | 33.1% | 3.0% |
| 11 | Pompano Beach | 114,147 | 2,905 | 37.6% | 28.9% | 24.9% | 1.9% |
| 12 | Sanford | 63,730 | 2,909 | 38.5% | 24.1% | 28.5% | 4.4% |
| 13 | West Palm Beach | 122,290 | 2,976 | 36.2% | 32.2% | 24.6% | 2.7% |
| 14 | Avon Park | 10,057 | 2,992 | 35.7% | 24.0% | 33.5% | 0.5% |
| 15 | Live Oak | 6,985 | 2,999 | 40.7% | 30.5% | 13.7% | 0.1% |
| 16 | Tamarac | 73,019 | 3,019 | 26.2% | 36.4% | 31.5% | 2.8% |
| 17 | Dania Beach | 32,180 | 3,044 | 38.0% | 19.6% | 34.5% | 2.4% |
| 18 | Coconut Creek | 58,330 | 3,047 | 44.1% | 15.8% | 28.2% | 3.2% |
| 19 | Miami Shores | 11,752 | 3,052 | 37.0% | 16.2% | 37.2% | 2.8% |
| 20 | Altamonte Springs | 46,116 | 3,055 | 41.9% | 18.7% | 30.3% | 2.6% |
| 21 | Tampa | 401,618 | 3,073 | 44.3% | 19.5% | 26.2% | 4.7% |
| 22 | Mascotte | 7,949 | 3,091 | 33.4% | 22.8% | 37.8% | 1.5% |
| 23 | Clermont | 46,853 | 3,099 | 47.2% | 13.3% | 24.4% | 5.4% |
| 24 | Winter Haven | 55,200 | 3,112 | 41.5% | 27.8% | 24.4% | 1.6% |
| 25 | Temple Terrace | 27,275 | 3,134 | 47.1% | 18.4% | 22.7% | 6.5% |
| 26 | Fort Myers | 95,051 | 3,169 | 45.2% | 21.9% | 24.8% | 2.0% |
| 27 | Winter Garden | 47,872 | 3,198 | 48.7% | 15.1% | 22.7% | 6.3% |
| 28 | Fort Lauderdale | 185,604 | 3,231 | 44.4% | 28.7% | 20.3% | 1.4% |
| 29 | Fort Pierce | 49,082 | 3,249 | 30.3% | 43.5% | 20.6% | 2.1% |
| 30 | Jacksonville | 977,670 | 3,262 | 46.8% | 29.3% | 12.6% | 5.0% |
| 31 | Greenacres | 44,373 | 3,264 | 21.7% | 27.8% | 44.8% | 2.7% |
| 32 | Groveland | 22,012 | 3,283 | 45.6% | 16.0% | 30.5% | 3.2% |
| 33 | Boynton Beach | 81,435 | 3,288 | 43.2% | 33.5% | 16.8% | 2.8% |
| 34 | Lantana | 12,256 | 3,312 | 39.7% | 36.7% | 19.5% | 0.4% |
| 35 | Lake Park | 9,081 | 3,338 | 20.9% | 47.4% | 25.3% | 1.8% |
| 36 | Davie | 108,346 | 3,340 | 37.7% | 8.2% | 42.3% | 6.2% |
| 37 | Hollywood | 155,082 | 3,345 | 35.0% | 15.3% | 43.2% | 2.4% |
| 38 | Pembroke Pines | 173,194 | 3,384 | 21.1% | 20.2% | 50.0% | 4.8% |
| 38 | Leesburg | 30,807 | 3,385 | 47.5% | 25.8% | 21.2% | 1.0% |
| 40 | Hallandale Beach | 41,854 | 3,388 | 38.5% | 15.9% | 40.5% | 0.9% |
| 41 | North Miami Beach | 43,898 | 3,390 | 14.6% | 39.6% | 40.0% | 2.8% |
| 42 | Lake Wales | 16,785 | 3,392 | 44.3% | 21.8% | 30.8% | 1.1% |
| 43 | Palm Bay | 130,132 | 3,397 | 50.8% | 18.5% | 20.6% | 2.2% |
| 44 | Sebring | 11,382 | 3,439 | 48.2% | 15.8% | 29.1% | 3.3% |
| 45 | Arcadia | 7,707 | 3,446 | 35.9% | 21.6% | 41.1% | 0.0% |
| 46 | Miramar | 138,600 | 3,476 | 9.4% | 42.5% | 39.3% | 4.7% |
| 47 | Cooper City | 34,660 | 3,489 | 49.4% | 5.9% | 30.7% | 5.9% |
| 48 | Port St. Lucie | 232,491 | 3,497 | 50.4% | 19.0% | 24.0% | 2.1% |
| 49 | Parkland | 37,178 | 3,531 | 54.7% | 13.0% | 16.5% | 7.2% |
| 50 | Cocoa | 19,554 | 3,539 | 50.8% | 22.4% | 20.9% | 1.3% |
| 51 | Haines City | 34,234 | 3,553 | 22.3% | 23.8% | 49.8% | 1.7% |
| 52 | Tallahassee | 201,875 | 3,563 | 47.8% | 34.1% | 8.9% | 4.3% |
| 53 | Wellington | 62,146 | 3,567 | 50.8% | 12.1% | 28.5% | 4.4% |
| 54 | Pembroke Park | 6,360 | 3,575 | 18.0% | 44.4% | 35.7% | 0.7% |
| 54 | Plant City | 40,887 | 3,574 | 46.9% | 14.7% | 33.9% | 1.6% |
| 56 | Gainesville | 145,702 | 3,604 | 54.2% | 20.4% | 13.6% | 6.3% |
| 57 | Lake Alfred | 7,277 | 3,633 | 50.4% | 11.7% | 30.3% | 5.2% |
| 58 | Callaway | 13,496 | 3,649 | 54.9% | 19.6% | 13.7% | 4.3% |
| 59 | Casselberry | 30,135 | 3,652 | 52.4% | 8.6% | 28.0% | 4.8% |
| 60 | Deltona | 97,334 | 3,658 | 43.0% | 11.3% | 40.9% | 1.6% |
| 61 | Southwest Ranches | 7,656 | 3,668 | 44.7% | 4.4% | 40.0% | 5.0% |
| 62 | South Miami | 12,277 | 3,683 | 24.5% | 11.7% | 53.8% | 2.9% |
| 63 | Newberry | 7,865 | 3,691 | 54.6% | 18.3% | 18.4% | 3.3% |
| 64 | Davenport | 13,238 | 3,703 | 21.0% | 18.7% | 53.8% | 1.5% |
| 65 | Minneola | 16,598 | 3,729 | 51.6% | 8.2% | 31.1% | 2.1% |
| 66 | Delray Beach | 67,979 | 3,740 | 52.4% | 29.0% | 11.2% | 2.6% |
| 67 | Palatka | 10,650 | 3,755 | 38.6% | 46.5% | 9.1% | 0.3% |
| 68 | Lakeland | 119,961 | 3,766 | 54.9% | 17.9% | 20.5% | 2.5% |
| 69 | Daytona Beach | 78,992 | 3,777 | 52.6% | 29.8% | 9.9% | 2.9% |
| 70 | Ocala | 66,584 | 3,850 | 56.5% | 17.6% | 17.8% | 4.0% |
| 71 | Bartow | 20,438 | 3,870 | 55.8% | 22.0% | 15.9% | 2.7% |
| 72 | Fort Meade | 5,225 | 3,888 | 51.4% | 13.2% | 32.6% | 0.0% |
| 73 | Okeechobee | 5,479 | 3,895 | 51.4% | 8.6% | 34.0% | 0.9% |
| 74 | North Lauderdale | 45,234 | 3,900 | 7.9% | 55.5% | 26.8% | 3.6% |
| 75 | Marianna | 7,150 | 3,938 | 43.8% | 44.2% | 6.9% | 0.6% |
| 76 | Crestview | 28,773 | 3,940 | 57.8% | 20.3% | 10.8% | 2.7% |
| 77 | North Miami | 60,344 | 3,974 | 9.2% | 52.3% | 33.9% | 1.0% |
| 78 | Palmetto Bay | 24,639 | 3,977 | 36.3% | 4.3% | 51.1% | 4.1% |
| 78 | Oviedo | 40,599 | 3,977 | 57.5% | 8.2% | 23.4% | 6.4% |
| 80 | Pahokee | 5,609 | 4,024 | 10.2% | 46.9% | 41.4% | 0.0% |
| 81 | Dundee | 5,863 | 4,031 | 28.0% | 10.1% | 55.9% | 3.1% |
| 82 | Weston | 68,837 | 4,047 | 26.9% | 3.1% | 56.8% | 8.4% |
| 83 | Pinecrest | 18,462 | 4,053 | 40.5% | 1.8% | 48.7% | 3.8% |
| 84 | St. Cloud | 65,130 | 4,062 | 36.3% | 4.8% | 52.0% | 1.5% |
| 85 | Dade City | 8,152 | 4,074 | 58.0% | 16.8% | 20.1% | 0.9% |
| 86 | Clewiston | 7,348 | 4,083 | 37.5% | 9.5% | 50.9% | 1.6% |
| 87 | Miami Beach | 82,031 | 4,086 | 36.0% | 3.2% | 52.5% | 2.7% |
| 88 | Key West | 25,720 | 4,088 | 58.5% | 12.2% | 22.5% | 2.3% |
| 89 | Maitland | 19,469 | 4,107 | 58.8% | 10.7% | 22.6% | 3.3% |
| 90 | Longwood | 16,337 | 4,133 | 56.8% | 5.0% | 29.0% | 2.0% |
| 91 | West Park | 15,249 | 4,147 | 6.4% | 47.0% | 43.5% | 0.3% |
| 92 | Aventura | 39,885 | 4,155 | 45.2% | 2.3% | 45.6% | 1.5% |
| 93 | Springfield | 8,230 | 4,159 | 60.1% | 20.3% | 8.8% | 3.4% |
| 94 | DeFuniak Springs | 6,532 | 4,182 | 58.8% | 24.4% | 9.7% | 0.0% |
| 95 | Alachua | 10,743 | 4,191 | 58.6% | 24.1% | 12.9% | 2.0% |
| 96 | Belle Glade | 16,972 | 4,202 | 10.2% | 55.9% | 31.2% | 0.4% |
| 97 | Bradenton | 57,014 | 4,232 | 60.2% | 12.2% | 20.9% | 2.3% |
| 98 | Holly Hill | 13,084 | 4,242 | 61.6% | 15.8% | 11.8% | 3.0% |
| 99 | Lake City | 12,515 | 4,265 | 56.3% | 32.5% | 4.7% | 1.3% |
| 100 | North Bay Village | 8,118 | 4,267 | 24.5% | 4.5% | 60.0% | 4.7% |
Source: U.S. Census ACS 2020-2024. 222 cities with more than 5,000 residents.
Summary
Summary: Diversity Across Florida
If you’re looking for a scientific breakdown of diversity across Florida, this is an accurate list.
The most diverse cities in Florida are Coral Springs, Deerfield Beach, Margate, Ocoee, Royal Palm Beach, Orlando, Apopka, Plantation, Sunrise, and Oakland Park.