Racial diversity in Alabama is a mixed bag.
There are parts of Alabama where there’s a high level of diversity. But where will you find the most diverse places in Alabama?
To answer that question, we went to the US Census data. Using Saturday Night Science, we measured the Gini coefficient for all 105 cities in Alabama to rank them from most to least diverse.
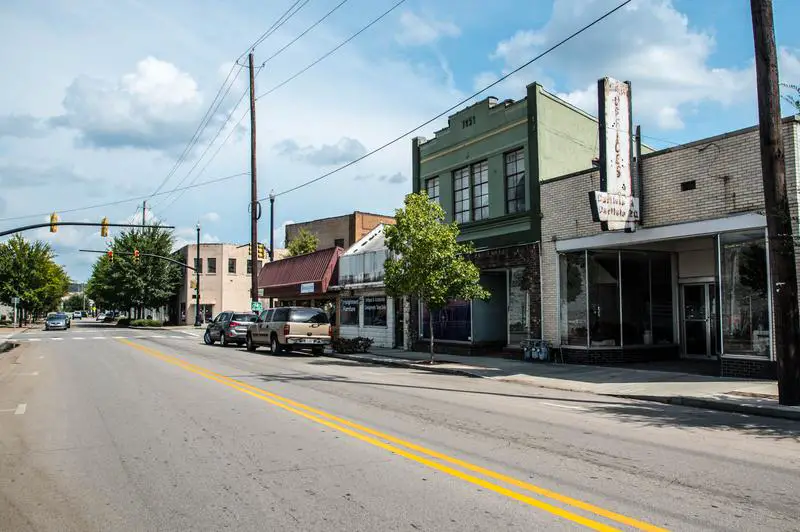
#1 most diverse in Alabama
Tarrant is a city in Jefferson County, Alabama, United States, southeast of Fultondale. At the 2010 census the population was 6,397. It is home to the ABC Coke plant owned by the Drummond Company, “the largest single producer of foundry coke in the U.S.”.
Data | Crime | Cost of living | Movers
#2 most diverse in Alabama
Data | Crime | Cost of living | Movers
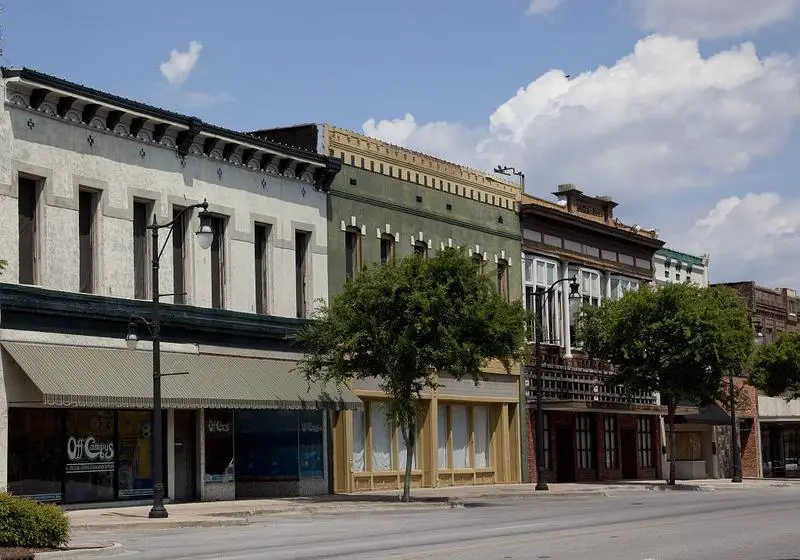
#3 most diverse in Alabama
Data | Crime | Cost of living | Movers
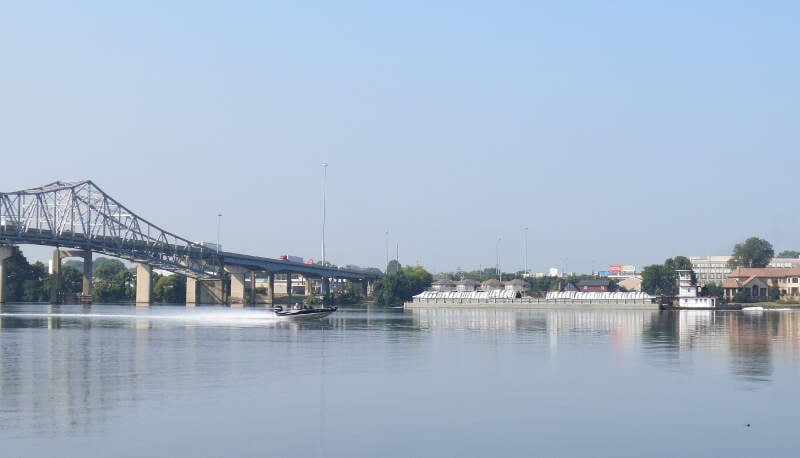
#4 most diverse in Alabama
Gadsden is a city in and the county seat of Etowah County in the U.S. state of Alabama. It is located on the Coosa River about 56 miles northeast of Birmingham and 90 miles southwest of Chattanooga, Tennessee. It is the primary city of the Gadsden Metropolitan Statistical Area, which has a population of 103,931. As of the 2010 census, the population of the city was 36,856, with an estimated population of 35,837 in 2016. Gadsden and Rome, Georgia, are the largest cities in the triangular area defined by the Interstate highways between Atlanta, Birmingham, and Chattanooga.
Data | Crime | Cost of living | Movers
#5 most diverse in Alabama
Decatur is a city in Morgan and Limestone counties in the State of Alabama. The city, affectionately known as “The River City”, is located in Northern Alabama on the banks of Wheeler Lake, along the Tennessee River. It is the largest city and county seat of Morgan County. The population in 2010 census was 55,683.
Data | Crime | Cost of living | Movers
#6 most diverse in Alabama
Phenix City is a city in Lee and Russell counties in the State of Alabama, and the county seat of Russell County. As of the 2010 census, the population of the city was 32,822.
Data | Crime | Cost of living | Movers
#7 most diverse in Alabama
Fultondale is a city in Jefferson County, Alabama, United States and a northern suburb of Birmingham. As of the 2010 census, the population of the city is 8,380.
Data | Crime | Cost of living | Movers
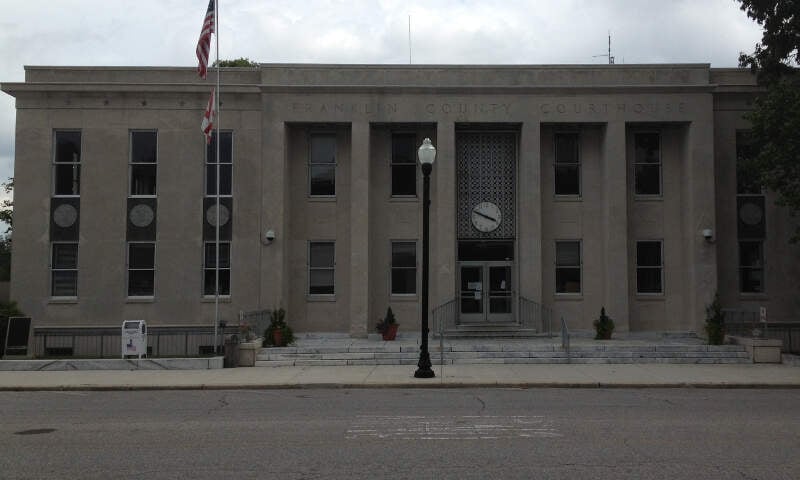
#8 most diverse in Alabama
Russellville is a city in Franklin County in the U.S. state of Alabama. At the 2010 census, the population of the city was 9,830, up from 8,971 at the 2000 census. The city is the county seat of Franklin County.
Data | Crime | Cost of living | Movers
#9 most diverse in Alabama
Eufaula is the largest city in Barbour County, Alabama, United States. As of the 2010 census the city’s population was 13,137.
Data | Crime | Cost of living | Movers
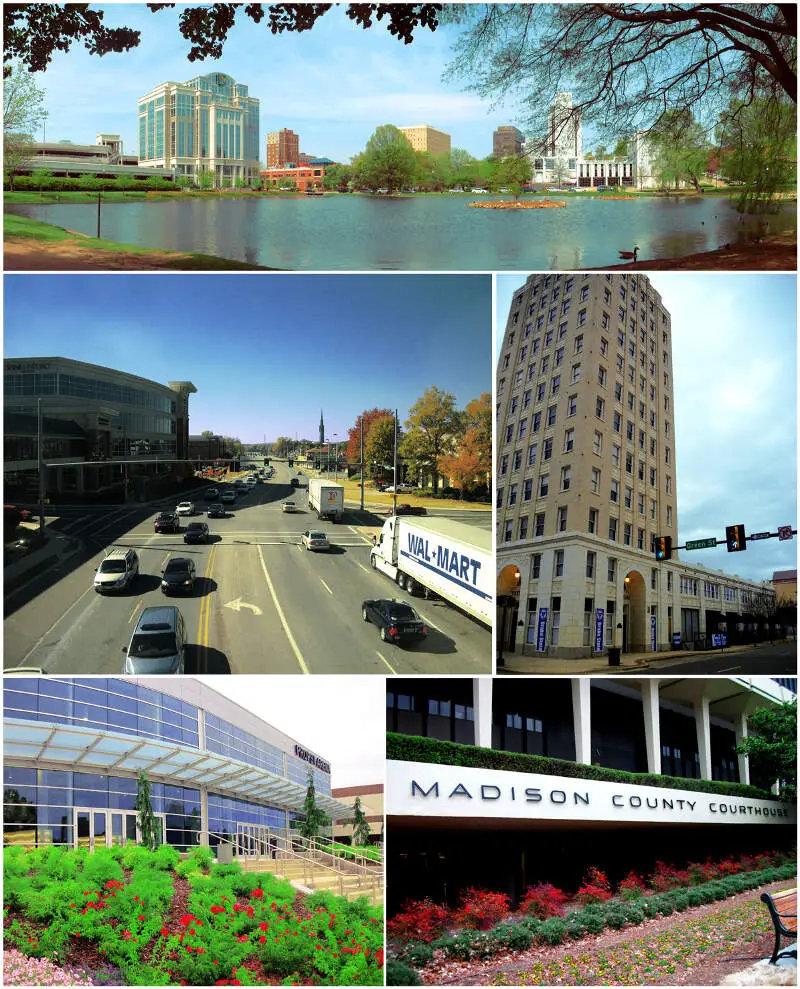
#10 most diverse in Alabama
Huntsville is a city located primarily in Madison County in the Appalachian region of northern Alabama. Huntsville is the county seat of Madison County. The city extends west into neighboring Limestone County. Huntsville’s population was 180,105 as of the 2010 census. Huntsville is the third-largest city in Alabama and the largest city in the five-county Huntsville-Decatur-Albertville, AL Combined Statistical Area, which at the 2013 census estimate had a total population of 683,871. The Huntsville Metropolitan Area’s population was 417,593 in 2010 to become the 2nd largest in Alabama. Huntsville metro’s population reached 441,000 by 2014.
Data | Crime | Cost of living | Movers
The receipts
Compare the top ten
Pick a metric. The bars rescale. The red line is Alabama’s statewide median.
On the map
Where diversity lives in Alabama
Saturday Night Science
Methodology: How we determined the most diverse cities in Alabama for 2026
We still believe in the accuracy of data — especially from the Census — and Saturday Night Science. So that’s where we went to get the race breakdown across Alabama.
That leads us to the Census’s most recently available data, the 2020-2024 American Community Survey data from the US Census.
Specifically, we looked at table B03002: HISPANIC OR LATINO ORIGIN BY RACE. Here are the category names as defined by the Census:
- White alone*
- Black or African American alone*
- American Indian and Alaska Native alone*
- Asian alone*
- Native Hawaiian and Other Pacific Islander alone*
- Some other race alone*
- Two or more races*
- Hispanic or Latino
We limited our analysis to non-CDPs with a population greater than 5,000 people. That left us with 105 cities.
We then calculated the HHI for each city by finding the racial breakdown of a city in percent terms, squaring them, and then adding the squares together. This left us with scores ranging from 3,502 (Tarrant) to 9,047 (Mountain Brook).
Finally, we ranked each city based on the HHI, with a lower score being more diverse than a high score. Tarrant took the distinction of being the most diverse, while Mountain Brook was the least diverse city.
We updated this article for 2026. This report is our eleventh time ranking the most diverse places in Alabama.
The full plate
Race By City In Alabama For 2026
Click any column to sort. Search by city name.
| Rank | City | Population | HHI | % White | % Black | % Hispanic | % Asian |
|---|---|---|---|---|---|---|---|
| 1 | Tarrant | 5,925 | 3,502 | 31.9% | 45.0% | 21.4% | 0.0% |
| 2 | Pinson | 7,832 | 3,578 | 33.4% | 48.2% | 10.4% | 2.2% |
| 3 | Hueytown | 16,414 | 3,720 | 42.9% | 42.0% | 9.6% | 0.6% |
| 4 | Gadsden | 33,374 | 3,841 | 49.3% | 36.0% | 10.5% | 0.4% |
| 5 | Decatur | 57,361 | 3,908 | 55.6% | 23.0% | 16.5% | 0.8% |
| 6 | Phenix City | 38,499 | 3,945 | 40.3% | 47.6% | 5.7% | 1.2% |
| 7 | Fultondale | 9,384 | 3,983 | 51.5% | 34.7% | 11.0% | 0.6% |
| 8 | Russellville | 10,799 | 3,998 | 44.8% | 9.8% | 43.5% | 0.0% |
| 9 | Eufaula | 12,584 | 4,043 | 45.0% | 44.4% | 7.0% | 0.4% |
| 10 | Huntsville | 222,791 | 4,046 | 55.9% | 28.8% | 8.0% | 2.1% |
| 11 | Tuscaloosa | 111,038 | 4,059 | 48.8% | 40.4% | 5.7% | 2.5% |
| 12 | Clay | 10,273 | 4,083 | 47.0% | 43.0% | 3.4% | 2.5% |
| 13 | Opelika | 32,820 | 4,109 | 51.3% | 37.7% | 7.2% | 1.8% |
| 14 | Troy | 17,716 | 4,161 | 49.1% | 41.5% | 2.4% | 3.1% |
| 15 | Alexander City | 14,606 | 4,194 | 57.1% | 29.4% | 6.4% | 1.4% |
| 16 | Chickasaw | 6,332 | 4,199 | 40.0% | 50.6% | 3.0% | 1.5% |
| 17 | Valley | 10,277 | 4,217 | 53.0% | 37.0% | 5.6% | 0.4% |
| 18 | Enterprise | 29,505 | 4,222 | 60.4% | 20.0% | 11.9% | 1.5% |
| 19 | Talladega | 14,760 | 4,229 | 41.1% | 50.0% | 2.7% | 1.0% |
| 20 | Mobile | 203,416 | 4,236 | 41.1% | 50.2% | 3.7% | 2.2% |
| 21 | Bay Minette | 8,295 | 4,252 | 51.3% | 39.8% | 3.8% | 1.2% |
| 22 | Dothan | 71,514 | 4,271 | 54.4% | 35.7% | 4.8% | 1.5% |
| 23 | Anniston | 21,271 | 4,291 | 41.5% | 50.5% | 4.2% | 0.4% |
| 24 | Atmore | 8,334 | 4,301 | 41.0% | 51.0% | 3.1% | 0.2% |
| 25 | Ozark | 14,327 | 4,309 | 56.7% | 32.3% | 5.5% | 0.7% |
| 26 | Irondale | 13,464 | 4,350 | 58.7% | 28.6% | 9.0% | 0.7% |
| 27 | Calera | 17,714 | 4,365 | 57.8% | 30.7% | 9.2% | 0.6% |
| 28 | Demopolis | 6,908 | 4,455 | 50.7% | 43.2% | 2.5% | 0.6% |
| 29 | Montevallo | 7,556 | 4,564 | 61.5% | 27.1% | 6.4% | 2.0% |
| 30 | Smiths Station | 5,496 | 4,590 | 60.6% | 29.8% | 4.1% | 0.9% |
| 31 | Jacksonville | 14,437 | 4,653 | 63.4% | 24.1% | 5.6% | 1.4% |
| 32 | Montgomery | 197,494 | 4,661 | 25.8% | 62.8% | 4.9% | 3.4% |
| 33 | Madison | 60,106 | 4,674 | 66.1% | 12.6% | 8.6% | 7.1% |
| 34 | Auburn | 80,594 | 4,717 | 65.7% | 17.0% | 5.4% | 8.5% |
| 35 | Lincoln | 7,305 | 4,759 | 65.2% | 20.3% | 3.8% | 1.1% |
| 36 | Andalusia | 8,766 | 4,842 | 63.7% | 27.2% | 4.1% | 0.0% |
| 36 | Northport | 31,218 | 4,843 | 64.0% | 26.4% | 6.1% | 0.6% |
| 38 | Pelham | 24,827 | 4,862 | 67.2% | 11.3% | 13.9% | 3.1% |
| 39 | Albertville | 22,813 | 4,867 | 62.4% | 4.6% | 30.8% | 0.5% |
| 40 | Millbrook | 17,189 | 4,874 | 64.4% | 26.4% | 3.1% | 1.4% |
| 41 | Roanoke | 5,336 | 4,889 | 57.4% | 39.9% | 1.5% | 0.1% |
| 42 | Sylacauga | 12,309 | 4,897 | 61.3% | 33.7% | 1.5% | 0.0% |
| 43 | Greenville | 7,163 | 4,907 | 28.6% | 63.8% | 3.3% | 3.5% |
| 44 | Prattville | 39,482 | 4,922 | 65.7% | 23.7% | 4.2% | 1.8% |
| 45 | Alabaster | 33,917 | 4,925 | 67.1% | 16.1% | 12.4% | 1.1% |
| 46 | Monroeville | 5,802 | 4,937 | 34.3% | 61.2% | 0.5% | 0.0% |
| 47 | Bessemer | 25,400 | 4,972 | 20.5% | 66.6% | 10.4% | 0.0% |
| 48 | Hoover | 92,642 | 5,037 | 68.1% | 18.5% | 4.6% | 5.9% |
| 49 | Wetumpka | 7,437 | 5,043 | 63.3% | 32.1% | 1.0% | 1.1% |
| 50 | Birmingham | 198,173 | 5,064 | 24.2% | 66.7% | 4.8% | 1.4% |
| 51 | Brewton | 5,186 | 5,067 | 64.5% | 30.0% | 1.9% | 0.5% |
| 52 | Tuscumbia | 9,115 | 5,072 | 66.5% | 24.6% | 6.5% | 0.0% |
| 53 | Leeds | 12,028 | 5,091 | 68.3% | 13.3% | 15.5% | 0.3% |
| 54 | Lanett | 6,814 | 5,107 | 18.5% | 68.4% | 7.9% | 0.3% |
| 55 | Athens | 29,002 | 5,151 | 69.1% | 16.8% | 8.6% | 1.1% |
| 56 | Sheffield | 9,340 | 5,184 | 67.8% | 23.7% | 2.8% | 0.1% |
| 57 | Helena | 21,769 | 5,263 | 70.0% | 18.0% | 4.7% | 2.5% |
| 58 | Florence | 41,701 | 5,327 | 70.8% | 15.7% | 5.9% | 0.9% |
| 59 | Gardendale | 16,534 | 5,334 | 69.7% | 21.2% | 2.2% | 0.4% |
| 60 | Homewood | 27,829 | 5,351 | 70.9% | 16.4% | 6.0% | 2.4% |
| 61 | Clanton | 8,958 | 5,420 | 71.4% | 15.3% | 9.0% | 0.5% |
| 62 | Tallassee | 5,134 | 5,437 | 70.4% | 20.9% | 2.7% | 0.2% |
| 63 | Center Point | 15,914 | 5,460 | 18.6% | 71.1% | 6.8% | 0.1% |
| 64 | Pleasant Grove | 9,442 | 5,568 | 28.1% | 69.1% | 1.2% | 0.0% |
| 65 | Oxford | 22,063 | 5,652 | 73.3% | 15.1% | 6.0% | 1.4% |
| 66 | Fort Payne | 14,927 | 5,678 | 71.5% | 1.3% | 23.7% | 0.2% |
| 67 | Daphne | 29,453 | 5,710 | 73.6% | 15.4% | 6.1% | 2.0% |
| 68 | Foley | 24,026 | 5,949 | 76.2% | 6.3% | 9.3% | 2.9% |
| 69 | Pell City | 13,587 | 6,013 | 75.2% | 18.4% | 2.2% | 1.1% |
| 70 | Boaz | 10,814 | 6,014 | 75.3% | 1.1% | 17.5% | 0.0% |
| 71 | Semmes | 5,626 | 6,179 | 77.1% | 14.3% | 2.0% | 0.5% |
| 72 | Muscle Shoals | 16,951 | 6,232 | 77.3% | 15.3% | 3.1% | 1.4% |
| 73 | Guntersville | 8,916 | 6,283 | 78.3% | 9.5% | 4.4% | 0.7% |
| 74 | Moody | 13,488 | 6,354 | 78.6% | 11.6% | 3.2% | 1.1% |
| 75 | Jasper | 14,442 | 6,368 | 78.5% | 13.2% | 3.9% | 0.7% |
| 76 | Oneonta | 6,971 | 6,393 | 78.2% | 2.9% | 16.1% | 0.0% |
| 77 | Rainbow City | 10,284 | 6,422 | 79.1% | 11.8% | 2.3% | 2.4% |
| 78 | Opp | 6,709 | 6,452 | 78.6% | 16.3% | 1.2% | 0.0% |
| 79 | Trussville | 26,673 | 6,526 | 79.9% | 10.9% | 3.0% | 3.5% |
| 80 | Spanish Fort | 10,662 | 6,584 | 80.4% | 5.5% | 5.7% | 0.5% |
| 81 | Chelsea | 16,260 | 6,604 | 80.5% | 8.5% | 6.0% | 0.7% |
| 82 | Saraland | 16,404 | 6,607 | 80.1% | 13.1% | 0.9% | 0.4% |
| 83 | Satsuma | 6,822 | 6,651 | 80.9% | 8.8% | 2.8% | 2.6% |
| 84 | Hamilton | 6,922 | 6,696 | 81.0% | 8.9% | 4.6% | 0.0% |
| 85 | Headland | 5,217 | 6,880 | 81.8% | 13.6% | 1.4% | 0.0% |
| 86 | Attalla | 5,775 | 6,917 | 82.5% | 8.6% | 5.4% | 0.0% |
| 87 | Selma | 17,057 | 7,030 | 14.8% | 82.5% | 0.4% | 1.2% |
| 88 | Robertsdale | 7,194 | 7,043 | 83.0% | 12.4% | 1.6% | 0.2% |
| 89 | Midfield | 5,045 | 7,155 | 4.8% | 84.0% | 7.6% | 0.0% |
| 90 | Vestavia Hills | 38,616 | 7,186 | 84.4% | 5.2% | 3.4% | 4.9% |
| 91 | Tuskegee | 8,938 | 7,205 | 11.8% | 84.0% | 1.4% | 0.5% |
| 92 | Scottsboro | 15,712 | 7,234 | 84.6% | 6.3% | 4.2% | 0.9% |
| 93 | Hartselle | 15,847 | 7,498 | 86.2% | 6.7% | 2.5% | 0.1% |
| 94 | Gulf Shores | 16,401 | 7,672 | 87.3% | 2.7% | 6.1% | 1.1% |
| 95 | Orange Beach | 8,407 | 7,673 | 87.3% | 3.9% | 4.0% | 0.1% |
| 96 | Southside | 9,483 | 7,724 | 87.6% | 5.8% | 1.9% | 1.1% |
| 97 | Springville | 5,081 | 7,789 | 87.9% | 6.4% | 0.6% | 0.7% |
| 98 | Arab | 8,679 | 7,821 | 88.1% | 0.8% | 6.7% | 1.7% |
| 99 | Prichard | 18,961 | 7,859 | 10.1% | 88.1% | 0.8% | 0.1% |
| 100 | Fairhope | 24,190 | 7,884 | 88.6% | 3.2% | 4.7% | 0.6% |
Source: U.S. Census ACS 2020-2024. 105 cities with more than 5,000 residents.
Summary
Summary: Diversity Across Alabama
If you’re looking for a scientific breakdown of diversity across Alabama, this is an accurate list.
The most diverse cities in Alabama are Tarrant, Pinson, Hueytown, Gadsden, Decatur, Phenix City, Fultondale, Russellville, Eufaula, and Huntsville.


