
Racial diversity in Alabama is a mixed bag.
There are parts of Alabama where there’s a high level of diversity. But where will you find the most diverse places in Alabama?
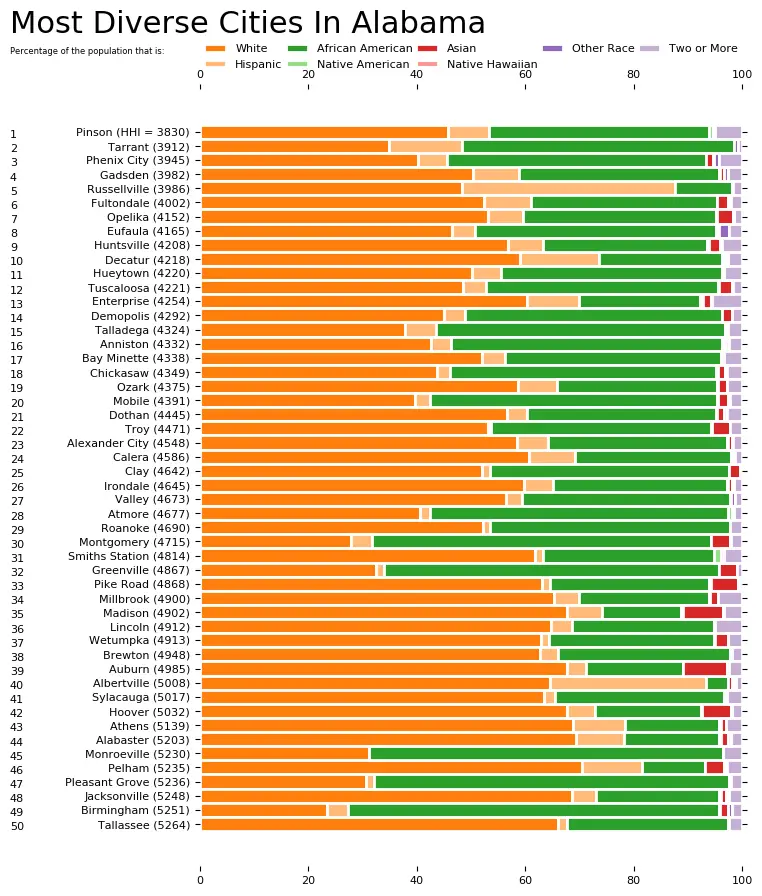
To answer that question, we went to the US Census data. Using Saturday Night Science, we measured the Gini coefficient for all 105 cities in Alabama to rank them from most to least diverse.
Table Of Contents: Top Ten | Methodology | Summary | Table
Here are the 10 most diverse places in Alabama for 2026:
So what city is the most diverse in Alabama? According to the most Census data, Tarrant took the number one over all spot for diversity in Alabama.
Read on below to see how we crunched the numbers and how your town ranked. To see where Alabama ranked as a state, we have a ranking of the most diverse states in Ameria.
For more Alabama reading:
The 10 Most Diverse Places In Alabama For 2026

/10
Population: 5,925
HHI: 3,502
% White: 31.9%
% African American: 45.0%
% Hispanic: 21.4%
% Asian: 0.0%
More on Tarrant: Data | Cost Of Living | Movers

/10
Population: 7,832
HHI: 3,578
% White: 33.4%
% African American: 48.2%
% Hispanic: 10.4%
% Asian: 2.2%
More on Pinson: Data | Cost Of Living | Movers

/10
Population: 16,414
HHI: 3,720
% White: 42.9%
% African American: 42.0%
% Hispanic: 9.6%
% Asian: 0.6%
More on Hueytown: Data | Cost Of Living | Movers

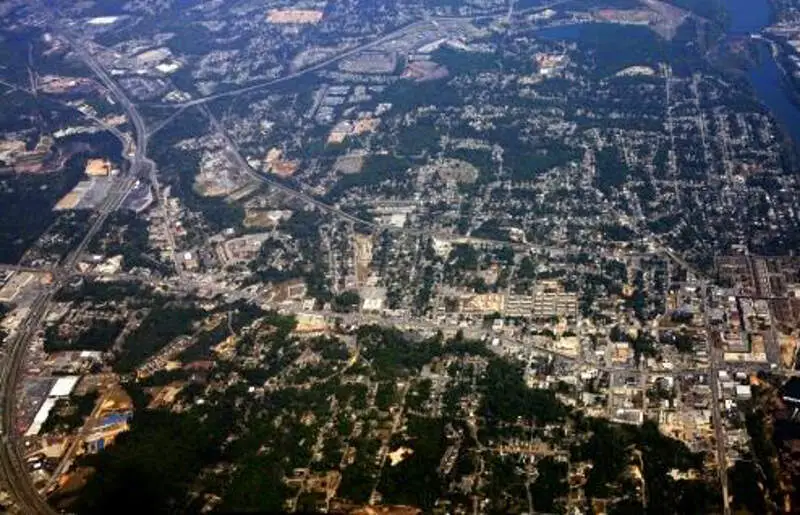
/10
Population: 33,374
HHI: 3,841
% White: 49.3%
% African American: 36.0%
% Hispanic: 10.5%
% Asian: 0.4%
More on Gadsden: Data | Crime | Cost Of Living | Movers

/10
Population: 57,361
HHI: 3,908
% White: 55.6%
% African American: 23.0%
% Hispanic: 16.5%
% Asian: 0.8%
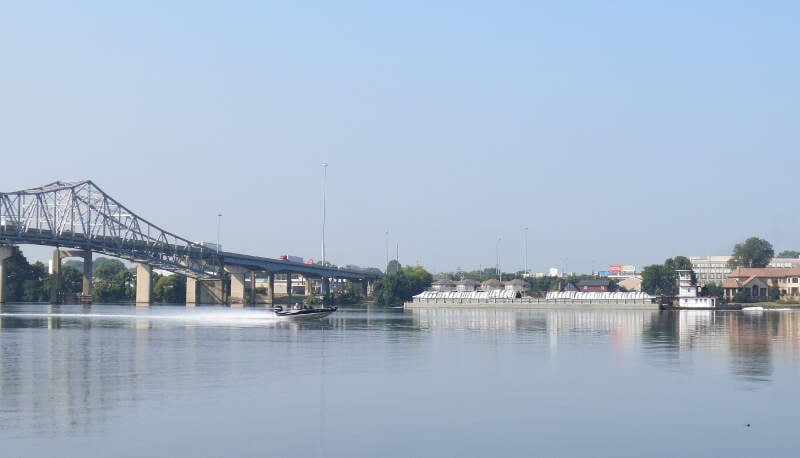
More on Decatur: Data | Cost Of Living | Movers
/10
Population: 38,499
HHI: 3,945
% White: 40.3%
% African American: 47.6%
% Hispanic: 5.7%
% Asian: 1.2%
More on Phenix City: Data | Crime | Cost Of Living | Movers

/10
Population: 9,384
HHI: 3,982
% White: 51.5%
% African American: 34.7%
% Hispanic: 11.0%
% Asian: 0.6%
More on Fultondale: Data | Crime | Cost Of Living | Movers

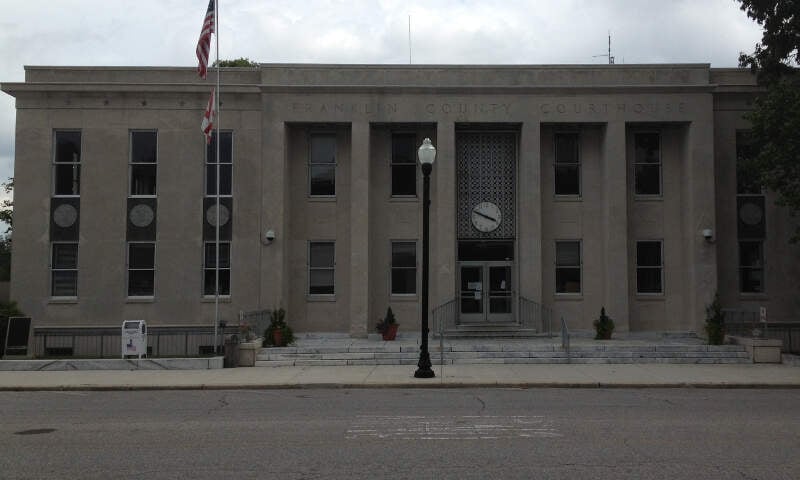
/10
Population: 10,799
HHI: 3,997
% White: 44.8%
% African American: 9.8%
% Hispanic: 43.5%
% Asian: 0.0%
More on Russellville: Data | Cost Of Living | Movers

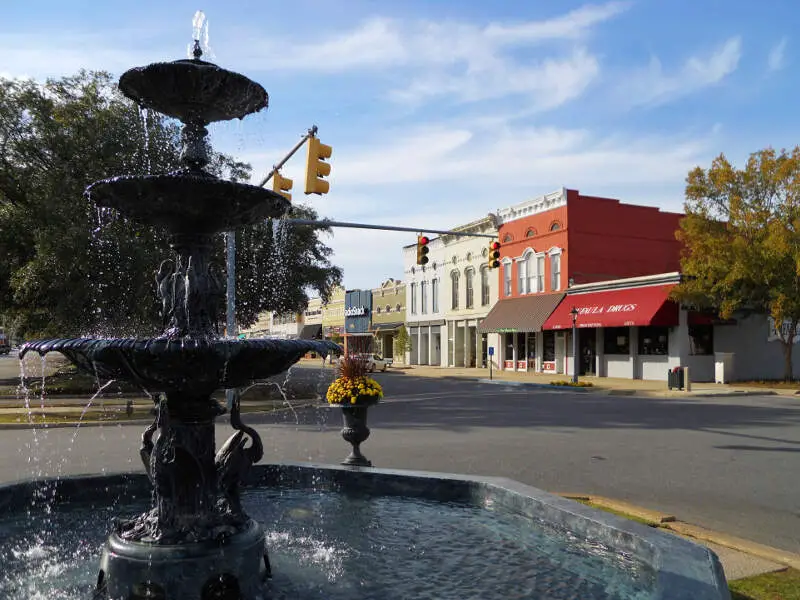
/10
Population: 12,584
HHI: 4,042
% White: 45.0%
% African American: 44.4%
% Hispanic: 7.0%
% Asian: 0.4%
More on Eufaula: Data | Crime | Cost Of Living | Movers

/10
Population: 222,791
HHI: 4,045
% White: 55.9%
% African American: 28.8%
% Hispanic: 8.0%
% Asian: 2.1%
More on Huntsville: Data | Cost Of Living | Movers
Methodology: How we determined the most diverse cities in Alabama for 2026
We still believe in the accuracy of data — especially from the Census — and Saturday Night Science. So that’s where we went to get the race breakdown across Alabama.
That leads us to the Census’s most recently available data, the 2020-2024 American Community Survey data from the US Census.
Specifically, we looked at table B03002: HISPANIC OR LATINO ORIGIN BY RACE. Here are the category names as defined by the Census:
- White alone*
- Black or African American alone*
- American Indian and Alaska Native alone*
- Asian alone*
- Native Hawaiian and Other Pacific Islander alone*
- Some other race alone*
- Two or more races*
- Hispanic or Latino
We limited our analysis to non-CDPs with a population greater than 5,000 people. That left us with 105 cities.
We then calculated the HHI for each city by finding the racial breakdown of a city in percent terms, squaring them, and then adding the squares together. This left us with scores ranging from 3,502 (Tarrant) to 9,047 (Mountain Brook).
Finally, we ranked each city based on the HHI, with a lower score being more diverse than a high score. Tarrant took the distinction of being the most diverse, while Mountain Brook was the least diverse city.
We updated this article for 2026. This report is our eleventh time ranking the most diverse places in Alabama.
Summary: Diversity Across Alabama
If you’re looking for a scientific breakdown of diversity across Alabama, this is an accurate list.
The most diverse cities in Alabama are Tarrant, Pinson, Hueytown, Gadsden, Decatur, Phenix City, Fultondale, Russellville, Eufaula, and Huntsville.
If you’re curious enough, here are the least diverse places in Alabama:
- Mountain Brook
- Glencoe
- Rainsville
For more Alabama reading, check out:
- Best Places To Live In Alabama
- Cheapest Places To Live In Alabama
- Most Dangerous Cities In Alabama
- Best Places To Raise A Family In Alabama
- Safest Places In Alabama
- Worst Places To Live In Alabama
Race By City In Alabama For 2026
| Rank | City | Population | HHI | % White | % Black | % Hispanic | % Asian |
|---|---|---|---|---|---|---|---|
| 1 | Tarrant, AL | 5,925 | 3,502 | 31.9% | 45.0% | 21.4% | 0.0% |
| 2 | Pinson, AL | 7,832 | 3,578 | 33.4% | 48.2% | 10.4% | 2.2% |
| 3 | Hueytown, AL | 16,414 | 3,720 | 42.9% | 42.0% | 9.6% | 0.6% |
| 4 | Gadsden, AL | 33,374 | 3,841 | 49.3% | 36.0% | 10.5% | 0.4% |
| 5 | Decatur, AL | 57,361 | 3,908 | 55.6% | 23.0% | 16.5% | 0.8% |
| 6 | Phenix City, AL | 38,499 | 3,945 | 40.3% | 47.6% | 5.7% | 1.2% |
| 7 | Fultondale, AL | 9,384 | 3,982 | 51.5% | 34.7% | 11.0% | 0.6% |
| 8 | Russellville, AL | 10,799 | 3,997 | 44.8% | 9.8% | 43.5% | 0.0% |
| 9 | Eufaula, AL | 12,584 | 4,042 | 45.0% | 44.4% | 7.0% | 0.4% |
| 10 | Huntsville, AL | 222,791 | 4,045 | 55.9% | 28.8% | 8.0% | 2.1% |
| 11 | Tuscaloosa, AL | 111,038 | 4,059 | 48.8% | 40.4% | 5.7% | 2.5% |
| 12 | Clay, AL | 10,273 | 4,083 | 47.0% | 43.0% | 3.4% | 2.5% |
| 13 | Opelika, AL | 32,820 | 4,109 | 51.3% | 37.7% | 7.2% | 1.8% |
| 14 | Troy, AL | 17,716 | 4,160 | 49.1% | 41.5% | 2.4% | 3.1% |
| 15 | Alexander City, AL | 14,606 | 4,193 | 57.1% | 29.4% | 6.4% | 1.4% |
| 16 | Chickasaw, AL | 6,332 | 4,199 | 40.0% | 50.6% | 3.0% | 1.5% |
| 17 | Valley, AL | 10,277 | 4,216 | 53.0% | 37.0% | 5.6% | 0.4% |
| 18 | Enterprise, AL | 29,505 | 4,221 | 60.4% | 20.0% | 11.9% | 1.5% |
| 19 | Talladega, AL | 14,760 | 4,228 | 41.1% | 50.0% | 2.7% | 1.0% |
| 20 | Mobile, AL | 203,416 | 4,236 | 41.1% | 50.2% | 3.7% | 2.2% |
| 21 | Bay Minette, AL | 8,295 | 4,251 | 51.3% | 39.8% | 3.8% | 1.2% |
| 22 | Dothan, AL | 71,514 | 4,270 | 54.4% | 35.7% | 4.8% | 1.5% |
| 23 | Anniston, AL | 21,271 | 4,291 | 41.5% | 50.5% | 4.2% | 0.4% |
| 24 | Atmore, AL | 8,334 | 4,301 | 41.0% | 51.0% | 3.1% | 0.2% |
| 25 | Ozark, AL | 14,327 | 4,309 | 56.7% | 32.3% | 5.5% | 0.7% |
| 26 | Irondale, AL | 13,464 | 4,349 | 58.7% | 28.6% | 9.0% | 0.7% |
| 27 | Calera, AL | 17,714 | 4,365 | 57.8% | 30.7% | 9.2% | 0.6% |
| 28 | Demopolis, AL | 6,908 | 4,454 | 50.7% | 43.2% | 2.5% | 0.6% |
| 29 | Montevallo, AL | 7,556 | 4,564 | 61.5% | 27.1% | 6.4% | 2.0% |
| 30 | Smiths Station, AL | 5,496 | 4,589 | 60.6% | 29.8% | 4.1% | 0.9% |
| 31 | Jacksonville, AL | 14,437 | 4,652 | 63.4% | 24.1% | 5.6% | 1.4% |
| 32 | Montgomery, AL | 197,494 | 4,660 | 25.8% | 62.8% | 4.9% | 3.4% |
| 33 | Madison, AL | 60,106 | 4,673 | 66.1% | 12.6% | 8.6% | 7.1% |
| 34 | Auburn, AL | 80,594 | 4,717 | 65.7% | 17.0% | 5.4% | 8.5% |
| 35 | Lincoln, AL | 7,305 | 4,758 | 65.2% | 20.3% | 3.8% | 1.1% |
| 36 | Andalusia, AL | 8,766 | 4,842 | 63.7% | 27.2% | 4.1% | 0.0% |
| 37 | Northport, AL | 31,218 | 4,842 | 64.0% | 26.4% | 6.1% | 0.6% |
| 38 | Pelham, AL | 24,827 | 4,861 | 67.2% | 11.3% | 13.9% | 3.1% |
| 39 | Albertville, AL | 22,813 | 4,866 | 62.4% | 4.6% | 30.8% | 0.5% |
| 40 | Millbrook, AL | 17,189 | 4,874 | 64.4% | 26.4% | 3.1% | 1.4% |
| 41 | Roanoke, AL | 5,336 | 4,889 | 57.4% | 39.9% | 1.5% | 0.1% |
| 42 | Sylacauga, AL | 12,309 | 4,897 | 61.3% | 33.7% | 1.5% | 0.0% |
| 43 | Greenville, AL | 7,163 | 4,906 | 28.6% | 63.8% | 3.3% | 3.5% |
| 44 | Prattville, AL | 39,482 | 4,922 | 65.7% | 23.7% | 4.2% | 1.8% |
| 45 | Alabaster, AL | 33,917 | 4,925 | 67.1% | 16.1% | 12.4% | 1.1% |
| 46 | Monroeville, AL | 5,802 | 4,936 | 34.3% | 61.2% | 0.5% | 0.0% |
| 47 | Bessemer, AL | 25,400 | 4,971 | 20.5% | 66.6% | 10.4% | 0.0% |
| 48 | Hoover, AL | 92,642 | 5,036 | 68.1% | 18.5% | 4.6% | 5.9% |
| 49 | Wetumpka, AL | 7,437 | 5,042 | 63.3% | 32.1% | 1.0% | 1.1% |
| 50 | Birmingham, AL | 198,173 | 5,064 | 24.2% | 66.7% | 4.8% | 1.4% |
| 51 | Brewton, AL | 5,186 | 5,067 | 64.5% | 30.0% | 1.9% | 0.5% |
| 52 | Tuscumbia, AL | 9,115 | 5,072 | 66.5% | 24.6% | 6.5% | 0.0% |
| 53 | Leeds, AL | 12,028 | 5,090 | 68.3% | 13.3% | 15.5% | 0.3% |
| 54 | Lanett, AL | 6,814 | 5,107 | 18.5% | 68.4% | 7.9% | 0.3% |
| 55 | Athens, AL | 29,002 | 5,151 | 69.1% | 16.8% | 8.6% | 1.1% |
| 56 | Sheffield, AL | 9,340 | 5,183 | 67.8% | 23.7% | 2.8% | 0.1% |
| 57 | Helena, AL | 21,769 | 5,263 | 70.0% | 18.0% | 4.7% | 2.5% |
| 58 | Florence, AL | 41,701 | 5,327 | 70.8% | 15.7% | 5.9% | 0.9% |
| 59 | Gardendale, AL | 16,534 | 5,333 | 69.7% | 21.2% | 2.2% | 0.4% |
| 60 | Homewood, AL | 27,829 | 5,351 | 70.9% | 16.4% | 6.0% | 2.4% |
| 61 | Clanton, AL | 8,958 | 5,419 | 71.4% | 15.3% | 9.0% | 0.5% |
| 62 | Tallassee, AL | 5,134 | 5,436 | 70.4% | 20.9% | 2.7% | 0.2% |
| 63 | Center Point, AL | 15,914 | 5,459 | 18.6% | 71.1% | 6.8% | 0.1% |
| 64 | Pleasant Grove, AL | 9,442 | 5,568 | 28.1% | 69.1% | 1.2% | 0.0% |
| 65 | Oxford, AL | 22,063 | 5,652 | 73.3% | 15.1% | 6.0% | 1.4% |
| 66 | Fort Payne, AL | 14,927 | 5,678 | 71.5% | 1.3% | 23.7% | 0.2% |
| 67 | Daphne, AL | 29,453 | 5,709 | 73.6% | 15.4% | 6.1% | 2.0% |
| 68 | Foley, AL | 24,026 | 5,949 | 76.2% | 6.3% | 9.3% | 2.9% |
| 69 | Pell City, AL | 13,587 | 6,013 | 75.2% | 18.4% | 2.2% | 1.1% |
| 70 | Boaz, AL | 10,814 | 6,014 | 75.3% | 1.1% | 17.5% | 0.0% |
| 71 | Semmes, AL | 5,626 | 6,179 | 77.1% | 14.3% | 2.0% | 0.5% |
| 72 | Muscle Shoals, AL | 16,951 | 6,232 | 77.3% | 15.3% | 3.1% | 1.4% |
| 73 | Guntersville, AL | 8,916 | 6,282 | 78.3% | 9.5% | 4.4% | 0.7% |
| 74 | Moody, AL | 13,488 | 6,353 | 78.6% | 11.6% | 3.2% | 1.1% |
| 75 | Jasper, AL | 14,442 | 6,367 | 78.5% | 13.2% | 3.9% | 0.7% |
| 76 | Oneonta, AL | 6,971 | 6,392 | 78.2% | 2.9% | 16.1% | 0.0% |
| 77 | Rainbow City, AL | 10,284 | 6,421 | 79.1% | 11.8% | 2.3% | 2.4% |
| 78 | Opp, AL | 6,709 | 6,451 | 78.6% | 16.3% | 1.2% | 0.0% |
| 79 | Trussville, AL | 26,673 | 6,525 | 79.9% | 10.9% | 3.0% | 3.5% |
| 80 | Spanish Fort, AL | 10,662 | 6,583 | 80.4% | 5.5% | 5.7% | 0.5% |
| 81 | Chelsea, AL | 16,260 | 6,604 | 80.5% | 8.5% | 6.0% | 0.7% |
| 82 | Saraland, AL | 16,404 | 6,606 | 80.1% | 13.1% | 0.9% | 0.4% |
| 83 | Satsuma, AL | 6,822 | 6,650 | 80.9% | 8.8% | 2.8% | 2.6% |
| 84 | Hamilton, AL | 6,922 | 6,696 | 81.0% | 8.9% | 4.6% | 0.0% |
| 85 | Headland, AL | 5,217 | 6,880 | 81.8% | 13.6% | 1.4% | 0.0% |
| 86 | Attalla, AL | 5,775 | 6,917 | 82.5% | 8.6% | 5.4% | 0.0% |
| 87 | Selma, AL | 17,057 | 7,029 | 14.8% | 82.5% | 0.4% | 1.2% |
| 88 | Robertsdale, AL | 7,194 | 7,042 | 83.0% | 12.4% | 1.6% | 0.2% |
| 89 | Midfield, AL | 5,045 | 7,155 | 4.8% | 84.0% | 7.6% | 0.0% |
| 90 | Vestavia Hills, AL | 38,616 | 7,185 | 84.4% | 5.2% | 3.4% | 4.9% |
| 91 | Tuskegee, AL | 8,938 | 7,205 | 11.8% | 84.0% | 1.4% | 0.5% |
| 92 | Scottsboro, AL | 15,712 | 7,234 | 84.6% | 6.3% | 4.2% | 0.9% |
| 93 | Hartselle, AL | 15,847 | 7,497 | 86.2% | 6.7% | 2.5% | 0.1% |
| 94 | Gulf Shores, AL | 16,401 | 7,671 | 87.3% | 2.7% | 6.1% | 1.1% |
| 95 | Orange Beach, AL | 8,407 | 7,672 | 87.3% | 3.9% | 4.0% | 0.1% |
| 96 | Southside, AL | 9,483 | 7,723 | 87.6% | 5.8% | 1.9% | 1.1% |
| 97 | Springville, AL | 5,081 | 7,789 | 87.9% | 6.4% | 0.6% | 0.7% |
| 98 | Arab, AL | 8,679 | 7,820 | 88.1% | 0.8% | 6.7% | 1.7% |
| 99 | Prichard, AL | 18,961 | 7,858 | 10.1% | 88.1% | 0.8% | 0.1% |
| 100 | Fairhope, AL | 24,190 | 7,884 | 88.6% | 3.2% | 4.7% | 0.6% |