Racial diversity in California is a mixed bag.
There are parts of California where there’s a high level of diversity. But where will you find the most diverse places in California?
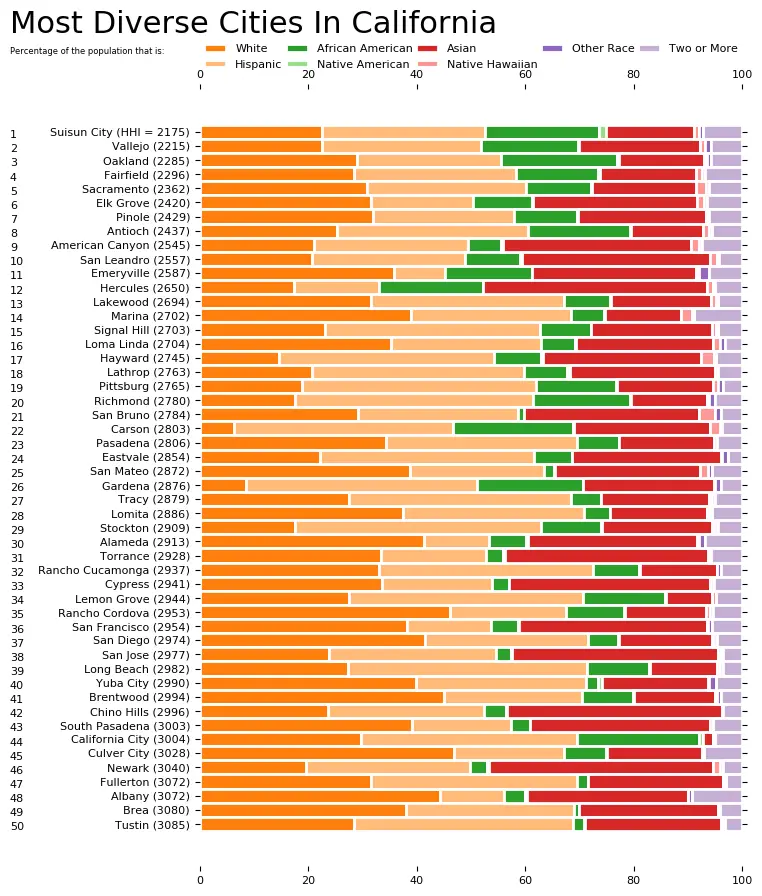
To answer that question, we went to the US Census data. Using Saturday Night Science, we measured the Gini coefficient for all 428 cities in California to rank them from most to least diverse.
Table Of Contents: Top Ten | Methodology | Summary | Table
Here are the 10 most diverse places in California for 2026:
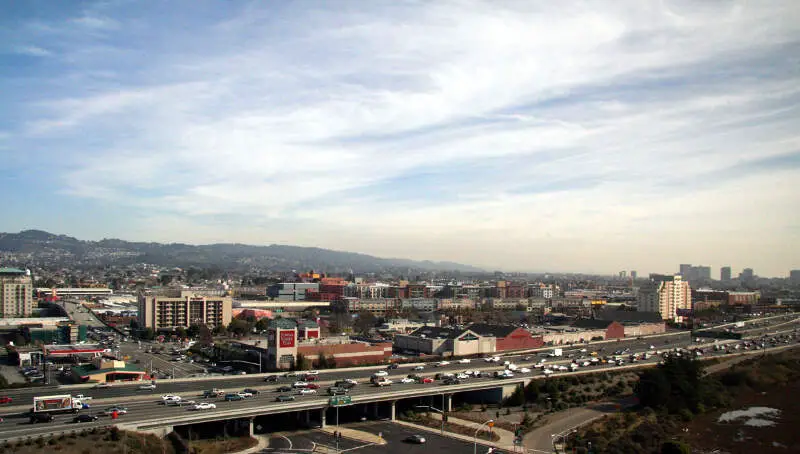
So what city is the most diverse in California? According to the most Census data, Vallejo took the number one over all spot for diversity in California.
Read on below to see how we crunched the numbers and how your town ranked. To see where California ranked as a state, we have a ranking of the most diverse states in Ameria.
For more California reading:
The 10 Most Diverse Places In California For 2026

/10
Population: 124,268
HHI: 2,167
% White: 20.5%
% African American: 16.9%
% Hispanic: 29.8%
% Asian: 22.7%
More on Vallejo: Data | Crime | Cost Of Living | Movers
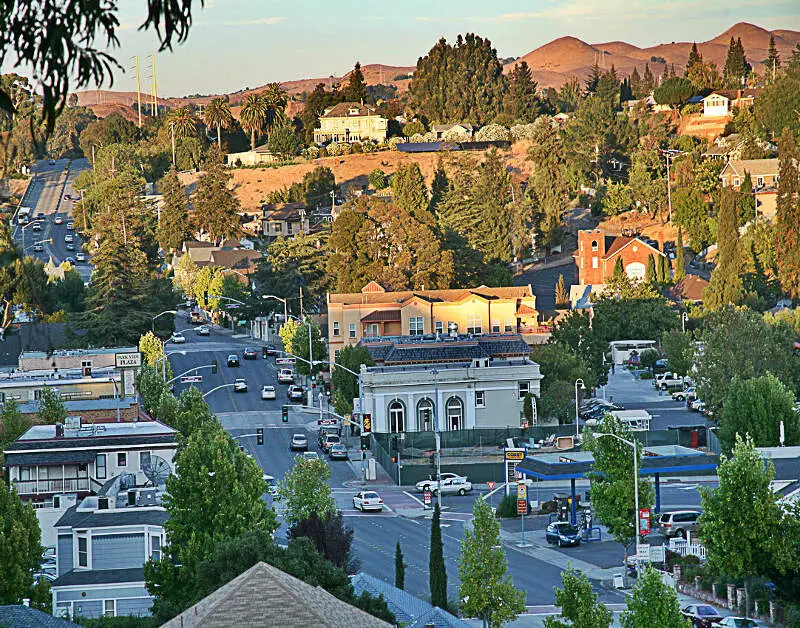
/10
Population: 29,286
HHI: 2,180
% White: 21.7%
% African American: 19.0%
% Hispanic: 30.7%
% Asian: 18.6%
More on Suisun City: Data | Crime | Cost Of Living | Movers

/10
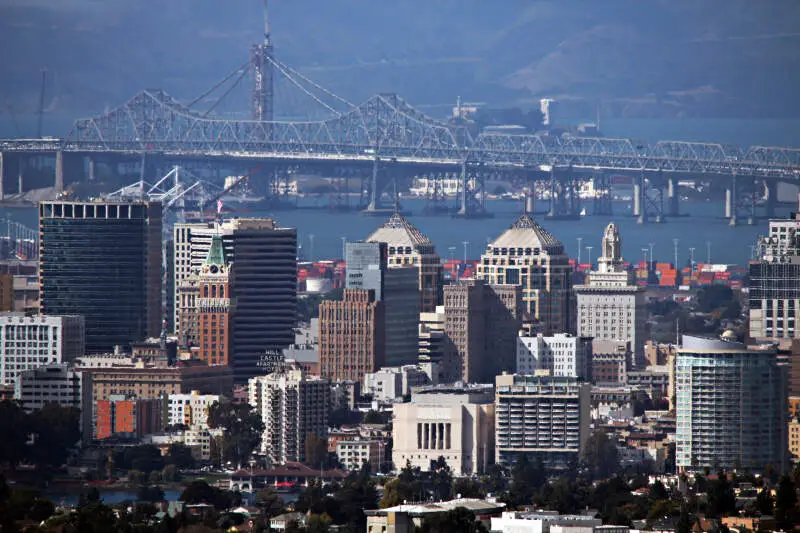
Population: 439,418
HHI: 2,273
% White: 27.8%
% African American: 19.7%
% Hispanic: 28.7%
% Asian: 15.7%
More on Oakland: Data | Crime | Cost Of Living | Movers

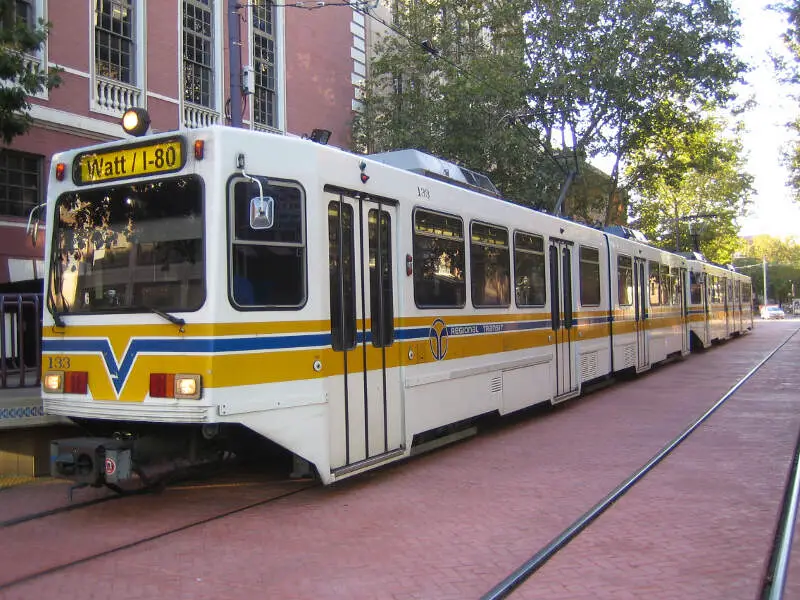
/10
Population: 528,706
HHI: 2,316
% White: 29.3%
% African American: 11.8%
% Hispanic: 29.4%
% Asian: 20.1%
More on Sacramento: Data | Crime | Cost Of Living | Movers

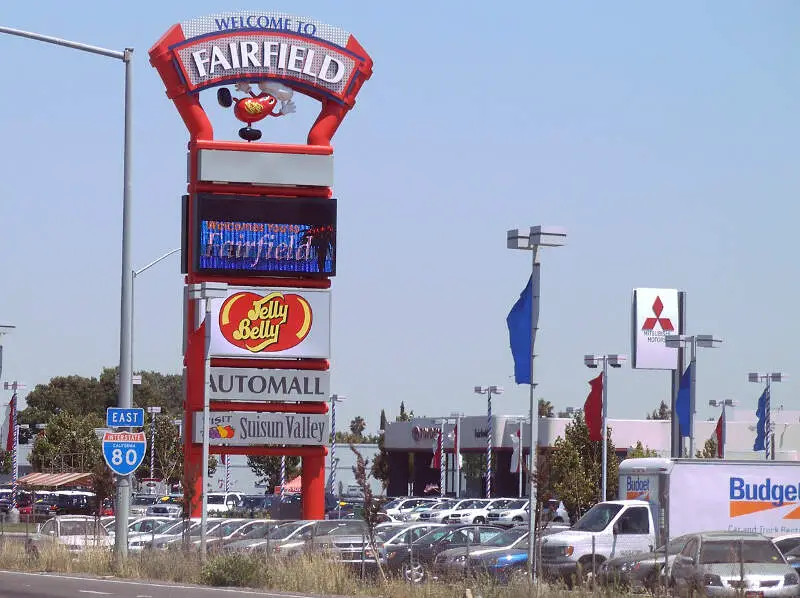
/10
Population: 120,785
HHI: 2,339
% White: 26.4%
% African American: 14.2%
% Hispanic: 32.7%
% Asian: 17.9%
More on Fairfield: Data | Crime | Cost Of Living | Movers

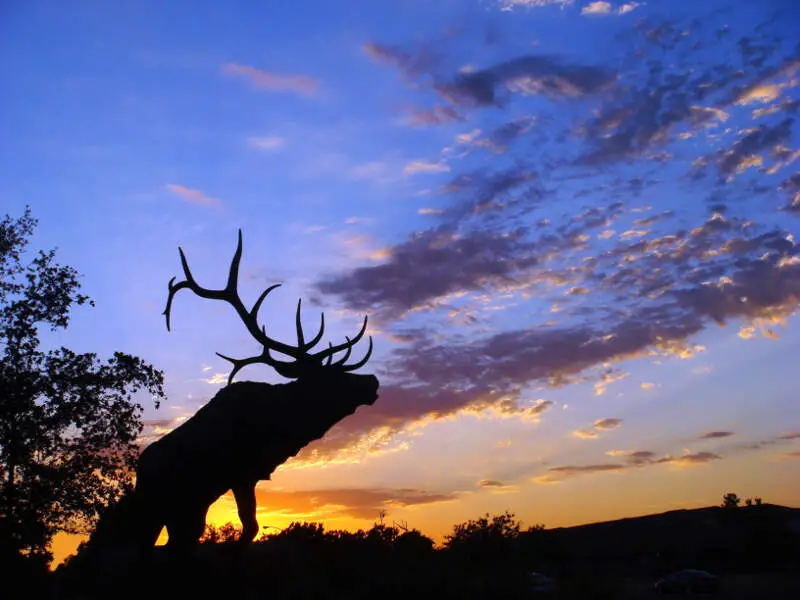
/10
Population: 179,155
HHI: 2,381
% White: 30.4%
% African American: 10.4%
% Hispanic: 17.9%
% Asian: 31.0%
More on Elk Grove: Data | Crime | Cost Of Living | Movers

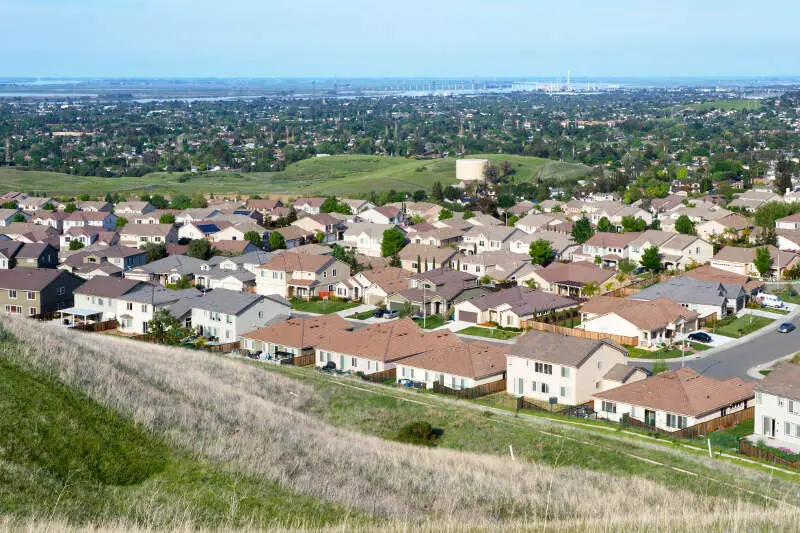
/10
Population: 116,477
HHI: 2,387
% White: 23.4%
% African American: 18.2%
% Hispanic: 35.6%
% Asian: 13.9%
More on Antioch: Data | Crime | Cost Of Living | Movers

/10
Population: 13,081
HHI: 2,469
% White: 31.0%
% African American: 19.2%
% Hispanic: 11.6%
% Asian: 31.4%
More on Emeryville: Data | Crime | Cost Of Living | Movers

/10
Population: 18,761
HHI: 2,526
% White: 29.2%
% African American: 9.0%
% Hispanic: 28.7%
% Asian: 27.2%
More on Pinole: Data | Crime | Cost Of Living | Movers

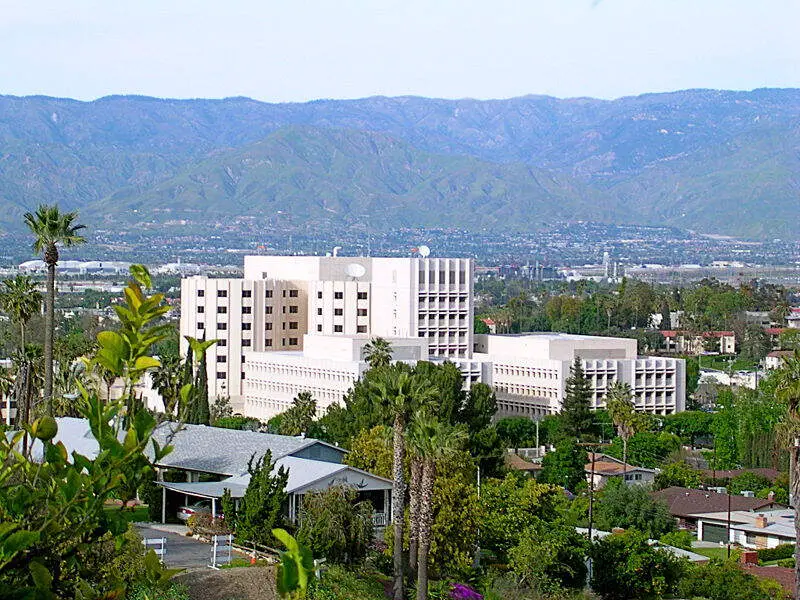
/10
Population: 25,122
HHI: 2,577
% White: 28.5%
% African American: 7.8%
% Hispanic: 29.8%
% Asian: 28.3%
More on Loma Linda: Data | Crime | Cost Of Living | Movers
Methodology: How we determined the most diverse cities in California for 2026
We still believe in the accuracy of data — especially from the Census — and Saturday Night Science. So that’s where we went to get the race breakdown across California.
That leads us to the Census’s most recently available data, the 2020-2024 American Community Survey data from the US Census.
Specifically, we looked at table B03002: HISPANIC OR LATINO ORIGIN BY RACE. Here are the category names as defined by the Census:
- White alone*
- Black or African American alone*
- American Indian and Alaska Native alone*
- Asian alone*
- Native Hawaiian and Other Pacific Islander alone*
- Some other race alone*
- Two or more races*
- Hispanic or Latino
We limited our analysis to non-CDPs with a population greater than 5,000 people. That left us with 428 cities.
We then calculated the HHI for each city by finding the racial breakdown of a city in percent terms, squaring them, and then adding the squares together. This left us with scores ranging from 2,167 (Vallejo) to 9,862 (Huron).
Finally, we ranked each city based on the HHI, with a lower score being more diverse than a high score. Vallejo took the distinction of being the most diverse, while Huron was the least diverse city.
We updated this article for 2026. This report is our eleventh time ranking the most diverse places in California.
Summary: Diversity Across California
If you’re looking for a scientific breakdown of diversity across California, this is an accurate list.
The most diverse cities in California are Vallejo, Suisun City, Oakland, Sacramento, Fairfield, Elk Grove, Antioch, Emeryville, Pinole, and Loma Linda.
If you’re curious enough, here are the least diverse places in California:
- Huron
- Calexico
- Maywood
For more California reading, check out:
- Best Places To Live In California
- Cheapest Places To Live In California
- Most Dangerous Cities In California
- Best Places To Raise A Family In California
- Safest Places In California
- Worst Places To Live In California
Race By City In California For 2026
| Rank | City | Population | HHI | % White | % Black | % Hispanic | % Asian |
|---|---|---|---|---|---|---|---|
| 1 | Vallejo, CA | 124,268 | 2,167 | 20.5% | 16.9% | 29.8% | 22.7% |
| 2 | Suisun City, CA | 29,286 | 2,180 | 21.7% | 19.0% | 30.7% | 18.6% |
| 3 | Oakland, CA | 439,418 | 2,273 | 27.8% | 19.7% | 28.7% | 15.7% |
| 4 | Sacramento, CA | 528,706 | 2,316 | 29.3% | 11.8% | 29.4% | 20.1% |
| 5 | Fairfield, CA | 120,785 | 2,339 | 26.4% | 14.2% | 32.7% | 17.9% |
| 6 | Elk Grove, CA | 179,155 | 2,381 | 30.4% | 10.4% | 17.9% | 31.0% |
| 7 | Antioch, CA | 116,477 | 2,387 | 23.4% | 18.2% | 35.6% | 13.9% |
| 8 | Emeryville, CA | 13,081 | 2,469 | 31.0% | 19.2% | 11.6% | 31.4% |
| 9 | Pinole, CA | 18,761 | 2,526 | 29.2% | 9.0% | 28.7% | 27.2% |
| 10 | Loma Linda, CA | 25,122 | 2,577 | 28.5% | 7.8% | 29.8% | 28.3% |
| 11 | American Canyon, CA | 21,691 | 2,613 | 20.5% | 4.8% | 32.1% | 32.9% |
| 12 | Marina, CA | 22,563 | 2,632 | 37.9% | 7.7% | 30.1% | 12.7% |
| 13 | San Leandro, CA | 87,826 | 2,637 | 19.7% | 9.5% | 29.3% | 35.8% |
| 14 | San Bruno, CA | 42,307 | 2,693 | 28.6% | 2.1% | 29.2% | 31.4% |
| 15 | Pittsburg, CA | 76,257 | 2,698 | 15.8% | 13.7% | 43.0% | 19.5% |
| 16 | Signal Hill, CA | 11,468 | 2,713 | 27.0% | 6.3% | 37.4% | 22.6% |
| 17 | Lathrop, CA | 35,052 | 2,724 | 15.8% | 6.9% | 35.4% | 33.6% |
| 18 | Hercules, CA | 26,302 | 2,745 | 14.4% | 18.3% | 14.5% | 44.1% |
| 19 | Lomita, CA | 20,225 | 2,749 | 34.2% | 4.3% | 34.4% | 17.2% |
| 20 | Pasadena, CA | 136,969 | 2,750 | 34.9% | 8.0% | 34.0% | 17.0% |
| 21 | San Mateo, CA | 103,105 | 2,767 | 34.4% | 1.4% | 27.6% | 28.0% |
| 22 | Carson, CA | 92,871 | 2,778 | 6.3% | 21.7% | 39.1% | 26.8% |
| 23 | Tracy, CA | 96,966 | 2,792 | 23.6% | 6.4% | 40.4% | 23.2% |
| 24 | Alameda, CA | 77,238 | 2,798 | 40.9% | 6.0% | 13.9% | 28.6% |
| 25 | Lakewood, CA | 79,850 | 2,804 | 30.4% | 7.0% | 38.9% | 17.0% |
| 26 | La Habra Heights, CA | 5,478 | 2,845 | 44.4% | 1.4% | 19.4% | 20.1% |
| 27 | Brentwood, CA | 65,208 | 2,849 | 42.2% | 7.7% | 27.1% | 15.3% |
| 28 | Hayward, CA | 158,801 | 2,853 | 12.7% | 7.6% | 41.3% | 30.0% |
| 29 | Torrance, CA | 142,130 | 2,864 | 32.7% | 3.6% | 19.3% | 37.0% |
| 30 | Richmond, CA | 115,505 | 2,867 | 18.1% | 16.1% | 45.5% | 13.6% |
| 31 | Rancho Cucamonga, CA | 175,411 | 2,875 | 33.4% | 8.3% | 38.1% | 15.0% |
| 32 | South Pasadena, CA | 26,068 | 2,896 | 35.2% | 2.8% | 19.7% | 35.0% |
| 33 | San Francisco, CA | 830,235 | 2,898 | 36.8% | 4.7% | 16.2% | 34.9% |
| 34 | Culver City, CA | 39,931 | 2,907 | 44.8% | 6.6% | 20.0% | 19.8% |
| 35 | San Diego, CA | 1,389,526 | 2,917 | 40.9% | 5.3% | 29.8% | 17.3% |
| 36 | Long Beach, CA | 455,548 | 2,917 | 26.2% | 11.4% | 43.8% | 12.7% |
| 37 | Stockton, CA | 322,326 | 2,935 | 16.8% | 10.8% | 45.6% | 20.8% |
| 38 | Yuba City, CA | 69,471 | 2,936 | 37.2% | 1.9% | 33.3% | 20.2% |
| 39 | Brea, CA | 47,469 | 2,941 | 35.4% | 1.6% | 29.9% | 27.7% |
| 40 | Cypress, CA | 49,498 | 2,943 | 31.5% | 2.9% | 21.5% | 38.1% |
| 41 | Rancho Cordova, CA | 81,849 | 2,945 | 46.0% | 10.0% | 22.0% | 14.7% |
| 42 | West Sacramento, CA | 54,927 | 2,950 | 40.0% | 4.6% | 33.2% | 13.0% |
| 43 | California City, CA | 14,414 | 2,952 | 28.2% | 23.5% | 39.6% | 2.0% |
| 44 | Redwood City, CA | 82,447 | 2,974 | 36.7% | 2.9% | 35.6% | 18.0% |
| 45 | Vacaville, CA | 102,596 | 2,982 | 44.3% | 8.3% | 27.9% | 11.0% |
| 46 | Chino Hills, CA | 77,927 | 2,999 | 23.8% | 4.4% | 27.3% | 40.7% |
| 47 | Gardena, CA | 59,422 | 3,002 | 7.4% | 17.2% | 44.4% | 25.6% |
| 48 | San Jose, CA | 990,138 | 3,005 | 22.3% | 2.7% | 30.8% | 39.2% |
| 49 | Eastvale, CA | 70,633 | 3,011 | 16.8% | 7.4% | 41.5% | 30.8% |
| 50 | Morgan Hill, CA | 45,425 | 3,016 | 37.3% | 2.8% | 35.9% | 17.1% |
| 51 | Live Oak, CA | 9,347 | 3,028 | 28.9% | 1.9% | 41.7% | 20.7% |
| 52 | Concord, CA | 124,035 | 3,036 | 41.6% | 3.7% | 32.4% | 13.7% |
| 53 | El Cerrito, CA | 25,994 | 3,039 | 44.1% | 5.2% | 14.8% | 28.3% |
| 54 | Claremont, CA | 36,595 | 3,041 | 44.0% | 6.9% | 28.8% | 14.4% |
| 55 | Tustin, CA | 78,981 | 3,055 | 25.5% | 2.5% | 41.2% | 26.2% |
| 56 | Lemon Grove, CA | 27,686 | 3,057 | 26.9% | 12.0% | 45.4% | 10.0% |
| 57 | Albany, CA | 19,414 | 3,057 | 43.0% | 3.4% | 12.2% | 31.2% |
| 58 | Mountain View, CA | 83,732 | 3,063 | 37.4% | 2.4% | 17.5% | 36.3% |
| 59 | Oakley, CA | 45,183 | 3,067 | 40.7% | 8.8% | 34.7% | 9.9% |
| 60 | Fountain Valley, CA | 56,258 | 3,088 | 37.6% | 1.6% | 17.2% | 36.7% |
| 61 | Los Alamitos, CA | 11,794 | 3,093 | 42.2% | 2.4% | 31.3% | 17.1% |
| 62 | Lake Forest, CA | 86,281 | 3,096 | 44.1% | 2.4% | 27.0% | 19.7% |
| 63 | Fullerton, CA | 140,968 | 3,105 | 29.4% | 1.8% | 40.3% | 24.6% |
| 64 | Campbell, CA | 42,781 | 3,108 | 44.9% | 1.5% | 19.5% | 25.8% |
| 65 | San Dimas, CA | 33,789 | 3,113 | 33.7% | 3.4% | 40.9% | 16.3% |
| 66 | Monrovia, CA | 37,571 | 3,129 | 28.1% | 5.5% | 45.2% | 15.6% |
| 67 | Manteca, CA | 89,043 | 3,130 | 34.0% | 4.0% | 41.2% | 15.6% |
| 68 | Placentia, CA | 52,826 | 3,131 | 36.6% | 2.1% | 37.9% | 18.4% |
| 69 | Pacifica, CA | 37,261 | 3,138 | 47.0% | 1.2% | 19.6% | 21.7% |
| 70 | Twentynine Palms, CA | 27,355 | 3,158 | 46.5% | 9.3% | 27.6% | 3.9% |
| 71 | Artesia, CA | 15,889 | 3,176 | 13.1% | 5.2% | 33.1% | 43.2% |
| 72 | Newark, CA | 46,903 | 3,189 | 16.7% | 3.2% | 27.2% | 46.3% |
| 73 | Berkeley, CA | 120,257 | 3,190 | 49.9% | 7.7% | 12.8% | 20.4% |
| 74 | South San Francisco, CA | 64,305 | 3,190 | 20.0% | 1.5% | 32.1% | 41.8% |
| 75 | Santa Clarita, CA | 230,221 | 3,209 | 41.2% | 4.3% | 36.3% | 12.0% |
| 76 | Buena Park, CA | 82,871 | 3,217 | 20.0% | 1.7% | 42.1% | 32.1% |
| 77 | Upland, CA | 79,257 | 3,225 | 34.2% | 5.9% | 43.4% | 11.1% |
| 78 | Los Angeles, CA | 3,857,263 | 3,237 | 28.1% | 8.1% | 47.2% | 11.9% |
| 79 | Barstow, CA | 25,100 | 3,247 | 22.2% | 16.4% | 49.1% | 2.9% |
| 80 | La Mirada, CA | 47,180 | 3,254 | 25.8% | 3.1% | 46.0% | 21.2% |
| 81 | Belmont, CA | 27,337 | 3,261 | 45.8% | 1.8% | 13.1% | 30.6% |
| 82 | Lancaster, CA | 169,169 | 3,272 | 23.5% | 19.1% | 48.2% | 4.1% |
| 83 | Murrieta, CA | 112,064 | 3,291 | 46.6% | 5.2% | 31.4% | 8.4% |
| 84 | Redlands, CA | 73,375 | 3,337 | 40.6% | 5.6% | 39.5% | 8.2% |
| 85 | Seaside, CA | 31,814 | 3,339 | 29.4% | 4.7% | 48.2% | 9.4% |
| 86 | Irvine, CA | 311,690 | 3,342 | 34.3% | 1.9% | 11.4% | 44.6% |
| 87 | Oceanside, CA | 172,242 | 3,343 | 42.6% | 4.2% | 37.5% | 8.2% |
| 88 | Menifee, CA | 110,305 | 3,343 | 39.1% | 7.2% | 41.2% | 6.1% |
| 89 | Duarte, CA | 22,184 | 3,345 | 23.5% | 4.0% | 49.4% | 17.9% |
| 90 | La Verne, CA | 30,600 | 3,350 | 43.3% | 3.1% | 36.3% | 10.8% |
| 91 | Sierra Madre, CA | 10,940 | 3,351 | 51.6% | 6.6% | 17.9% | 17.1% |
| 92 | Orange, CA | 138,266 | 3,352 | 39.2% | 1.5% | 39.9% | 13.8% |
| 93 | Glendora, CA | 50,926 | 3,355 | 40.1% | 2.8% | 39.7% | 11.9% |
| 94 | Temecula, CA | 111,167 | 3,356 | 48.4% | 4.7% | 29.0% | 10.3% |
| 95 | Davis, CA | 66,978 | 3,360 | 49.9% | 2.2% | 15.1% | 24.2% |
| 96 | Clovis, CA | 124,725 | 3,372 | 45.0% | 1.8% | 33.8% | 13.3% |
| 97 | Rancho Palos Verdes, CA | 40,864 | 3,388 | 46.7% | 1.6% | 12.1% | 31.8% |
| 98 | Millbrae, CA | 22,689 | 3,401 | 29.4% | 0.8% | 13.9% | 48.1% |
| 99 | Pleasanton, CA | 76,960 | 3,407 | 36.1% | 1.6% | 12.5% | 43.7% |
| 100 | Corona, CA | 159,670 | 3,409 | 30.4% | 4.9% | 48.1% | 11.6% |


