Racial diversity in Virginia is a mixed bag.
There are parts of Virginia where there’s a high level of diversity. But where will you find the most diverse places in Virginia?
To answer that question, we went to the US Census data. Using Saturday Night Science, we measured the Gini coefficient for all 62 cities in Virginia to rank them from most to least diverse.
#1 most diverse in Virginia
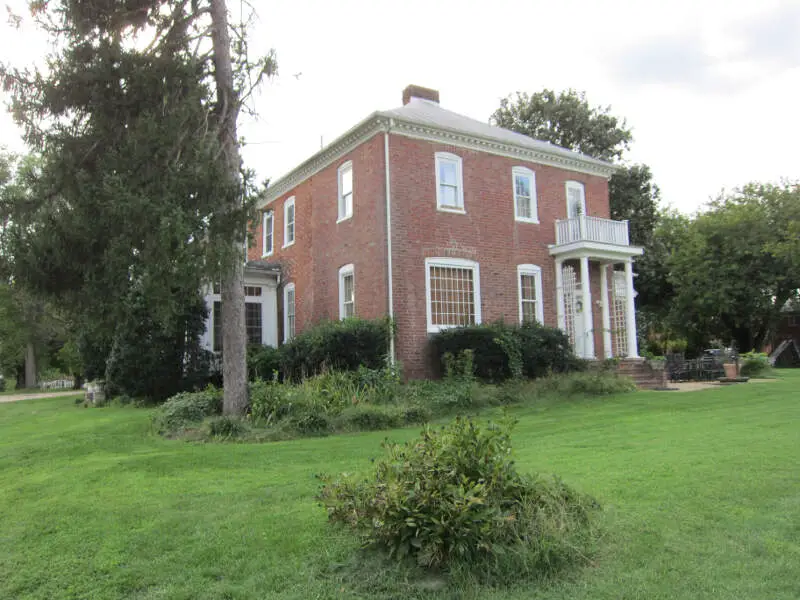
Dumfries, officially the Town of Dumfries, is a town in Prince William County, Virginia. The population was 4,961 at the 2010 United States Census.
Data | Crime | Cost of living | Movers
#2 most diverse in Virginia
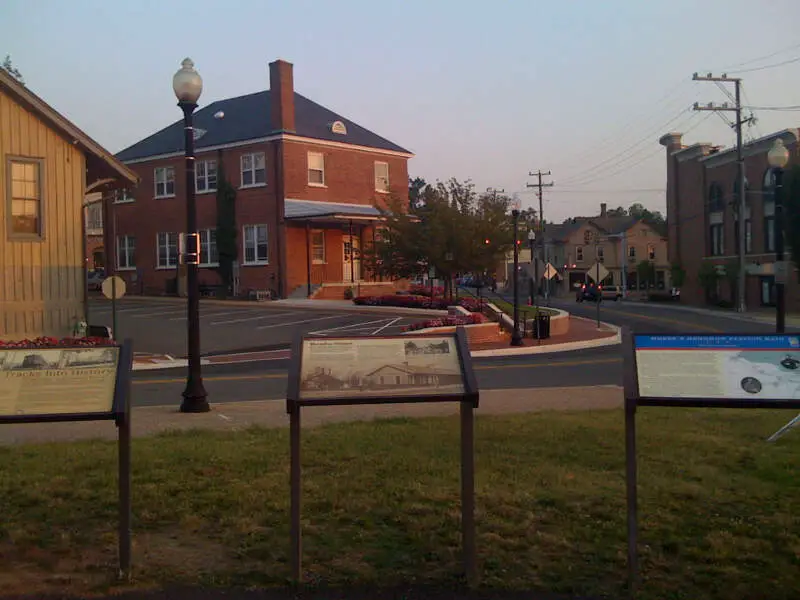
Herndon is a town in Fairfax County, Virginia, in the Washington, D.C. metropolitan area of the United States. The population was 23,292 at the 2010 census, which makes it the largest of three incorporated towns in the county.
Data | Crime | Cost of living | Movers
#3 most diverse in Virginia
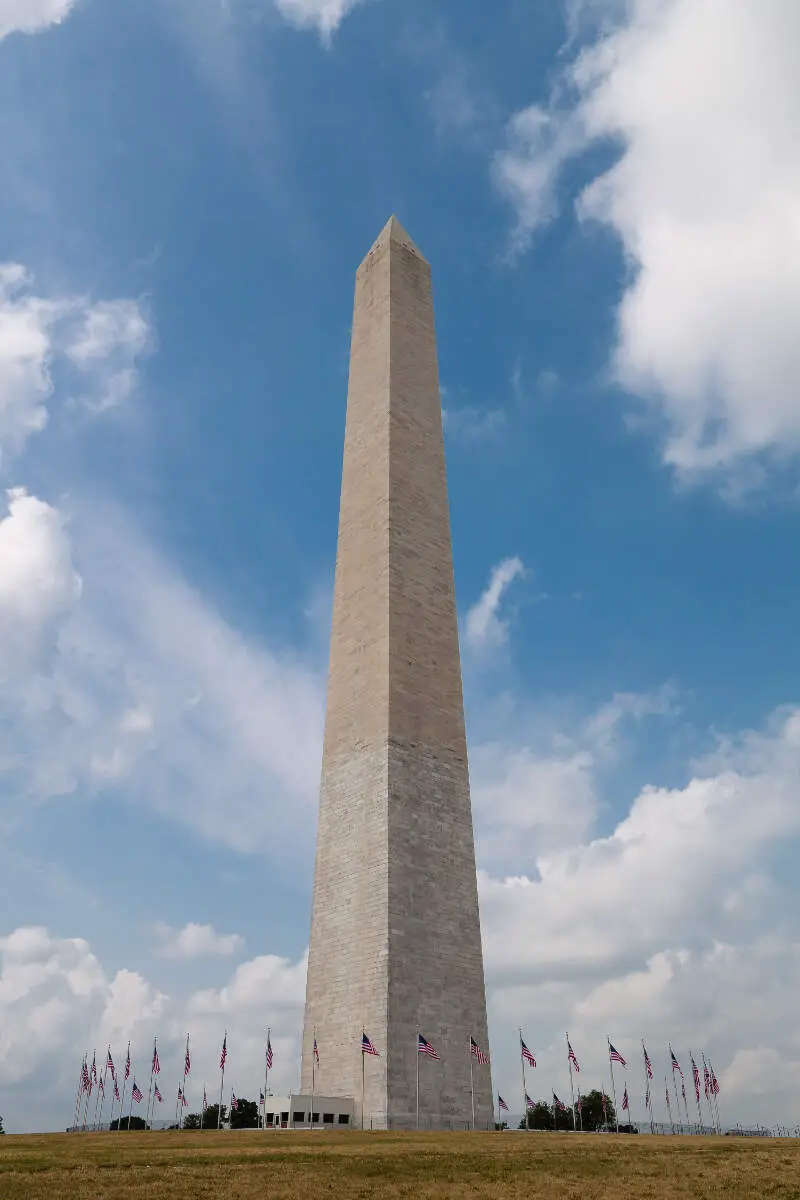
Manassas Park is an independent city in the U.S. state of Virginia. As of the 2010 census, the population was 14,273. Manassas Park is bordered by the city of Manassas and Prince William County. Manassas Park is a part of the Washington-Arlington-Alexandria, DC-VA-MD-WV Metropolitan Statistical Area. “A” Fort and Battery Hill Redoubt-Camp Early resides in Manassas Park.
Data | Crime | Cost of living | Movers
#4 most diverse in Virginia
Manassas is an independent city in the Commonwealth of Virginia. As of the 2010 Census, the population was 37,821. The city borders Prince William County, the independent city of Manassas Park, and Fairfax County. The Bureau of Economic Analysis includes both Manassas and Manassas Park with Prince William County for statistical purposes.
Data | Crime | Cost of living | Movers
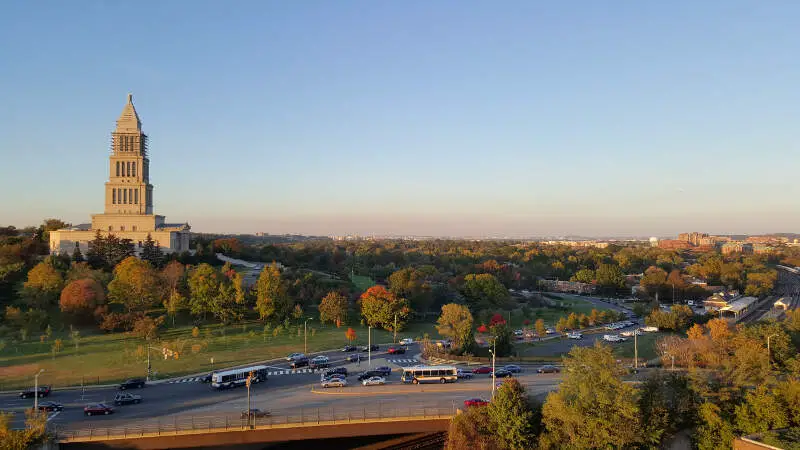
#5 most diverse in Virginia
Alexandria is an independent city in the Commonwealth of Virginia in the United States. As of the 2010 census, the population was 139,966, and in 2016, the population was estimated to be 155,810. Located along the western bank of the Potomac River, Alexandria is approximately 7 miles south of downtown Washington, D.C.
Data | Crime | Cost of living | Movers
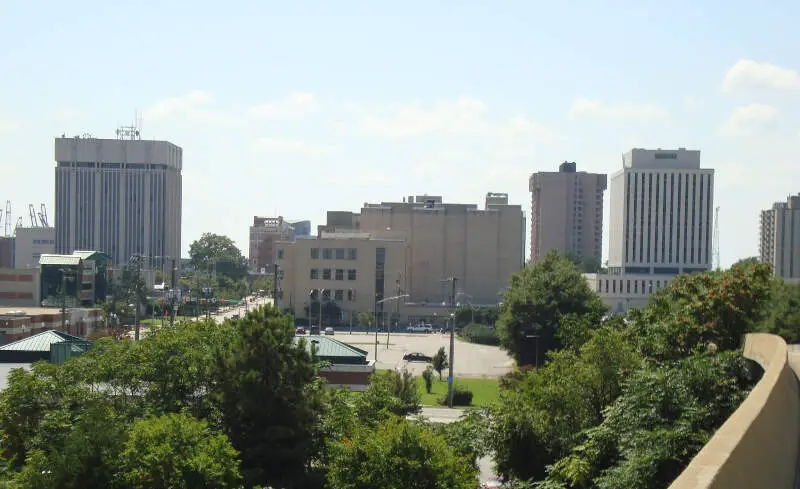
#6 most diverse in Virginia
Newport News is an independent city in the Commonwealth of Virginia. As of the 2010 census, the population was 180,719. In 2013, the population was estimated to be 183,412, making it the fifth-most populous city in Virginia.
Data | Crime | Cost of living | Movers
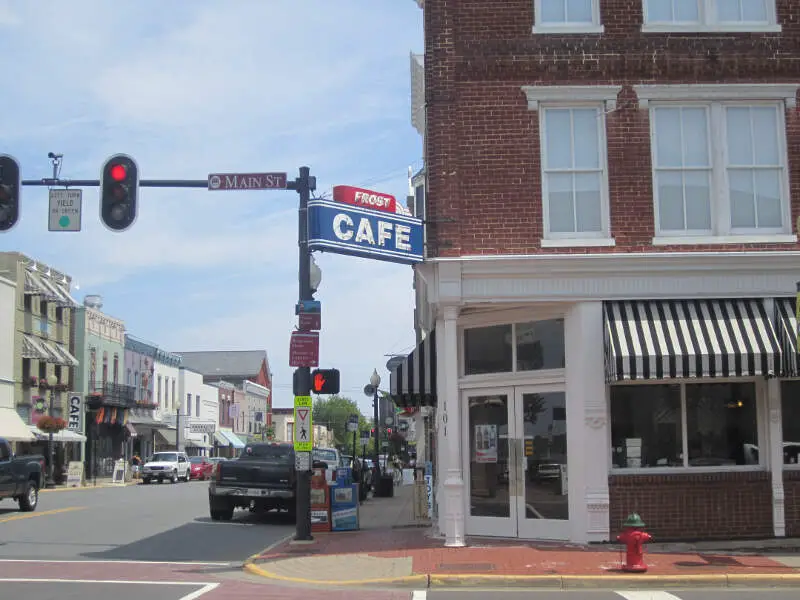
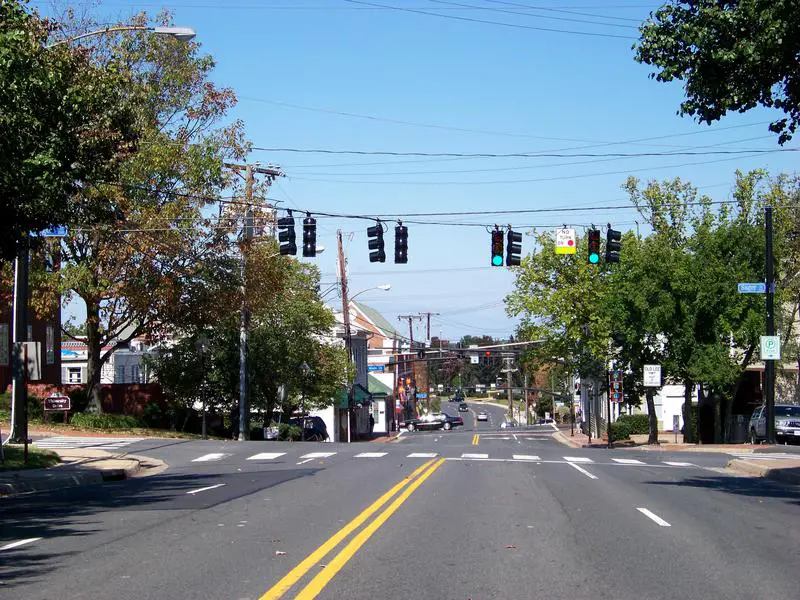
#7 most diverse in Virginia
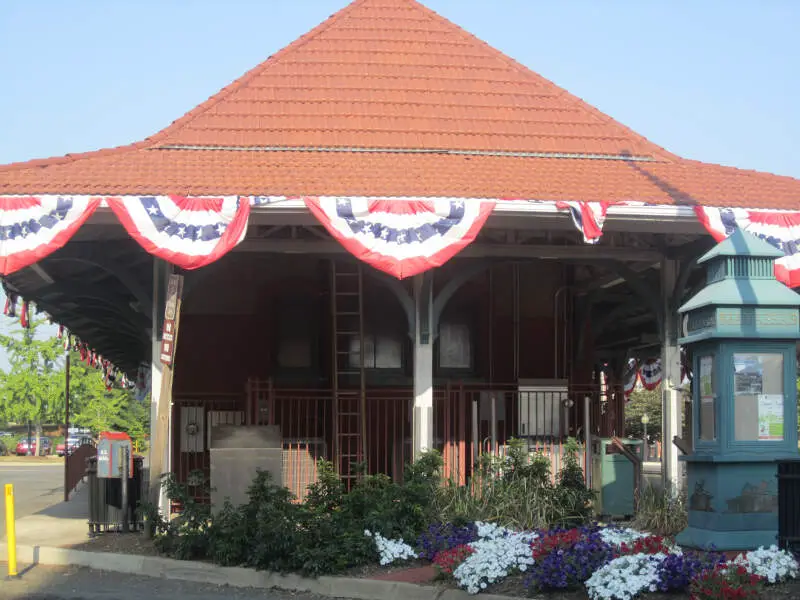
Culpeper is the only incorporated town in Culpeper County, Virginia, United States. The population was 16,379 at the 2010 census, up from 9,664 at the 2000 census. It is the county seat of Culpeper County.
Data | Crime | Cost of living | Movers
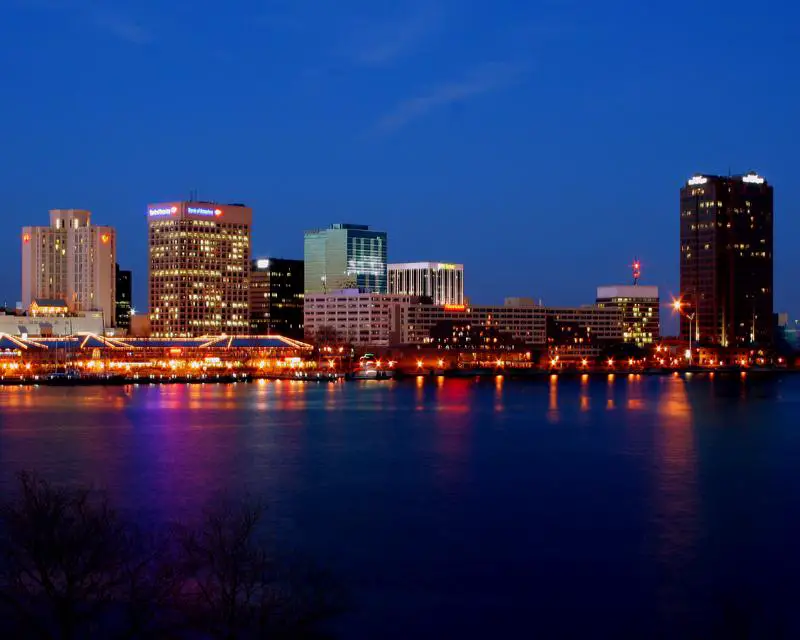
#8 most diverse in Virginia
Norfolk is an independent city located in the Commonwealth of Virginia in the United States. At the 2010 census, the population was 242,803; in 2015, the population was estimated to be 247,189 making it the second-most populous city in Virginia after neighboring Virginia Beach.
Data | Crime | Cost of living | Movers | Compare
#9 most diverse in Virginia
Fairfax, colloquially Central Fairfax, Downtown Fairfax, Fairfax City, or the City of Fairfax, is an independent city in the Commonwealth of Virginia. As of the 2010 census the population was 22,565, which had risen to an estimated 24,013 as of 2015.
Data | Crime | Cost of living | Movers
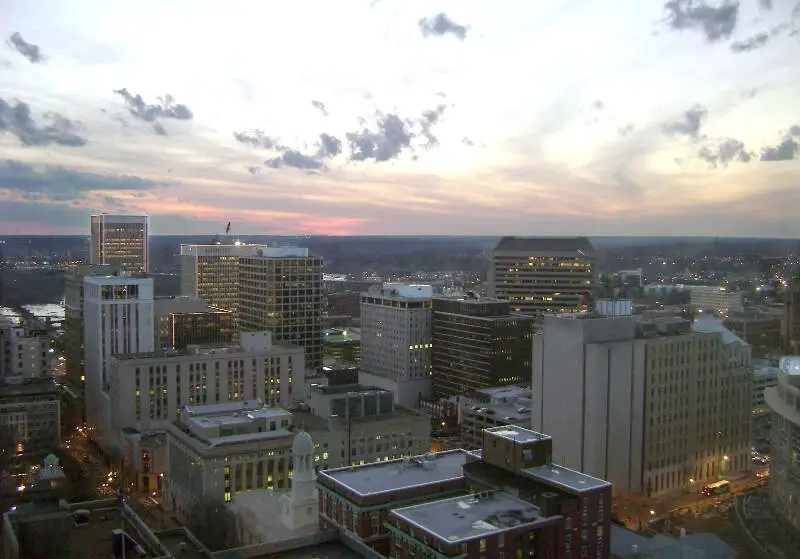
#10 most diverse in Virginia
Richmond is the capital of the Commonwealth of Virginia. It is the center of the Richmond Metropolitan Statistical Area and the Greater Richmond Region. It was incorporated in 1742, and has been an independent city since 1871.
Data | Crime | Cost of living | Movers | Compare
The receipts
Compare the top ten
Pick a metric. The bars rescale. The red line is Virginia’s statewide median.
On the map
Where diversity lives in Virginia
Saturday Night Science
Methodology: How we determined the most diverse cities in Virginia for 2026
We still believe in the accuracy of data — especially from the Census — and Saturday Night Science. So that’s where we went to get the race breakdown across Virginia.
That leads us to the Census’s most recently available data, the 2020-2024 American Community Survey data from the US Census.
Specifically, we looked at table B03002: HISPANIC OR LATINO ORIGIN BY RACE. Here are the category names as defined by the Census:
- White alone*
- Black or African American alone*
- American Indian and Alaska Native alone*
- Asian alone*
- Native Hawaiian and Other Pacific Islander alone*
- Some other race alone*
- Two or more races*
- Hispanic or Latino
We limited our analysis to non-CDPs with a population greater than 5,000 people. That left us with 62 cities.
We then calculated the HHI for each city by finding the racial breakdown of a city in percent terms, squaring them, and then adding the squares together. This left us with scores ranging from 2,618 (Dumfries) to 9,526 (Richlands).
Finally, we ranked each city based on the HHI, with a lower score being more diverse than a high score. Dumfries took the distinction of being the most diverse, while Richlands was the least diverse city.
We updated this article for 2026. This report is our eleventh time ranking the most diverse places in Virginia.
The full plate
Race By City In Virginia For 2026
Click any column to sort. Search by city name.
| Rank | City | Population | HHI | % White | % Black | % Hispanic | % Asian |
|---|---|---|---|---|---|---|---|
| 1 | Dumfries | 5,816 | 2,618 | 20.5% | 26.7% | 36.9% | 3.4% |
| 2 | Herndon | 24,672 | 2,844 | 36.0% | 8.1% | 34.6% | 16.1% |
| 3 | Manassas Park | 16,798 | 3,186 | 26.4% | 13.6% | 46.8% | 10.2% |
| 4 | Manassas | 42,976 | 3,232 | 33.3% | 11.8% | 43.9% | 5.6% |
| 5 | Alexandria | 156,976 | 3,251 | 49.1% | 21.0% | 18.3% | 6.2% |
| 6 | Newport News | 184,216 | 3,339 | 39.2% | 40.6% | 10.8% | 3.3% |
| 7 | Culpeper | 20,794 | 3,347 | 48.2% | 16.8% | 26.5% | 2.1% |
| 8 | Norfolk | 233,596 | 3,353 | 41.2% | 38.9% | 10.1% | 3.6% |
| 9 | Fairfax | 25,026 | 3,368 | 51.1% | 6.3% | 18.9% | 18.4% |
| 10 | Richmond | 229,359 | 3,497 | 41.4% | 40.6% | 10.7% | 2.1% |
| 11 | Hopewell | 22,959 | 3,521 | 40.7% | 41.6% | 8.9% | 1.1% |
| 12 | Leesburg | 49,171 | 3,584 | 54.1% | 8.6% | 20.7% | 11.3% |
| 13 | Fredericksburg | 28,873 | 3,614 | 54.7% | 19.4% | 12.6% | 3.9% |
| 14 | Hampton | 137,557 | 3,651 | 35.2% | 48.1% | 6.9% | 2.2% |
| 15 | Martinsville | 13,658 | 3,753 | 41.7% | 43.9% | 8.6% | 2.9% |
| 16 | Chesapeake | 252,583 | 3,807 | 53.8% | 28.5% | 7.7% | 3.8% |
| 17 | Portsmouth | 97,190 | 3,847 | 35.4% | 50.2% | 5.4% | 1.6% |
| 18 | Suffolk | 98,796 | 3,876 | 45.8% | 41.6% | 5.2% | 1.8% |
| 19 | Roanoke | 98,355 | 3,928 | 55.3% | 27.7% | 9.0% | 3.1% |
| 20 | Virginia Beach | 456,349 | 3,962 | 58.8% | 18.2% | 9.1% | 7.1% |
| 21 | Danville | 42,214 | 4,098 | 38.8% | 50.5% | 5.6% | 1.2% |
| 22 | South Boston | 7,853 | 4,235 | 41.3% | 50.0% | 4.9% | 1.9% |
| 23 | Winchester | 27,913 | 4,315 | 61.4% | 7.7% | 21.0% | 2.2% |
| 24 | Harrisonburg | 51,392 | 4,334 | 60.8% | 7.2% | 23.6% | 3.5% |
| 25 | Lynchburg | 79,497 | 4,367 | 59.9% | 27.0% | 5.1% | 2.2% |
| 26 | Franklin | 8,250 | 4,460 | 37.7% | 54.8% | 3.2% | 0.0% |
| 27 | Charlottesville | 45,437 | 4,489 | 64.2% | 15.5% | 6.9% | 7.0% |
| 28 | Vienna | 16,412 | 4,532 | 64.7% | 4.5% | 8.5% | 14.1% |
| 29 | Emporia | 5,547 | 4,617 | 18.3% | 64.3% | 7.9% | 0.6% |
| 30 | Ashland | 7,772 | 4,633 | 64.2% | 19.2% | 11.3% | 1.2% |
| 31 | Colonial Heights | 18,352 | 4,694 | 65.2% | 18.7% | 8.3% | 3.7% |
| 32 | Farmville | 7,774 | 4,845 | 64.5% | 25.6% | 2.4% | 1.5% |
| 32 | Williamsburg | 15,798 | 4,845 | 67.2% | 14.3% | 8.3% | 6.6% |
| 34 | Falls Church | 14,710 | 4,892 | 68.0% | 3.5% | 10.8% | 9.1% |
| 35 | Woodstock | 5,871 | 5,046 | 67.2% | 6.4% | 21.8% | 4.2% |
| 36 | Orange | 5,066 | 5,126 | 66.9% | 24.7% | 3.1% | 0.0% |
| 37 | Warrenton | 10,176 | 5,254 | 70.8% | 9.9% | 9.7% | 2.7% |
| 38 | Waynesboro | 22,841 | 5,376 | 71.6% | 10.9% | 9.7% | 1.8% |
| 39 | Front Royal | 15,296 | 5,528 | 73.0% | 9.0% | 9.4% | 1.8% |
| 40 | Purcellville | 8,973 | 5,727 | 74.3% | 7.1% | 11.7% | 2.4% |
| 41 | Petersburg | 33,537 | 5,769 | 14.4% | 74.2% | 6.5% | 1.3% |
| 42 | Blacksburg | 45,446 | 5,805 | 75.0% | 3.9% | 4.9% | 11.4% |
| 43 | Smithfield | 8,834 | 5,866 | 74.4% | 17.6% | 2.1% | 0.3% |
| 44 | Galax | 6,726 | 6,132 | 76.8% | 4.9% | 14.1% | 0.3% |
| 45 | Big Stone Gap | 5,162 | 6,141 | 76.5% | 16.2% | 1.8% | 0.3% |
| 46 | Lexington | 7,525 | 6,240 | 78.2% | 5.8% | 6.3% | 3.5% |
| 47 | Staunton | 25,948 | 6,292 | 78.3% | 10.3% | 4.8% | 1.4% |
| 48 | Covington | 5,680 | 6,449 | 79.1% | 12.7% | 3.6% | 1.3% |
| 49 | Radford | 16,726 | 6,666 | 80.9% | 9.2% | 4.4% | 2.4% |
| 50 | Bridgewater | 6,708 | 6,736 | 81.5% | 4.2% | 8.2% | 1.2% |
| 51 | Salem | 25,618 | 6,759 | 81.6% | 8.7% | 4.8% | 2.0% |
| 52 | Christiansburg | 22,720 | 6,897 | 82.6% | 5.9% | 4.2% | 3.5% |
| 53 | Marion | 5,670 | 7,111 | 83.8% | 6.8% | 4.3% | 0.0% |
| 54 | Bristol | 16,849 | 7,199 | 84.5% | 5.8% | 2.8% | 0.5% |
| 55 | Strasburg | 7,214 | 7,226 | 84.6% | 5.7% | 4.9% | 1.1% |
| 56 | Buena Vista | 6,593 | 7,278 | 84.7% | 2.0% | 0.2% | 0.9% |
| 57 | Pulaski | 8,893 | 7,304 | 85.1% | 4.3% | 3.3% | 0.7% |
| 58 | Poquoson | 12,639 | 7,667 | 87.3% | 1.9% | 4.2% | 1.7% |
| 59 | Wytheville | 8,202 | 7,971 | 89.1% | 3.3% | 2.8% | 2.5% |
| 60 | Vinton | 8,056 | 8,199 | 90.4% | 1.6% | 3.5% | 1.1% |
| 61 | Abingdon | 8,330 | 8,244 | 90.7% | 4.0% | 1.8% | 1.9% |
| 62 | Richlands | 5,171 | 9,526 | 97.6% | 0.1% | 0.0% | 1.9% |
Source: U.S. Census ACS 2020-2024. 62 cities with more than 5,000 residents.
Summary
Summary: Diversity Across Virginia
If you’re looking for a scientific breakdown of diversity across Virginia, this is an accurate list.
The most diverse cities in Virginia are Dumfries, Herndon, Manassas Park, Manassas, Alexandria, Newport News, Culpeper, Norfolk, Fairfax, and Richmond. Not sold on Virginia? Take the two-minute Find Your Place quiz and see which state actually fits you.
Questions and answers
Most Diverse Cities In Virginia FAQs
What is the most diverse city in Virginia?
Dumfries is the most diverse city in Virginia for 2026, posting the lowest diversity index (2,618) of the 62 places we measured. Herndon and Manassas Park are next.
What are the 10 most diverse cities in Virginia?
The ten most diverse cities in Virginia are Dumfries, Herndon, Manassas Park, Manassas, Alexandria, Newport News, Culpeper, Norfolk, Fairfax, and Richmond. We ranked all 62 places with more than 5,000 residents by their racial-diversity HHI.
How do you measure diversity?
We use a Herfindahl-Hirschman Index (HHI) across each city’s White, Black, Hispanic, and Asian population shares from the Census American Community Survey. A lower score means the mix is more even, so the lowest HHI wins.
What is the least diverse city in Virginia?
Richlands is the least diverse city in Virginia, with a diversity index of 9,526. That means one group makes up most of its population.
Where does this data come from?
All population shares come from the Census Bureau’s American Community Survey (2020-2024). Diversity scores in Virginia range from 2,618 in Dumfries to 9,526 in Richlands.


