
Before you decide to relocate to Alabama, it’s important to research the exact cost of living around the state. And that’s what we’re going to help you do.
These are the places in Alabama that cost a pretty penny — the most expensive cities in the state.
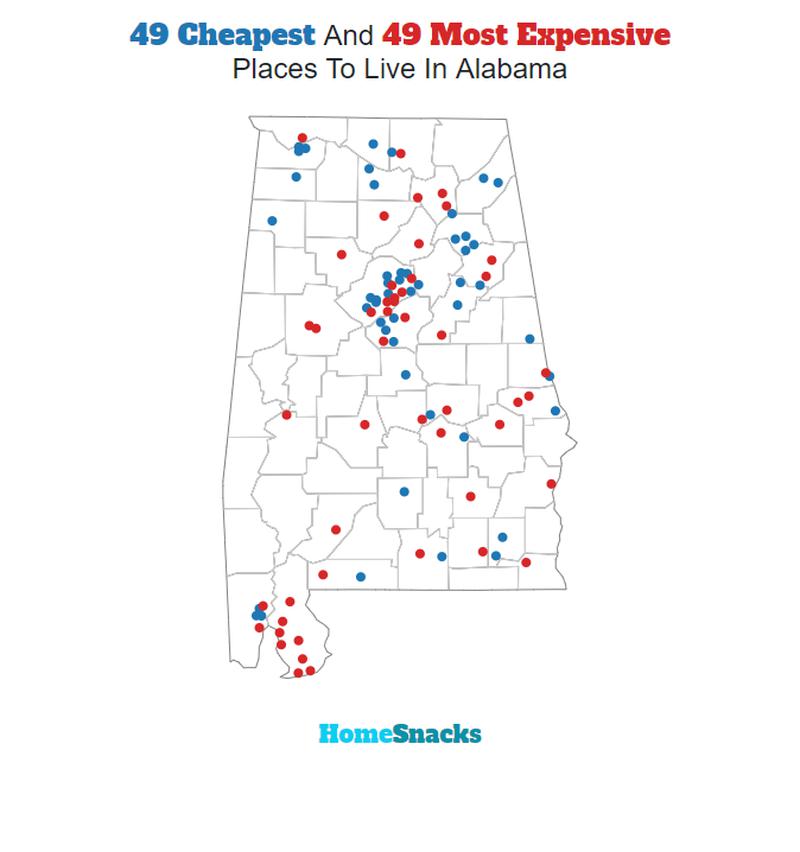
We used Saturday Night Science to compare the 2020-2024 American Community Survey on cost of living for the 105 places in Alabama with more than 5,000 people.
After we saved up for months and could finally afford it, we landed on this list of the ten most expensive cities in Alabama for 2026.
Table Of Contents: Top Ten | Methodology | Summary | Table
The 10 Most Expensive Places To Live In Alabama For 2026
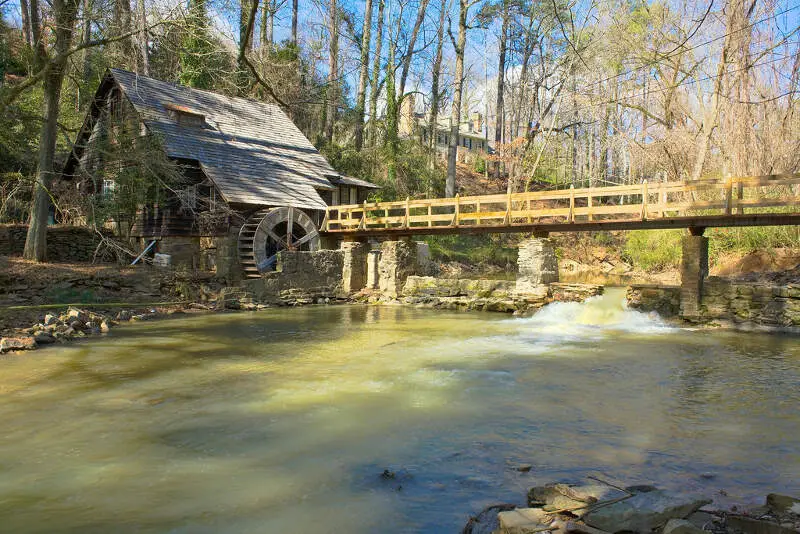
What’s the most expensive place to live in Alabama? Well, HomeSnacks crunched the numbers and discovered that Mountain Brook is the most expensive place to live in Alabama.
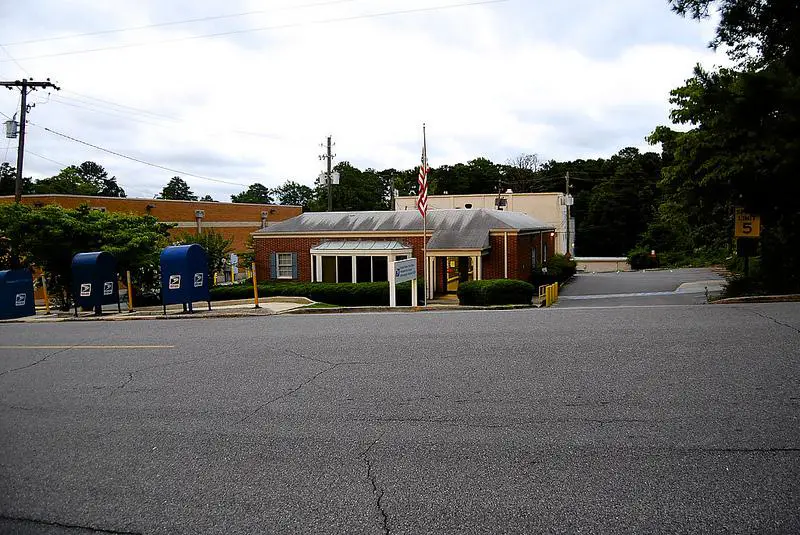
Tuskegee (the cheapest place to live in Alabama) can show these guys how to live on a budget in the coming years. Read on for how these places had costs rise faster than inflation.
And if you already knew these places were expensive, check out some more reading about Alabama and the most expensive cities in the country:
The 10 Most Expensive Places To Live In Alabama For 2026

/10
Population: 22,029
Cost Of Living Index: 162
Median Income: $201,479
Average Home Price: $1,028,341
Home Price To Income Ratio: 5.1x
More on Mountain Brook: Data | Crime | Cost Of Living | Movers
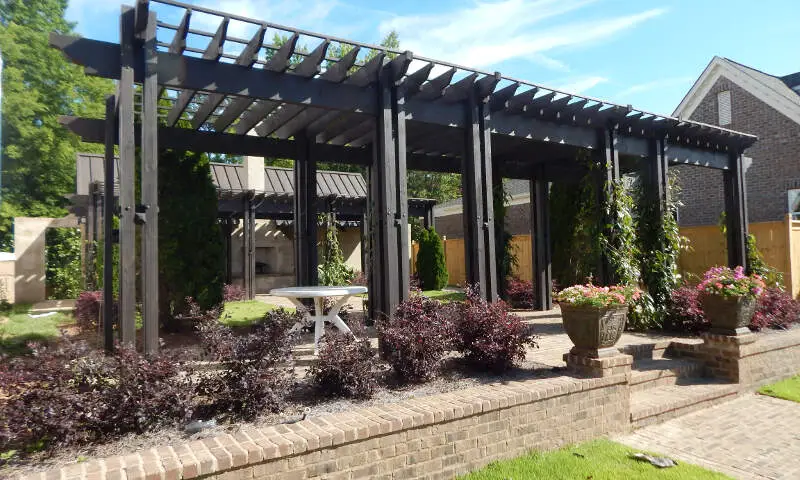
The overall cost of living in Mountain Brook is 162. The median income in Mountain Brook comes in at $201,479 and the average home value is $1,028,341 for 2026.

/10
Population: 38,616
Cost Of Living Index: 125
Median Income: $134,369
Average Home Price: $561,212
Home Price To Income Ratio: 4.2x
More on Vestavia Hills: Data | Crime | Cost Of Living | Movers
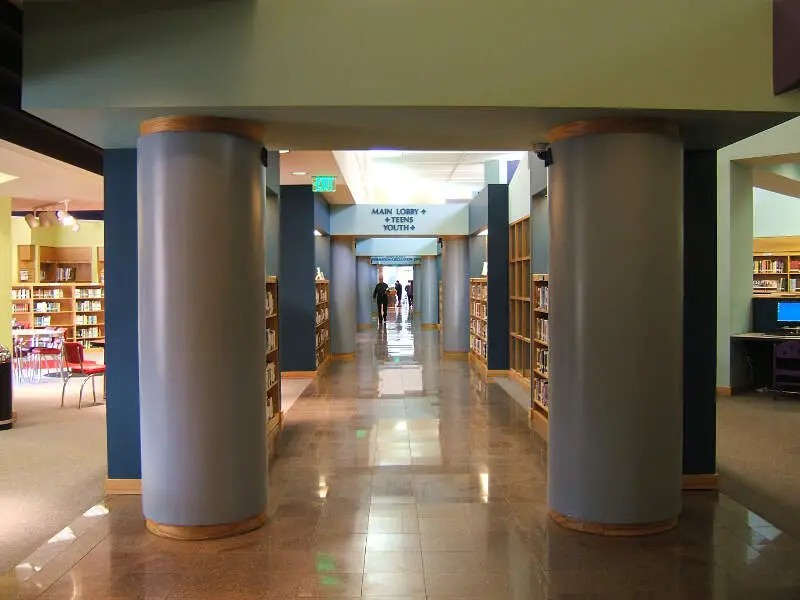
The overall cost of living in Vestavia Hills is 125. The median income in Vestavia Hills comes in at $134,369 and the average home value is $561,212 for 2026.

/10
Population: 27,829
Cost Of Living Index: 124
Median Income: $94,485
Average Home Price: $558,046
Home Price To Income Ratio: 5.9x
More on Homewood: Data | Cost Of Living | Movers
The overall cost of living in Homewood is 124. The median income in Homewood comes in at $94,485 and the average home value is $558,046 for 2026.

/10
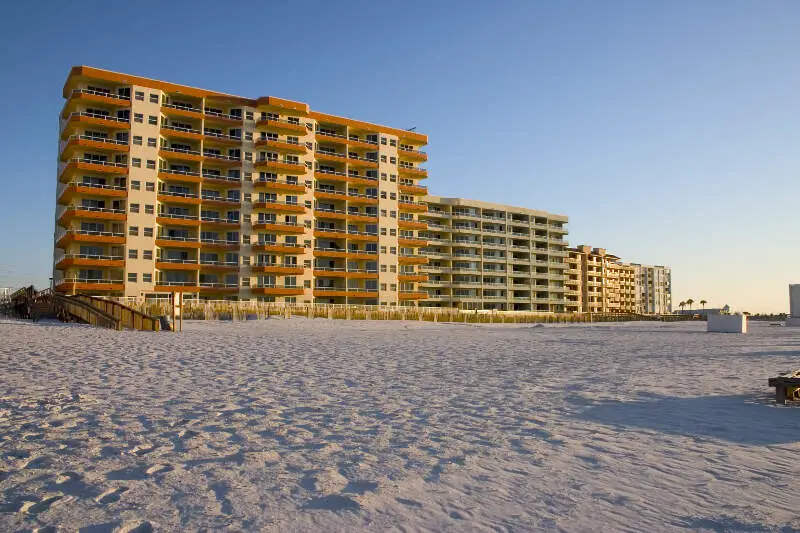
Population: 8,407
Cost Of Living Index: 124
Median Income: $97,736
Average Home Price: $678,808
Home Price To Income Ratio: 6.9x
More on Orange Beach: Data | Crime | Cost Of Living | Movers
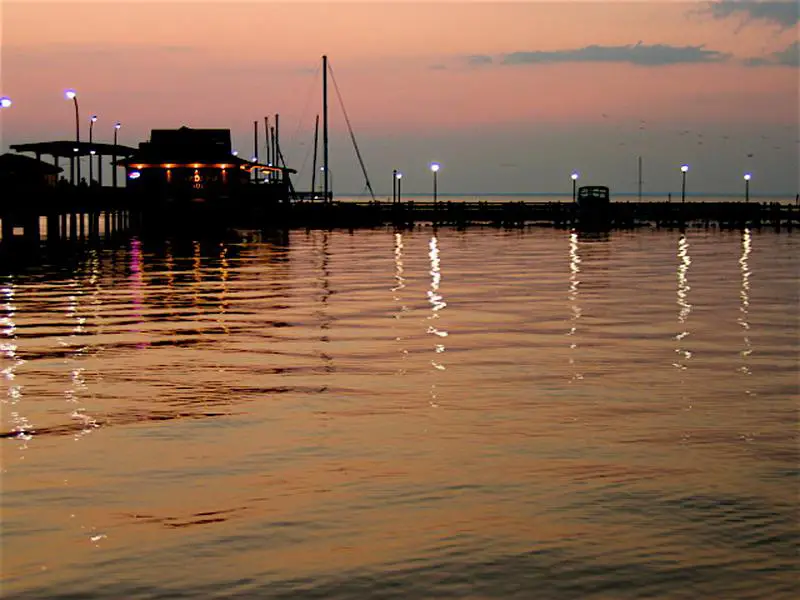
The overall cost of living in Orange Beach is 124. The median income in Orange Beach comes in at $97,736 and the average home value is $678,808 for 2026.

/10
Population: 24,190
Cost Of Living Index: 119
Median Income: $94,274
Average Home Price: $459,929
Home Price To Income Ratio: 4.9x
More on Fairhope: Data | Crime | Cost Of Living | Movers
The overall cost of living in Fairhope is 119. The median income in Fairhope comes in at $94,274 and the average home value is $459,929 for 2026.

/10
Population: 26,673
Cost Of Living Index: 112
Median Income: $123,275
Average Home Price: $394,833
Home Price To Income Ratio: 3.2x
More on Trussville: Data | Crime | Cost Of Living | Movers
The overall cost of living in Trussville is 112. The median income in Trussville comes in at $123,275 and the average home value is $394,833 for 2026.

/10
Population: 16,401
Cost Of Living Index: 112
Median Income: $78,188
Average Home Price: $450,266
Home Price To Income Ratio: 5.8x
More on Gulf Shores: Data | Cost Of Living | Movers
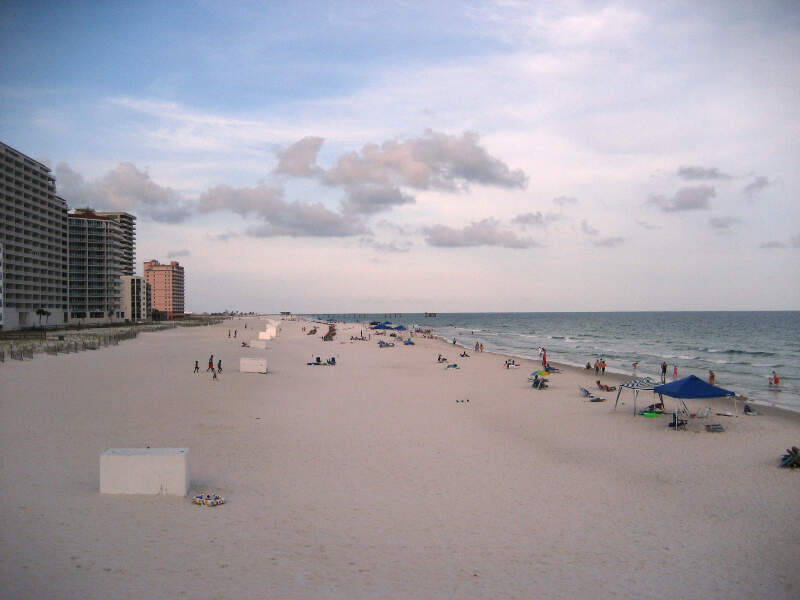
The overall cost of living in Gulf Shores is 112. The median income in Gulf Shores comes in at $78,188 and the average home value is $450,266 for 2026.

/10
Population: 92,642
Cost Of Living Index: 109
Median Income: $109,253
Average Home Price: $437,227
Home Price To Income Ratio: 4.0x
More on Hoover: Data | Crime | Cost Of Living | Movers
The overall cost of living in Hoover is 109. The median income in Hoover comes in at $109,253 and the average home value is $437,227 for 2026.

/10
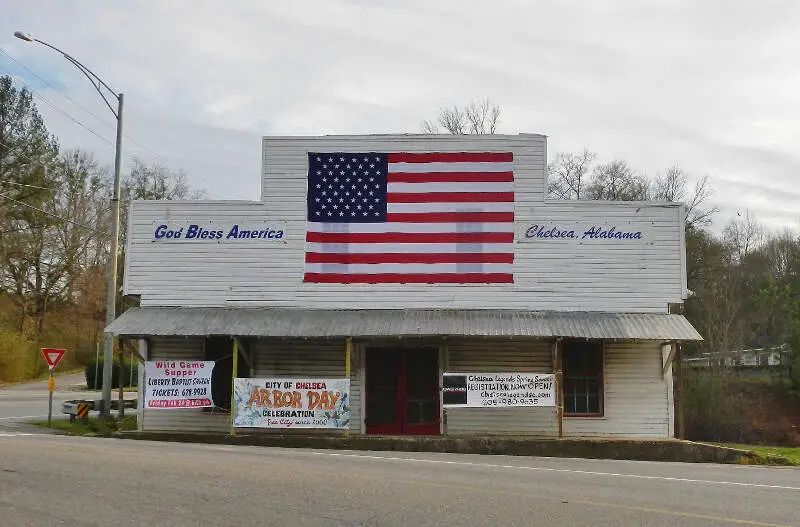
Population: 16,260
Cost Of Living Index: 107
Median Income: $115,337
Average Home Price: $384,777
Home Price To Income Ratio: 3.3x
More on Chelsea: Data | Cost Of Living | Movers
The overall cost of living in Chelsea is 107. The median income in Chelsea comes in at $115,337 and the average home value is $384,777 for 2026.

/10
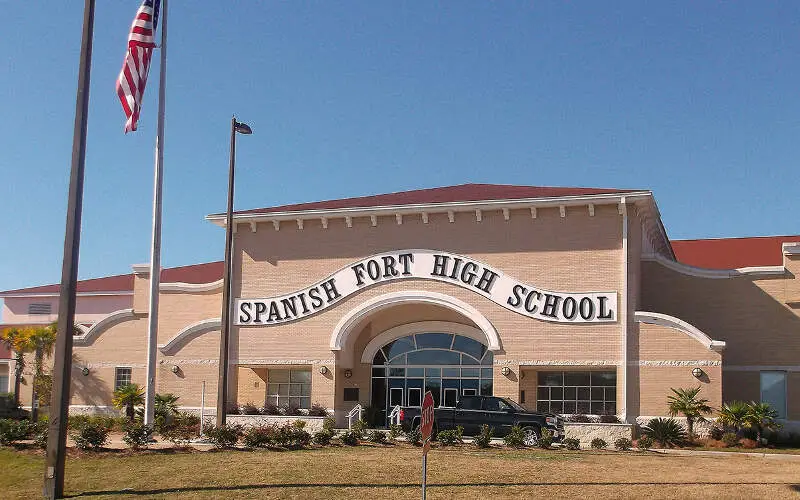
Population: 10,662
Cost Of Living Index: 106
Median Income: $99,346
Average Home Price: $379,955
Home Price To Income Ratio: 3.8x
More on Spanish Fort: Data | Cost Of Living | Movers
The overall cost of living in Spanish Fort is 106. The median income in Spanish Fort comes in at $99,346 and the average home value is $379,955 for 2026.
Methodology: How We Determined The Most Expensive Places To Live In The Heart of Dixie For 2026
The two most important things to think about when it comes to being able to afford a city in Alabama are:
- How much money do I make?
- How much do I have to spend to live there?
You need to understand your costs in the context of how much money you make.
For example, if the median household earns $100,000 and spends $40,000 on housing, it’s actually cheaper to live there than a place with a median income of $50,000 and housing costs of $21,000. You might spend more on housing, but you have more money overall to play with.
With that example in mind, we derived several statistics from the latest Census American Community Survey 2020-2024 around incomes and costs. They are:
- Overall Cost Of Living Index
- Median Home Price / Median Income (lower is better)
- Median Income / Median Rent (Higher is better)
- Median Home Price
You can then compare these metrics in each of the places in Alabama to figure out which is the most expensive.
You are left with a “Cost of Living Index” by taking the average rank of each of these metrics for each city.
So we used that cost of living index to rank all of the 105 places in Alabama that have more than 5,000 people.
The place with the highest cost of living in Alabama according to the data is Mountain Brook. We updated this article for 2026. This article is our eleventh time ranking the most expensive places to live in Alabama.
Summary: Taking A Chunk Out Of Your Paycheck In Alabama For 2026
Well, there you have it, the places in Alabama that have the highest cost of living, with Mountain Brook ranking as the most expensive city in the Heart of Dixie.
The most expensive cities in Alabama are Mountain Brook, Vestavia Hills, Homewood, Orange Beach, Fairhope, Trussville, Gulf Shores, Hoover, Chelsea, and Spanish Fort.
Here’s a look at the most affordable cities in Alabama according to the data:
- Tuskegee
- Prichard
- Talladega
For more Alabama reading, check out:
- Best Places To Live In Alabama
- Cheapest Places To Live In Alabama
- Most Dangerous Cities In Alabama
- Best Places To Raise A Family In Alabama
- Safest Places In Alabama
- Worst Places To Live In Alabama
Most Expensive Cities In Alabama
| Rank | City | Cost Of Living | Population | Median Income | Average Home Price | Home/Income Ratio |
|---|---|---|---|---|---|---|
| 1 | Mountain Brook | 162 | 22,029 | $201,479 | $1,028,341 | 5.1x |
| 2 | Vestavia Hills | 125 | 38,616 | $134,369 | $561,212 | 4.2x |
| 3 | Homewood | 124 | 27,829 | $94,485 | $558,046 | 5.9x |
| 4 | Orange Beach | 124 | 8,407 | $97,736 | $678,808 | 6.9x |
| 5 | Fairhope | 119 | 24,190 | $94,274 | $459,929 | 4.9x |
| 6 | Trussville | 112 | 26,673 | $123,275 | $394,833 | 3.2x |
| 7 | Gulf Shores | 112 | 16,401 | $78,188 | $450,266 | 5.8x |
| 8 | Hoover | 109 | 92,642 | $109,253 | $437,227 | 4.0x |
| 9 | Chelsea | 107 | 16,260 | $115,337 | $384,777 | 3.3x |
| 10 | Spanish Fort | 106 | 10,662 | $99,346 | $379,955 | 3.8x |
| 11 | Springville | 106 | 5,081 | $84,231 | $321,266 | 3.8x |
| 12 | Madison | 105 | 60,106 | $134,655 | $374,497 | 2.8x |
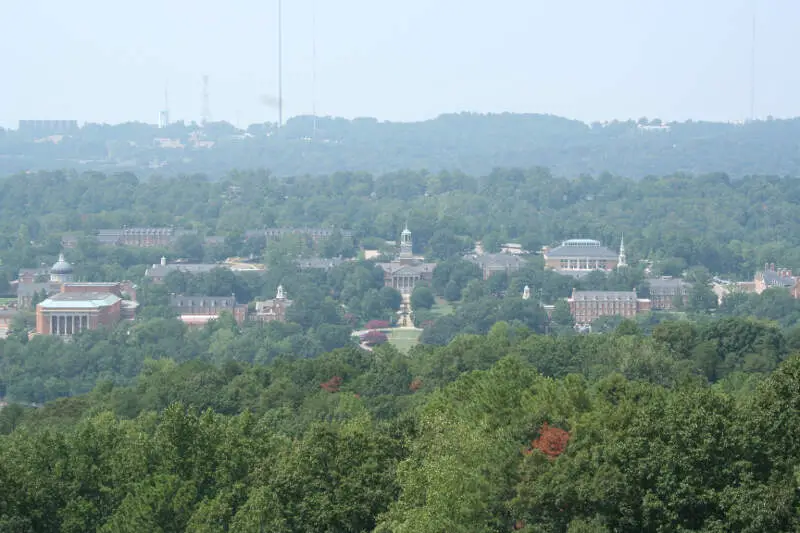
| 13 | Auburn | 104 | 80,594 | $63,668 | $412,907 | 6.5x |
| 14 | Foley | 104 | 24,026 | $66,336 | $301,569 | 4.5x |
| 15 | Daphne | 102 | 29,453 | $87,250 | $326,736 | 3.7x |
| 16 | Helena | 102 | 21,769 | $115,139 | $363,042 | 3.2x |
| 17 | Alabaster | 100 | 33,917 | $91,357 | $303,749 | 3.3x |
| 18 | Pelham | 100 | 24,827 | $101,094 | $323,686 | 3.2x |
| 19 | Gardendale | 100 | 16,534 | $82,192 | $266,522 | 3.2x |
| 20 | Prattville | 99 | 39,482 | $81,337 | $262,195 | 3.2x |
| 21 | Tuscaloosa | 98 | 111,038 | $51,464 | $228,947 | 4.4x |
| 22 | Calera | 98 | 17,714 | $87,194 | $254,700 | 2.9x |
| 23 | Pell City | 98 | 13,587 | $68,638 | $276,450 | 4.0x |
| 24 | Northport | 97 | 31,218 | $80,913 | $266,846 | 3.3x |
| 25 | Clay | 97 | 10,273 | $81,920 | $250,060 | 3.1x |
| 26 | Fultondale | 97 | 9,384 | $73,575 | $228,867 | 3.1x |
| 27 | Satsuma | 97 | 6,822 | $101,042 | $237,698 | 2.4x |
| 28 | Huntsville | 96 | 222,791 | $74,714 | $287,569 | 3.8x |
| 29 | Irondale | 96 | 13,464 | $72,343 | $289,626 | 4.0x |
| 30 | Pleasant Grove | 96 | 9,442 | $70,317 | $225,144 | 3.2x |
| 31 | Guntersville | 96 | 8,916 | $67,929 | $301,984 | 4.4x |
| 32 | Enterprise | 95 | 29,505 | $73,125 | $202,764 | 2.8x |
| 33 | Athens | 95 | 29,002 | $69,922 | $307,880 | 4.4x |
| 34 | Leeds | 95 | 12,028 | $69,737 | $249,222 | 3.6x |
| 35 | Moody | 94 | 13,488 | $86,627 | $259,874 | 3.0x |
| 36 | Rainbow City | 94 | 10,284 | $56,398 | $247,414 | 4.4x |
| 37 | Pinson | 94 | 7,832 | $76,410 | $216,703 | 2.8x |
| 38 | Oxford | 93 | 22,063 | $74,268 | $195,937 | 2.6x |
| 39 | Troy | 93 | 17,716 | $50,717 | $181,784 | 3.6x |
| 40 | Millbrook | 93 | 17,189 | $70,313 | $218,705 | 3.1x |
| 41 | Lincoln | 93 | 7,305 | $57,145 | $229,657 | 4.0x |
| 42 | Semmes | 93 | 5,626 | $66,417 | $238,189 | 3.6x |
| 43 | Smiths Station | 93 | 5,496 | $64,669 | $280,274 | 4.3x |
| 44 | Glencoe | 93 | 5,353 | $68,517 | $207,534 | 3.0x |
| 45 | Southside | 92 | 9,483 | $76,487 | $269,900 | 3.5x |
| 46 | Montevallo | 92 | 7,556 | $56,626 | $248,376 | 4.4x |
| 47 | Wetumpka | 92 | 7,437 | $57,763 | $278,367 | 4.8x |
| 48 | Monroeville | 92 | 5,802 | $32,513 | $139,433 | 4.3x |
| 49 | Headland | 92 | 5,217 | $79,063 | $224,991 | 2.8x |
| 50 | Dothan | 91 | 71,514 | $55,792 | $203,928 | 3.7x |
| 51 | Saraland | 91 | 16,404 | $61,509 | $233,993 | 3.8x |
| 52 | Hartselle | 91 | 15,847 | $76,290 | $246,208 | 3.2x |
| 53 | Jasper | 91 | 14,442 | $66,238 | $168,863 | 2.5x |
| 54 | Robertsdale | 91 | 7,194 | $59,152 | $267,052 | 4.5x |
| 55 | Mobile | 90 | 203,416 | $53,558 | $194,563 | 3.6x |
| 56 | Birmingham | 90 | 198,173 | $46,051 | $135,870 | 3.0x |
| 57 | Opelika | 90 | 32,820 | $65,004 | $304,313 | 4.7x |
| 58 | Cullman | 90 | 19,319 | $61,224 | $261,636 | 4.3x |
| 59 | Muscle Shoals | 90 | 16,951 | $75,894 | $260,072 | 3.4x |
| 60 | Fort Payne | 90 | 14,927 | $47,479 | $203,034 | 4.3x |
| 61 | Clanton | 90 | 8,958 | $47,520 | $217,128 | 4.6x |
| 62 | Atmore | 90 | 8,334 | $38,862 | $154,609 | 4.0x |
| 63 | Rainsville | 90 | 5,702 | $74,046 | $227,372 | 3.1x |
| 64 | Montgomery | 89 | 197,494 | $56,811 | $151,228 | 2.7x |
| 65 | Anniston | 89 | 21,271 | $46,668 | $147,195 | 3.2x |
| 66 | Jacksonville | 89 | 14,437 | $51,814 | $211,263 | 4.1x |
| 67 | Arab | 89 | 8,679 | $64,333 | $241,411 | 3.8x |
| 68 | Oneonta | 89 | 6,971 | $53,980 | $213,539 | 4.0x |
| 69 | Demopolis | 89 | 6,908 | $34,802 | $152,100 | 4.4x |
| 70 | Roanoke | 89 | 5,336 | $47,105 | $148,369 | 3.1x |
| 71 | Brewton | 89 | 5,186 | $50,721 | $149,231 | 2.9x |
| 72 | Florence | 88 | 41,701 | $52,174 | $210,214 | 4.0x |
| 73 | Phenix City | 88 | 38,499 | $50,053 | $207,715 | 4.1x |
| 74 | Albertville | 88 | 22,813 | $56,099 | $214,034 | 3.8x |
| 75 | Center Point | 88 | 15,914 | $56,417 | $152,329 | 2.7x |
| 76 | Ozark | 88 | 14,327 | $48,944 | $143,765 | 2.9x |
| 77 | Eufaula | 88 | 12,584 | $47,392 | $163,743 | 3.5x |
| 78 | Valley | 88 | 10,277 | $51,661 | $177,525 | 3.4x |
| 79 | Greenville | 88 | 7,163 | $40,822 | $116,098 | 2.8x |
| 80 | Decatur | 87 | 57,361 | $61,563 | $224,155 | 3.6x |
| 81 | Hueytown | 87 | 16,414 | $62,784 | $163,400 | 2.6x |
| 82 | Scottsboro | 87 | 15,712 | $53,929 | $213,720 | 4.0x |
| 83 | Tarrant | 87 | 5,925 | $42,070 | $77,450 | 1.8x |
| 84 | Midfield | 87 | 5,045 | $52,755 | $82,421 | 1.6x |
| 85 | Bessemer | 86 | 25,400 | $39,613 | $133,910 | 3.4x |
| 86 | Alexander City | 86 | 14,606 | $47,022 | $202,612 | 4.3x |
| 87 | Sylacauga | 86 | 12,309 | $50,017 | $166,280 | 3.3x |
| 88 | Sheffield | 86 | 9,340 | $39,733 | $133,841 | 3.4x |
| 89 | Tuscumbia | 86 | 9,115 | $59,143 | $196,274 | 3.3x |
| 90 | Bay Minette | 86 | 8,295 | $44,523 | $212,242 | 4.8x |
| 91 | Tallassee | 86 | 5,134 | $66,752 | $192,630 | 2.9x |
| 92 | Russellville | 85 | 10,799 | $58,231 | $178,141 | 3.1x |
| 93 | Fairfield | 85 | 9,728 | $48,456 | $93,495 | 1.9x |
| 94 | Andalusia | 85 | 8,766 | $42,611 | $170,024 | 4.0x |
| 95 | Chickasaw | 85 | 6,332 | $46,559 | $107,053 | 2.3x |
| 96 | Selma | 84 | 17,057 | $33,197 | $79,208 | 2.4x |
| 97 | Boaz | 84 | 10,814 | $49,846 | $209,918 | 4.2x |
| 98 | Hamilton | 84 | 6,922 | $54,871 | $172,640 | 3.1x |
| 99 | Lanett | 84 | 6,814 | $42,357 | $123,280 | 2.9x |
| 100 | Opp | 84 | 6,709 | $41,347 | $118,903 | 2.9x |