If you’re about to move to the Wolverine State but want to avoid living in an outrageously expensive city, you’re in the right place. We’ve done the research to discover which places in Michigan are the most expensive to live in.
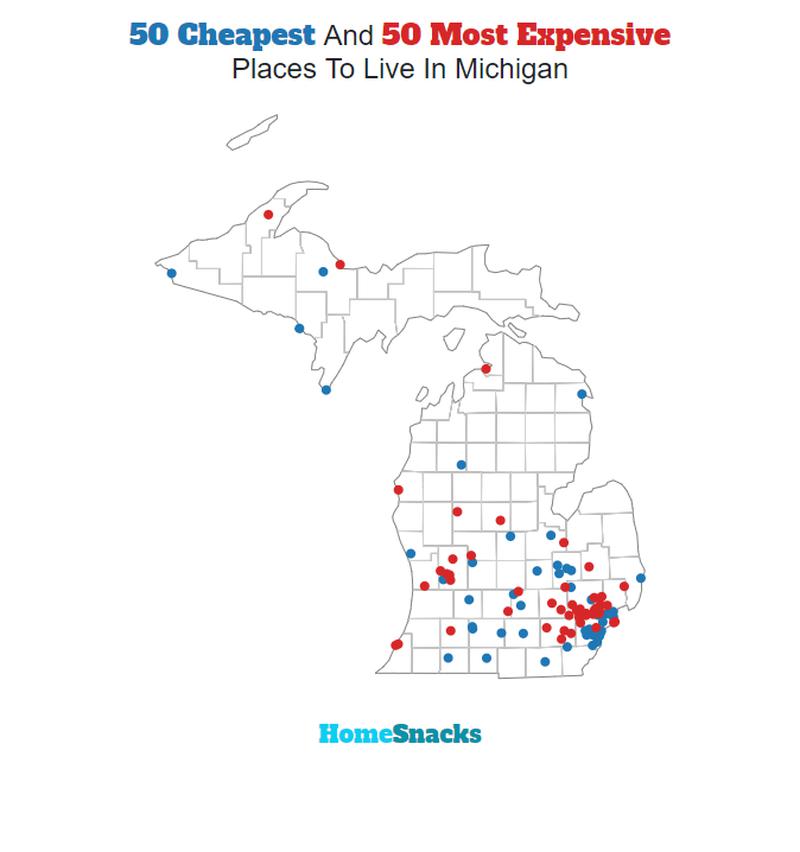
While big Michigan cities like Detroit and Grand Rapids may be the first to come to mind, they aren’t among the most expensive cities in the state. Michigan’s priciest places are distributed throughout the state.
To come up with this list, we used Saturday Night Science to narrow the analysis to the 153 cities in Michigan with populations of 5,000 or more. Then we looked at data from American Community Survey on the cost of living for each city.
Table Of Contents: Top Ten | Methodology | Summary | Table
The 10 Most Expensive Places To Live In Michigan For 2026
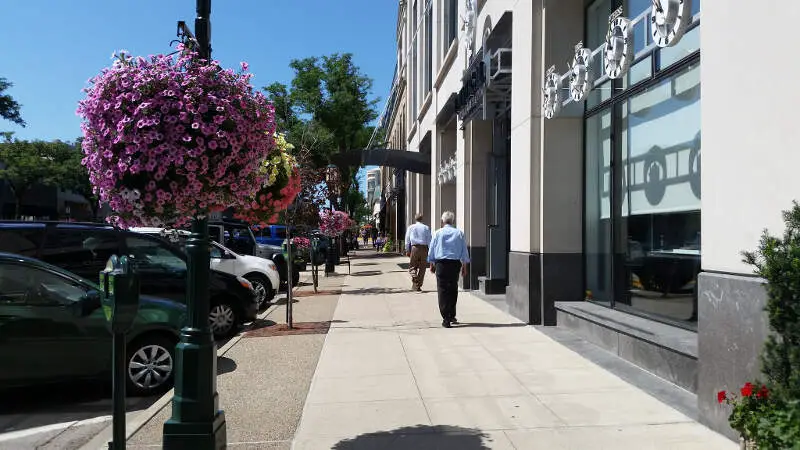
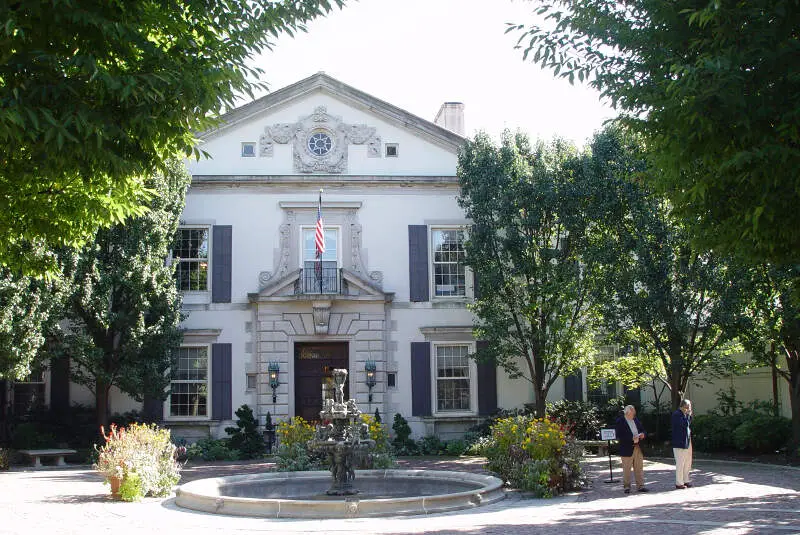
What’s the most expensive place to live in Michigan? Well, HomeSnacks crunched the numbers and discovered that Birmingham is the most expensive place to live in Michigan.
River Rouge (the cheapest place to live in Michigan) can show these guys how to live on a budget in the coming years. Read on for how these places had costs rise faster than inflation.
And if you already knew these places were expensive, check out some more reading about Michigan and the most expensive cities in the country:
The 10 Most Expensive Places To Live In Michigan For 2026

/10
Population: 21,763
Cost Of Living Index: 146
Median Income: $153,510
Average Home Price: $733,351
Home Price To Income Ratio: 4.8x
More on Birmingham: Data | Crime | Cost Of Living | Movers
The overall cost of living in Birmingham is 146. The median income in Birmingham comes in at $153,510 and the average home value is $733,351 for 2026.

/10
Population: 6,328
Cost Of Living Index: 132
Median Income: $190,150
Average Home Price: $537,207
Home Price To Income Ratio: 2.8x
More on Huntington Woods: Data | Crime | Cost Of Living | Movers
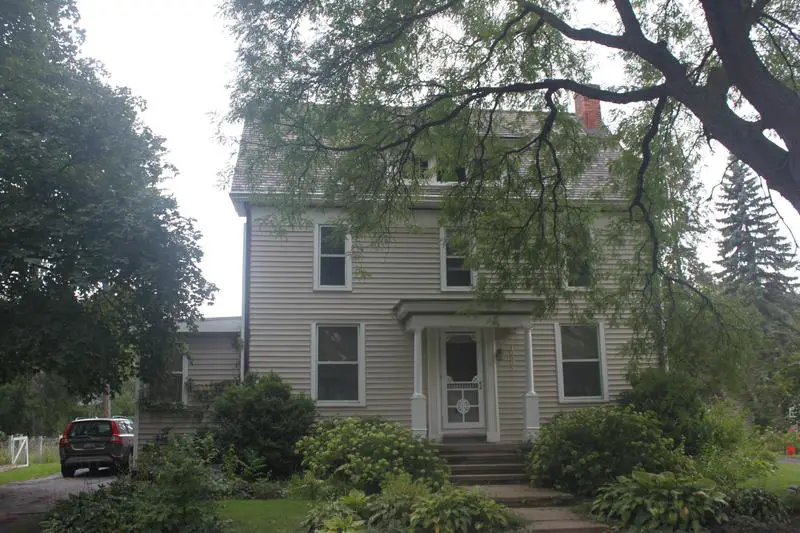
The overall cost of living in Huntington Woods is 132. The median income in Huntington Woods comes in at $190,150 and the average home value is $537,207 for 2026.

/10
Population: 10,524
Cost Of Living Index: 127
Median Income: $177,412
Average Home Price: $587,950
Home Price To Income Ratio: 3.3x
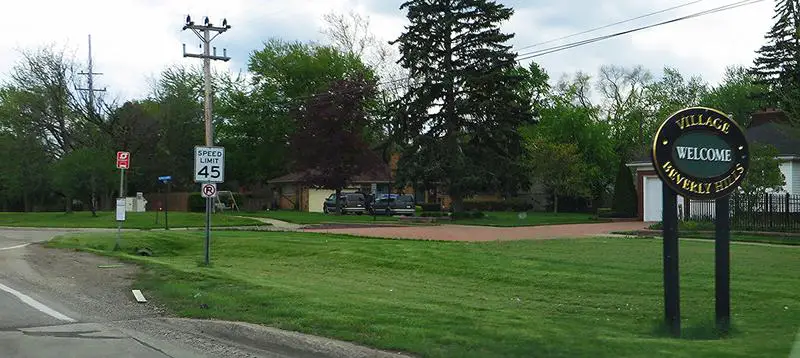
More on Beverly Hills: Data | Crime | Cost Of Living | Movers
The overall cost of living in Beverly Hills is 127. The median income in Beverly Hills comes in at $177,412 and the average home value is $587,950 for 2026.

/10
Population: 11,445
Cost Of Living Index: 125
Median Income: $166,610
Average Home Price: $664,183
Home Price To Income Ratio: 4.0x
More on East Grand Rapids: Data | Crime | Cost Of Living | Movers
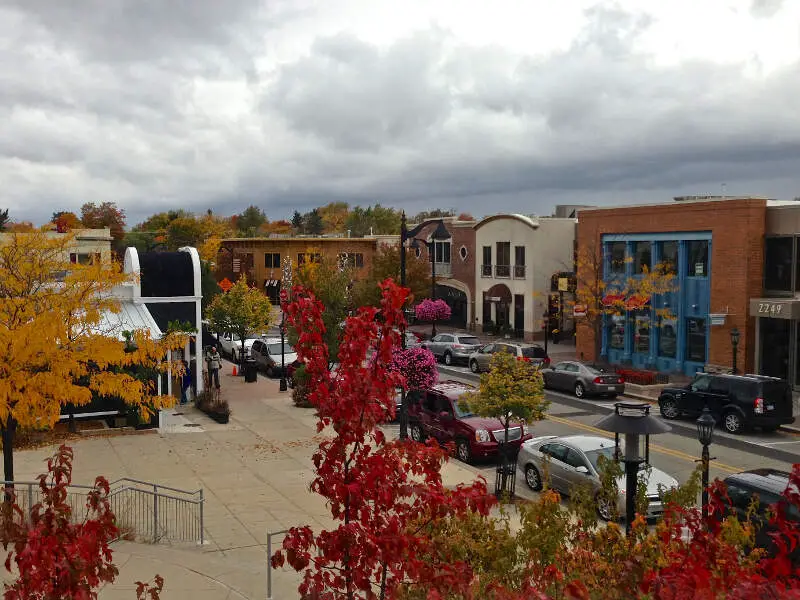
The overall cost of living in East Grand Rapids is 125. The median income in East Grand Rapids comes in at $166,610 and the average home value is $664,183 for 2026.

/10
Population: 12,934
Cost Of Living Index: 124
Median Income: $111,750
Average Home Price: $486,536
Home Price To Income Ratio: 4.4x
More on Rochester: Data | Crime | Cost Of Living | Movers
The overall cost of living in Rochester is 124. The median income in Rochester comes in at $111,750 and the average home value is $486,536 for 2026.

/10
Population: 9,904
Cost Of Living Index: 124
Median Income: $161,208
Average Home Price: $513,933
Home Price To Income Ratio: 3.2x
More on Grosse Pointe Farms: Data | Crime | Cost Of Living | Movers
The overall cost of living in Grosse Pointe Farms is 124. The median income in Grosse Pointe Farms comes in at $161,208 and the average home value is $513,933 for 2026.

/10
Population: 11,319
Cost Of Living Index: 123
Median Income: $124,111
Average Home Price: $502,194
Home Price To Income Ratio: 4.0x
More on Grosse Pointe Park: Data | Crime | Cost Of Living | Movers
The overall cost of living in Grosse Pointe Park is 123. The median income in Grosse Pointe Park comes in at $124,111 and the average home value is $502,194 for 2026.

/10
Population: 122,036
Cost Of Living Index: 122
Median Income: $82,212
Average Home Price: $523,391
Home Price To Income Ratio: 6.4x
More on Ann Arbor: Data | Crime | Cost Of Living | Movers
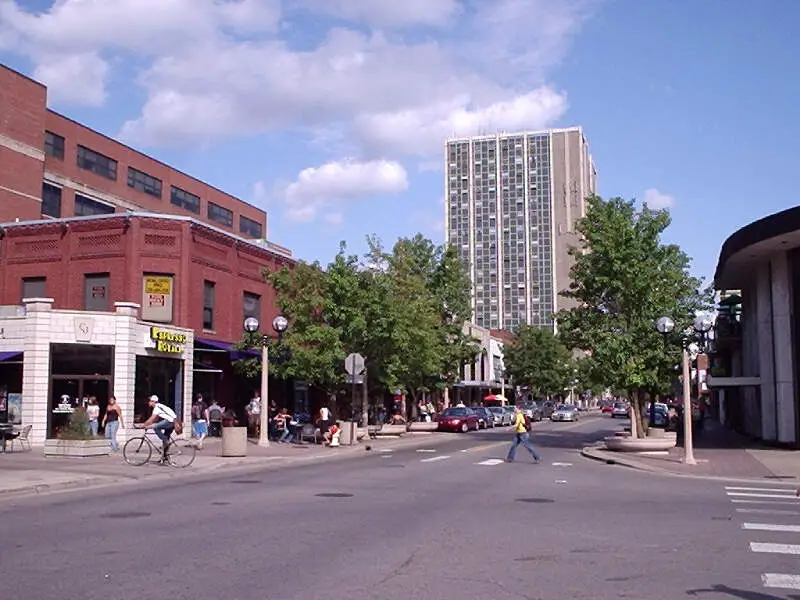
The overall cost of living in Ann Arbor is 122. The median income in Ann Arbor comes in at $82,212 and the average home value is $523,391 for 2026.
/10
Population: 5,541
Cost Of Living Index: 122
Median Income: $158,853
Average Home Price: $469,115
Home Price To Income Ratio: 3.0x
More on Grosse Pointe: Data | Crime | Cost Of Living | Movers
The overall cost of living in Grosse Pointe is 122. The median income in Grosse Pointe comes in at $158,853 and the average home value is $469,115 for 2026.

/10
Population: 77,089
Cost Of Living Index: 118
Median Income: $120,694
Average Home Price: $465,253
Home Price To Income Ratio: 3.9x
More on Rochester Hills: Data | Crime | Cost Of Living | Movers
The overall cost of living in Rochester Hills is 118. The median income in Rochester Hills comes in at $120,694 and the average home value is $465,253 for 2026.
Methodology: How We Determined The Most Expensive Places To Live In The Wolverine State For 2026
The two most important things to think about when it comes to being able to afford a city in Michigan are:
- How much money do I make?
- How much do I have to spend to live there?
You need to understand your costs in the context of how much money you make.
For example, if the median household earns $100,000 and spends $40,000 on housing, it’s actually cheaper to live there than a place with a median income of $50,000 and housing costs of $21,000. You might spend more on housing, but you have more money overall to play with.
With that example in mind, we derived several statistics from the latest Census American Community Survey 2020-2024 around incomes and costs. They are:
- Overall Cost Of Living Index
- Median Home Price / Median Income (lower is better)
- Median Income / Median Rent (Higher is better)
- Median Home Price
You can then compare these metrics in each of the places in Michigan to figure out which is the most expensive.
You are left with a “Cost of Living Index” by taking the average rank of each of these metrics for each city.
So we used that cost of living index to rank all of the 153 places in Michigan that have more than 5,000 people.
The place with the highest cost of living in Michigan according to the data is Birmingham. We updated this article for 2026. This article is our eleventh time ranking the most expensive places to live in Michigan.
Summary: Taking A Chunk Out Of Your Paycheck In Michigan For 2026
Well, there you have it, the places in Michigan that have the highest cost of living, with Birmingham ranking as the most expensive city in the Wolverine State.
The most expensive cities in Michigan are Birmingham, Huntington Woods, Beverly Hills, East Grand Rapids, Rochester, Grosse Pointe Farms, Grosse Pointe Park, Ann Arbor, Grosse Pointe, and Rochester Hills.
Here’s a look at the most affordable cities in Michigan according to the data:
- River Rouge
- Highland Park
- Muskegon Heights
For more Michigan reading, check out:
- Best Places To Live In Michigan
- Cheapest Places To Live In Michigan
- Most Dangerous Places in Michigan
- Best Places To Raise A Family In Michigan
- Safest Places In Michigan
- Worst Places To Live In Michigan
Most Expensive Cities In Michigan
| Rank | City | Cost Of Living | Population | Median Income | Average Home Price | Home/Income Ratio |
|---|---|---|---|---|---|---|
| 1 | Birmingham | 146 | 21,763 | $153,510 | $733,351 | 4.8x |
| 2 | Huntington Woods | 132 | 6,328 | $190,150 | $537,207 | 2.8x |
| 3 | Beverly Hills | 127 | 10,524 | $177,412 | $587,950 | 3.3x |
| 4 | East Grand Rapids | 125 | 11,445 | $166,610 | $664,183 | 4.0x |
| 5 | Rochester | 124 | 12,934 | $111,750 | $486,536 | 4.4x |
| 6 | Grosse Pointe Farms | 124 | 9,904 | $161,208 | $513,933 | 3.2x |
| 7 | Grosse Pointe Park | 123 | 11,319 | $124,111 | $502,194 | 4.0x |
| 8 | Ann Arbor | 122 | 122,036 | $82,212 | $523,391 | 6.4x |
| 9 | Grosse Pointe | 122 | 5,541 | $158,853 | $469,115 | 3.0x |
| 10 | Rochester Hills | 118 | 77,089 | $120,694 | $465,253 | 3.9x |
| 11 | Novi | 116 | 66,717 | $110,723 | $467,223 | 4.2x |
| 12 | Northville | 116 | 6,069 | $145,530 | $588,076 | 4.0x |
| 13 | Troy | 114 | 87,898 | $120,045 | $457,479 | 3.8x |
| 14 | Plymouth | 113 | 9,214 | $112,145 | $471,424 | 4.2x |
| 15 | Farmington Hills | 112 | 83,515 | $104,836 | $387,307 | 3.7x |
| 16 | Traverse City | 111 | 15,593 | $74,087 | $437,525 | 5.9x |
| 17 | Chelsea | 111 | 5,426 | $72,098 | $411,816 | 5.7x |
| 18 | Grosse Pointe Woods | 110 | 16,094 | $126,395 | $349,100 | 2.8x |
| 19 | Saline | 109 | 9,006 | $88,346 | $465,110 | 5.3x |
| 20 | Milford | 108 | 6,487 | $105,713 | $481,467 | 4.6x |
| 21 | Royal Oak | 107 | 57,950 | $101,109 | $331,358 | 3.3x |
| 22 | Berkley | 105 | 15,149 | $116,239 | $314,815 | 2.7x |
| 23 | Farmington | 105 | 11,504 | $97,750 | $327,491 | 3.4x |
| 24 | Rockford | 105 | 6,218 | $107,121 | $450,322 | 4.2x |
| 25 | Wixom | 104 | 17,295 | $65,485 | $384,491 | 5.9x |
| 26 | Brighton | 104 | 7,688 | $80,682 | $432,666 | 5.4x |
| 27 | New Baltimore | 103 | 12,072 | $106,033 | $354,732 | 3.3x |
| 28 | South Lyon | 103 | 11,950 | $92,467 | $467,291 | 5.1x |
| 29 | Sterling Heights | 102 | 133,573 | $79,909 | $306,785 | 3.8x |
| 30 | East Lansing | 102 | 45,758 | $45,687 | $311,382 | 6.8x |
| 31 | Livonia | 101 | 93,851 | $98,460 | $309,576 | 3.1x |
| 32 | Walker | 101 | 25,386 | $76,360 | $352,817 | 4.6x |
| 33 | Ferndale | 101 | 19,190 | $94,640 | $250,327 | 2.6x |
| 34 | Clawson | 101 | 11,374 | $88,636 | $286,025 | 3.2x |
| 35 | Petoskey | 101 | 5,856 | $74,196 | $472,426 | 6.4x |
| 36 | Frankenmuth | 100 | 5,157 | $85,433 | $315,290 | 3.7x |
| 37 | Southfield | 99 | 76,236 | $68,166 | $250,952 | 3.7x |
| 38 | Marquette | 99 | 21,325 | $55,613 | $323,188 | 5.8x |
| 39 | Grand Rapids | 98 | 198,535 | $69,108 | $303,297 | 4.4x |
| 40 | Holland | 98 | 34,423 | $75,865 | $364,546 | 4.8x |
| 41 | Woodhaven | 98 | 12,690 | $78,648 | $266,355 | 3.4x |
| 42 | St. Joseph | 98 | 7,986 | $84,057 | $328,306 | 3.9x |
| 43 | St. Clair | 98 | 5,585 | $69,688 | $311,687 | 4.5x |
| 44 | Dearborn | 97 | 107,423 | $65,324 | $245,068 | 3.8x |
| 45 | Norton Shores | 97 | 25,041 | $76,579 | $287,720 | 3.8x |
| 46 | Riverview | 97 | 12,186 | $73,468 | $242,241 | 3.3x |
| 47 | Milan | 97 | 5,987 | $96,949 | $303,662 | 3.1x |
| 48 | Richmond | 97 | 5,855 | $64,719 | $303,793 | 4.7x |
| 49 | Utica | 97 | 5,180 | $58,718 | $253,467 | 4.3x |
| 50 | Portage | 96 | 49,259 | $83,212 | $292,450 | 3.5x |
| 51 | Auburn Hills | 96 | 25,105 | $84,375 | $277,482 | 3.3x |
| 52 | Trenton | 96 | 18,125 | $82,212 | $239,683 | 2.9x |
| 53 | Grand Blanc | 96 | 7,987 | $68,052 | $285,256 | 4.2x |
| 54 | Zeeland | 96 | 5,665 | $52,628 | $382,236 | 7.3x |
| 55 | Warren | 95 | 137,928 | $64,016 | $196,784 | 3.1x |
| 56 | Oak Park | 95 | 29,318 | $71,510 | $232,981 | 3.3x |
| 57 | Ypsilanti | 95 | 19,857 | $46,588 | $282,886 | 6.1x |
| 58 | Fenton | 95 | 11,906 | $80,000 | $355,969 | 4.4x |
| 59 | Howell | 95 | 10,021 | $60,449 | $377,375 | 6.2x |
| 60 | Mason | 95 | 8,249 | $79,117 | $275,132 | 3.5x |
| 61 | Hudsonville | 95 | 7,769 | $91,280 | $417,203 | 4.6x |
| 62 | Walled Lake | 95 | 7,299 | $72,055 | $242,299 | 3.4x |
| 63 | Dundee | 95 | 5,744 | $78,837 | $286,248 | 3.6x |
| 64 | St. Clair Shores | 94 | 58,140 | $73,500 | $227,950 | 3.1x |
| 65 | Kentwood | 94 | 54,296 | $74,373 | $331,531 | 4.5x |
| 66 | Southgate | 94 | 29,366 | $66,118 | $192,161 | 2.9x |
| 67 | Madison Heights | 94 | 28,419 | $69,503 | $219,510 | 3.2x |
| 68 | Allen Park | 94 | 27,925 | $81,655 | $206,256 | 2.5x |
| 69 | Grandville | 94 | 16,356 | $78,442 | $353,730 | 4.5x |
| 70 | Grand Haven | 94 | 10,996 | $60,669 | $391,796 | 6.5x |
| 71 | Dearborn Heights | 93 | 61,771 | $60,391 | $212,389 | 3.5x |
| 72 | Mount Pleasant | 93 | 21,236 | $44,706 | $220,399 | 4.9x |
| 73 | Flat Rock | 93 | 10,340 | $81,585 | $257,472 | 3.2x |
| 74 | Marysville | 93 | 9,925 | $66,901 | $227,854 | 3.4x |
| 75 | Houghton | 93 | 8,474 | $43,456 | $262,334 | 6.0x |
| 76 | Grand Ledge | 93 | 7,804 | $68,980 | $296,332 | 4.3x |
| 77 | St. Johns | 93 | 7,715 | $68,728 | $286,181 | 4.2x |
| 78 | New Haven | 93 | 6,475 | $66,125 | $308,843 | 4.7x |
| 79 | Westland | 92 | 83,633 | $62,076 | $211,889 | 3.4x |
| 80 | Wyoming | 92 | 77,353 | $73,677 | $286,890 | 3.9x |
| 81 | Midland | 92 | 42,724 | $73,325 | $247,416 | 3.4x |
| 82 | Tecumseh | 92 | 8,646 | $62,835 | $254,886 | 4.1x |
| 83 | Ludington | 92 | 7,676 | $46,411 | $298,512 | 6.4x |
| 84 | Allegan | 92 | 5,172 | $52,925 | $279,562 | 5.3x |
| 85 | Harper Woods | 91 | 15,116 | $65,022 | $153,570 | 2.4x |
| 86 | Fraser | 91 | 14,583 | $64,354 | $234,791 | 3.6x |
| 87 | Marshall | 91 | 6,804 | $76,050 | $240,469 | 3.2x |
| 88 | Garden City | 90 | 26,739 | $67,294 | $200,240 | 3.0x |
| 89 | Romulus | 90 | 24,831 | $69,151 | $203,009 | 2.9x |
| 90 | Ionia | 90 | 12,753 | $63,978 | $222,836 | 3.5x |
| 91 | Charlotte | 90 | 9,277 | $62,681 | $235,060 | 3.8x |
| 92 | Holly | 90 | 5,964 | $64,305 | $320,380 | 5.0x |
| 93 | Davison | 90 | 5,076 | $48,814 | $253,626 | 5.2x |
| 94 | Port Huron | 89 | 28,620 | $50,366 | $170,018 | 3.4x |
| 95 | Hastings | 89 | 7,520 | $58,286 | $235,810 | 4.0x |
| 96 | Manistee | 89 | 6,275 | $60,541 | $257,759 | 4.3x |
| 97 | Belding | 89 | 5,960 | $60,373 | $264,511 | 4.4x |
| 98 | Swartz Creek | 89 | 5,853 | $71,571 | $245,862 | 3.4x |
| 99 | Eaton Rapids | 89 | 5,183 | $63,875 | $250,599 | 3.9x |
| 100 | Lansing | 88 | 113,023 | $54,382 | $163,359 | 3.0x |


