You won’t find Dollar General and McDonald’s dotting the landscape in Pennsylvania’s most expensive places. It’s only the best of the best for the playgrounds of Pennsylvania’s rich and famous. Many of Pennsylvania’s most expensive places are some of the state’s best.
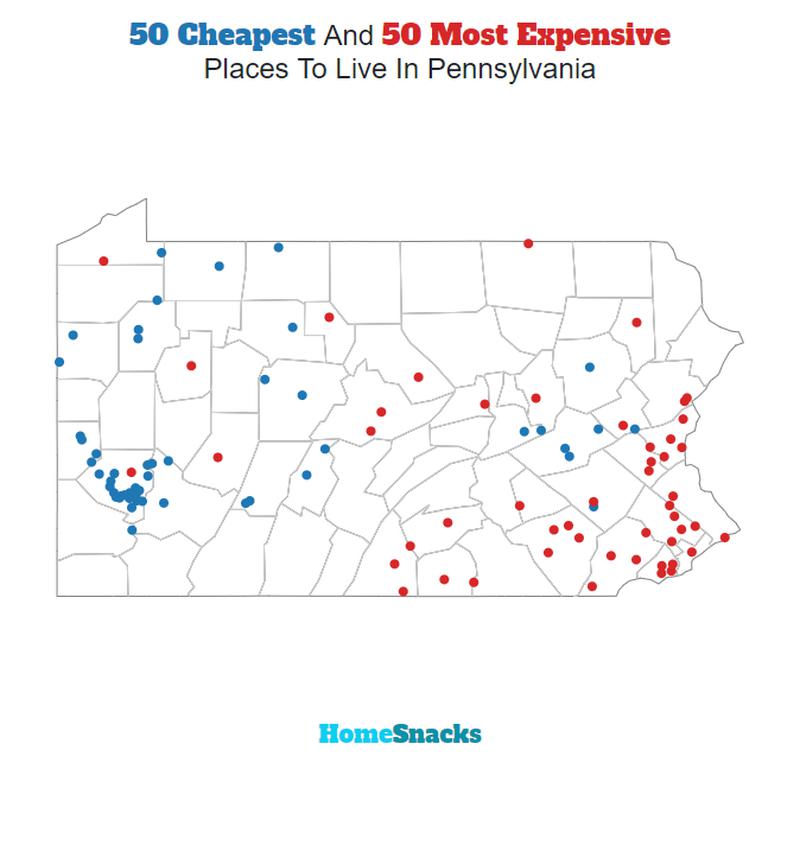
How did we calculate the list of the most expensive places in Pennsylvania? We used Saturday Night Science to compare the cost of living index for the 182 Pennsylvania places over 5,000 people. The area around Philadelphia is home to Pennsylvania’s most expensive places.
It’s going to take more than a million Hershey Kisses to keep up with the Joneses in this Mid-Atlantic state: it’s going to take at least 45,424/year.
Table Of Contents: Top Ten | Methodology | Summary | Table
The 10 Most Expensive Places To Live In Pennsylvania For 2026
What’s the most expensive place to live in Pennsylvania? Well, HomeSnacks crunched the numbers and discovered that Fox Chapel is the most expensive place to live in Pennsylvania.
Johnstown (the cheapest place to live in Pennsylvania) can show these guys how to live on a budget in the coming years. Read on for how these places had costs rise faster than inflation.
And if you already knew these places were expensive, check out some more reading about Pennsylvania and the most expensive cities in the country:
The 10 Most Expensive Places To Live In Pennsylvania For 2026

/10
Population: 5,246
Cost Of Living Index: 185
Median Income: $243,625
Average Home Price: $1,000,518
Home Price To Income Ratio: 4.1x
More on Fox Chapel: Data | Cost Of Living | Movers
The overall cost of living in Fox Chapel is 185. The median income in Fox Chapel comes in at $243,625 and the average home value is $1,000,518 for 2026.

/10
Population: 15,235
Cost Of Living Index: 133
Median Income: $176,875
Average Home Price: $539,475
Home Price To Income Ratio: 3.1x
More on Franklin Park: Data | Cost Of Living | Movers
The overall cost of living in Franklin Park is 133. The median income in Franklin Park comes in at $176,875 and the average home value is $539,475 for 2026.

/10
Population: 6,550
Cost Of Living Index: 132
Median Income: $152,361
Average Home Price: $467,860
Home Price To Income Ratio: 3.1x
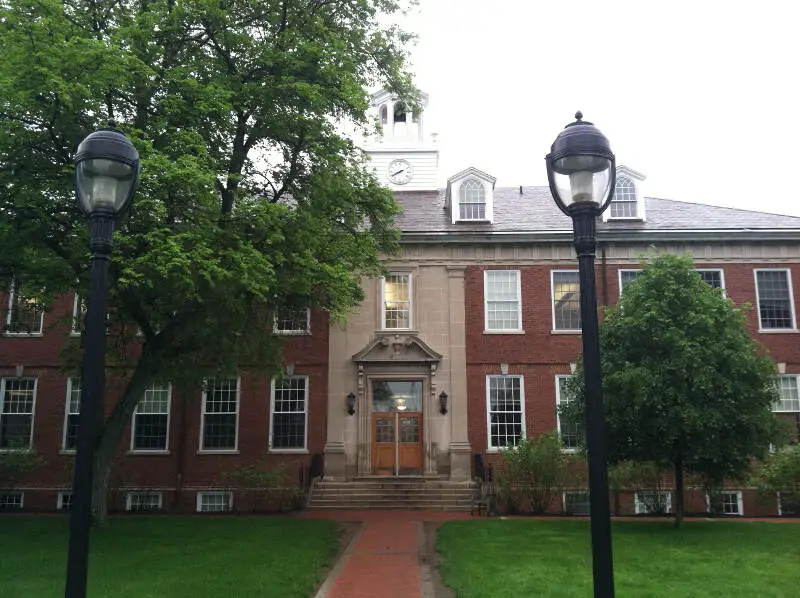
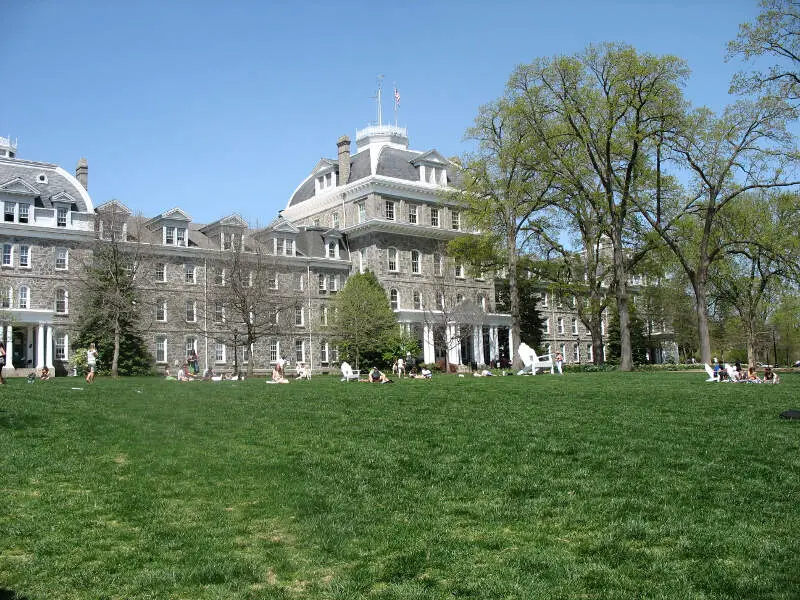
More on Swarthmore: Data | Crime | Cost Of Living | Movers
The overall cost of living in Swarthmore is 132. The median income in Swarthmore comes in at $152,361 and the average home value is $467,860 for 2026.

/10
Population: 20,666
Cost Of Living Index: 128
Median Income: $78,385
Average Home Price: $657,112
Home Price To Income Ratio: 8.4x
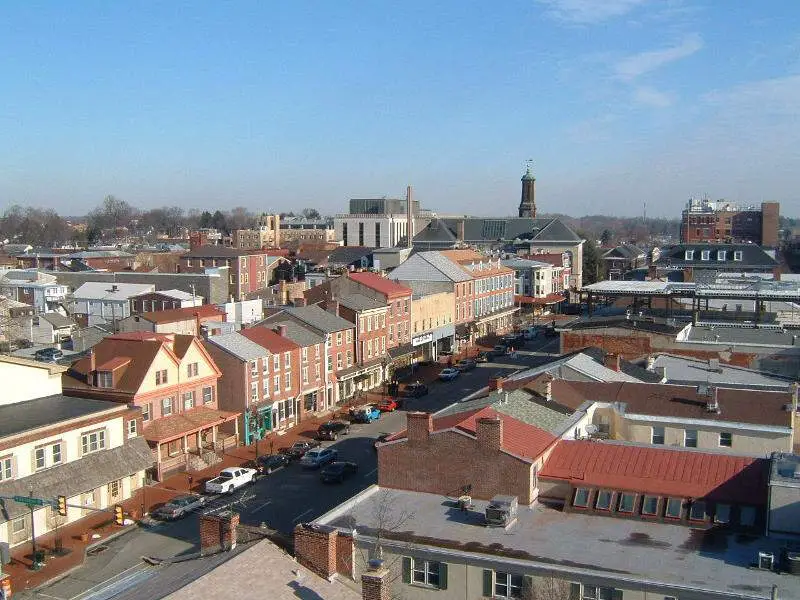
More on West Chester: Data | Cost Of Living | Movers
The overall cost of living in West Chester is 128. The median income in West Chester comes in at $78,385 and the average home value is $657,112 for 2026.

/10
Population: 9,282
Cost Of Living Index: 124
Median Income: $122,721
Average Home Price: $482,551
Home Price To Income Ratio: 3.9x
More on Conshohocken: Data | Cost Of Living | Movers
The overall cost of living in Conshohocken is 124. The median income in Conshohocken comes in at $122,721 and the average home value is $482,551 for 2026.
/10
Population: 5,870
Cost Of Living Index: 122
Median Income: $89,092
Average Home Price: $632,297
Home Price To Income Ratio: 7.1x
More on Media: Data | Cost Of Living | Movers
The overall cost of living in Media is 122. The median income in Media comes in at $89,092 and the average home value is $632,297 for 2026.
/10
Population: 5,247
Cost Of Living Index: 121
Median Income: $91,466
Average Home Price: $568,662
Home Price To Income Ratio: 6.2x
More on Collegeville: Data | Crime | Cost Of Living | Movers
The overall cost of living in Collegeville is 121. The median income in Collegeville comes in at $91,466 and the average home value is $568,662 for 2026.

/10
Population: 41,050
Cost Of Living Index: 120
Median Income: $45,424
Average Home Price: $408,500
Home Price To Income Ratio: 9.0x
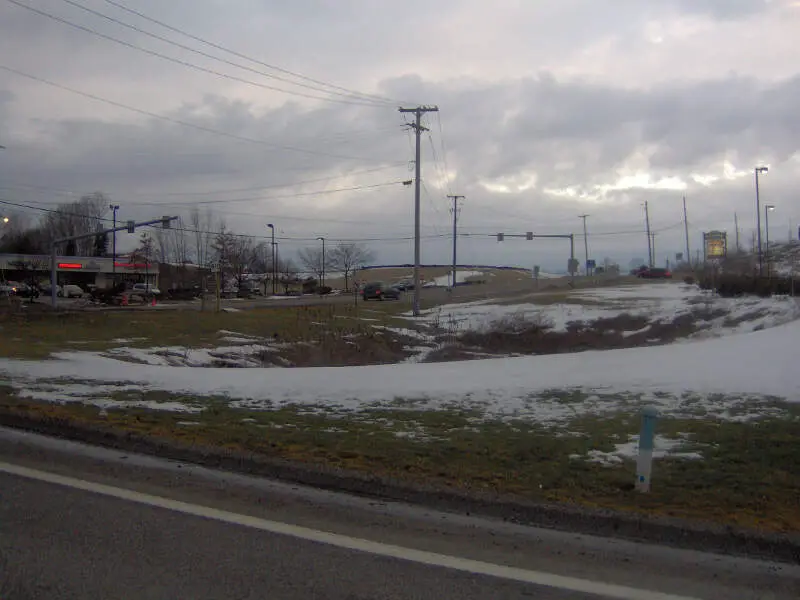
More on State College: Data | Crime | Cost Of Living | Movers
The overall cost of living in State College is 120. The median income in State College comes in at $45,424 and the average home value is $408,500 for 2026.
/10
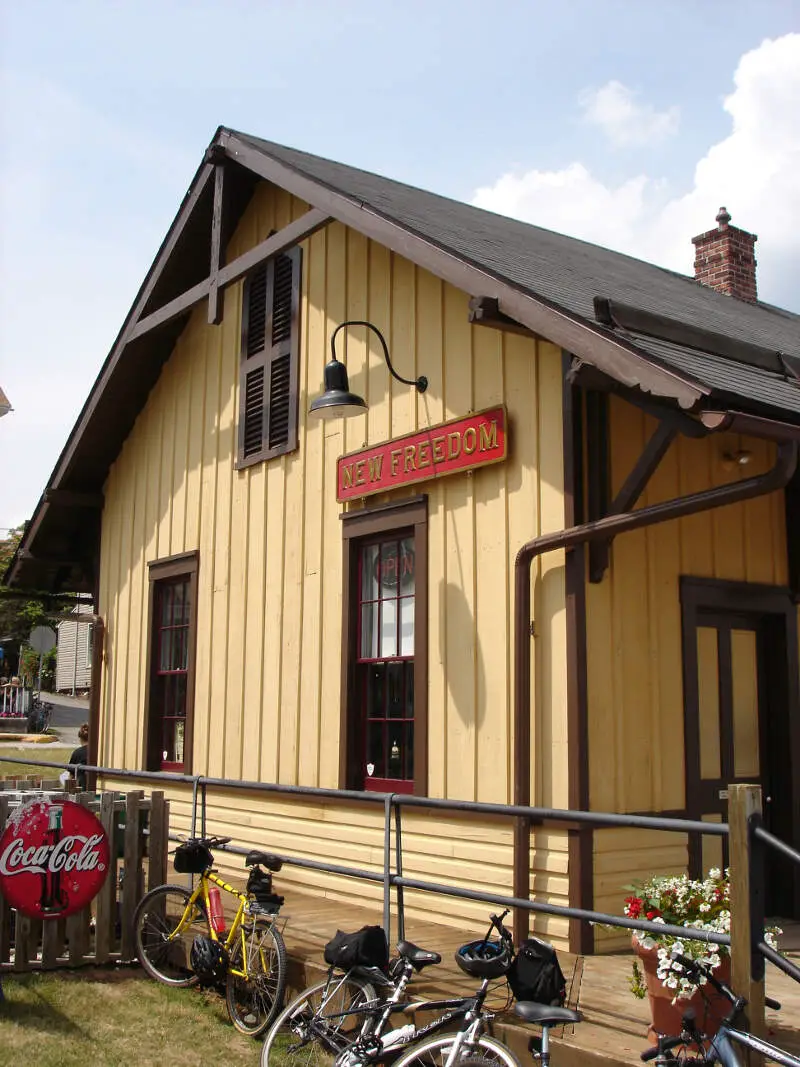
Population: 5,066
Cost Of Living Index: 119
Median Income: $120,037
Average Home Price: $417,280
Home Price To Income Ratio: 3.5x
More on New Freedom: Data | Movers
The overall cost of living in New Freedom is 119. The median income in New Freedom comes in at $120,037 and the average home value is $417,280 for 2026.

/10
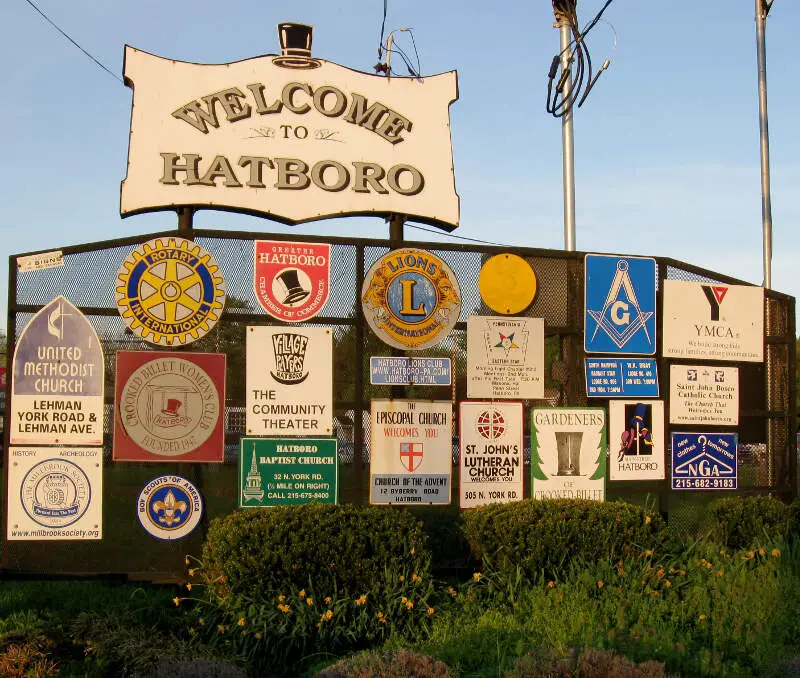
Population: 8,283
Cost Of Living Index: 117
Median Income: $112,565
Average Home Price: $440,910
Home Price To Income Ratio: 3.9x
More on Hatboro: Data | Cost Of Living | Movers
The overall cost of living in Hatboro is 117. The median income in Hatboro comes in at $112,565 and the average home value is $440,910 for 2026.
Methodology: How We Determined The Most Expensive Places To Live In The Keystone State For 2026
The two most important things to think about when it comes to being able to afford a city in Pennsylvania are:
- How much money do I make?
- How much do I have to spend to live there?
You need to understand your costs in the context of how much money you make.
For example, if the median household earns $100,000 and spends $40,000 on housing, it’s actually cheaper to live there than a place with a median income of $50,000 and housing costs of $21,000. You might spend more on housing, but you have more money overall to play with.
With that example in mind, we derived several statistics from the latest Census American Community Survey 2020-2024 around incomes and costs. They are:
- Overall Cost Of Living Index
- Median Home Price / Median Income (lower is better)
- Median Income / Median Rent (Higher is better)
- Median Home Price
You can then compare these metrics in each of the places in Pennsylvania to figure out which is the most expensive.
You are left with a “Cost of Living Index” by taking the average rank of each of these metrics for each city.
So we used that cost of living index to rank all of the 182 places in Pennsylvania that have more than 5,000 people.
The place with the highest cost of living in Pennsylvania according to the data is Fox Chapel. We updated this article for 2026. This article is our eleventh time ranking the most expensive places to live in Pennsylvania.
Summary: Taking A Chunk Out Of Your Paycheck In Pennsylvania For 2026
Well, there you have it, the places in Pennsylvania that have the highest cost of living, with Fox Chapel ranking as the most expensive city in the Keystone State.
The most expensive cities in Pennsylvania are Fox Chapel, Franklin Park, Swarthmore, West Chester, Conshohocken, Media, Collegeville, State College, New Freedom, and Hatboro.
Here’s a look at the most affordable cities in Pennsylvania according to the data:
- Johnstown
- New Castle
- Sharon
For more Pennsylvania reading, check out:
- Best Places To Live In Pennsylvania
- Cheapest Places To Live In Pennsylvania
- Most Dangerous Cities In Pennsylvania
- Best Places To Raise A Family In Pennsylvania
- Safest Places In Pennsylvania
- Worst Places To Live In Pennsylvania
Most Expensive Cities In Pennsylvania
| Rank | City | Cost Of Living | Population | Median Income | Average Home Price | Home/Income Ratio |
|---|---|---|---|---|---|---|
| 1 | Fox Chapel | 185 | 5,246 | $243,625 | $1,000,518 | 4.1x |
| 2 | Franklin Park | 133 | 15,235 | $176,875 | $539,475 | 3.1x |
| 3 | Swarthmore | 132 | 6,550 | $152,361 | $467,860 | 3.1x |
| 4 | West Chester | 128 | 20,666 | $78,385 | $657,112 | 8.4x |
| 5 | Conshohocken | 124 | 9,282 | $122,721 | $482,551 | 3.9x |
| 6 | Media | 122 | 5,870 | $89,092 | $632,297 | 7.1x |
| 7 | Collegeville | 121 | 5,247 | $91,466 | $568,662 | 6.2x |
| 8 | State College | 120 | 41,050 | $45,424 | $408,500 | 9.0x |
| 9 | New Freedom | 119 | 5,066 | $120,037 | $417,280 | 3.5x |
| 10 | Hatboro | 117 | 8,283 | $112,565 | $440,910 | 3.9x |
| 11 | Ambler | 116 | 6,847 | $77,394 | $686,428 | 8.9x |
| 12 | Wyomissing | 115 | 11,172 | $93,203 | $377,345 | 4.0x |
| 13 | Morrisville | 113 | 9,752 | $99,526 | $547,935 | 5.5x |
| 14 | Phoenixville | 112 | 19,452 | $102,138 | $521,603 | 5.1x |
| 15 | Perkasie | 111 | 9,216 | $93,845 | $512,871 | 5.5x |
| 16 | Kennett Square | 110 | 6,243 | $80,505 | $620,982 | 7.7x |
| 17 | Lansdale | 109 | 19,011 | $88,229 | $496,719 | 5.6x |
| 18 | Oakmont | 109 | 6,702 | $92,782 | $333,787 | 3.6x |
| 19 | Jefferson Hills | 107 | 12,317 | $116,064 | $350,948 | 3.0x |
| 20 | Souderton | 106 | 7,181 | $93,537 | $462,110 | 4.9x |
| 21 | Emmaus | 105 | 11,889 | $83,917 | $385,740 | 4.6x |
| 22 | Brookhaven | 105 | 8,331 | $91,042 | $265,656 | 2.9x |
| 23 | Camp Hill | 105 | 8,169 | $115,761 | $331,050 | 2.9x |
| 24 | Bridgeport | 105 | 5,174 | $82,705 | $352,989 | 4.3x |
| 25 | Lititz | 104 | 9,619 | $88,576 | $458,674 | 5.2x |
| 26 | Ridley Park | 104 | 7,261 | $93,594 | $309,370 | 3.3x |
| 27 | Oxford | 104 | 5,825 | $67,733 | $465,377 | 6.9x |
| 28 | Philadelphia | 103 | 1,579,706 | $61,953 | $231,814 | 3.7x |
| 29 | Lansdowne | 103 | 11,122 | $73,232 | $277,114 | 3.8x |
| 30 | Gettysburg | 103 | 8,254 | $54,365 | $366,470 | 6.7x |
| 31 | New Holland | 103 | 5,780 | $63,182 | $408,128 | 6.5x |
| 32 | Chambersburg | 102 | 22,319 | $56,576 | $286,440 | 5.1x |
| 33 | Economy | 102 | 9,005 | $95,313 | $278,625 | 2.9x |
| 34 | Prospect Park | 102 | 6,417 | $63,077 | $288,069 | 4.6x |
| 35 | Carlisle | 101 | 21,852 | $61,720 | $329,619 | 5.3x |
| 36 | Northampton | 101 | 10,400 | $90,762 | $345,140 | 3.8x |
| 37 | Bellefonte | 101 | 6,009 | $62,540 | $309,022 | 4.9x |
| 38 | Lewisburg | 101 | 5,257 | $54,767 | $326,711 | 6.0x |
| 39 | Bethlehem | 100 | 77,956 | $68,879 | $351,352 | 5.1x |
| 40 | Bristol | 100 | 9,902 | $76,042 | $339,367 | 4.5x |
| 41 | Millersville | 100 | 8,982 | $67,866 | $353,092 | 5.2x |
| 42 | Pleasant Hills | 100 | 8,399 | $102,167 | $265,879 | 2.6x |
| 43 | Mount Joy | 100 | 8,344 | $90,061 | $296,067 | 3.3x |
| 44 | New Cumberland | 100 | 7,580 | $82,154 | $292,639 | 3.6x |
| 45 | Norwood | 100 | 5,934 | $96,134 | $287,953 | 3.0x |
| 46 | Birdsboro | 100 | 5,116 | $86,290 | $331,844 | 3.8x |
| 47 | Clarks Summit | 100 | 5,073 | $92,083 | $323,509 | 3.5x |
| 48 | Plum | 99 | 26,723 | $98,705 | $252,851 | 2.6x |
| 49 | Waynesboro | 99 | 11,047 | $66,956 | $275,317 | 4.1x |
| 50 | East Stroudsburg | 99 | 9,319 | $59,821 | $309,993 | 5.2x |
| 51 | Glenolden | 99 | 7,220 | $72,786 | $241,349 | 3.3x |
| 52 | Clifton Heights | 99 | 6,832 | $70,931 | $259,886 | 3.7x |
| 53 | Sayre | 99 | 5,431 | $50,801 | $193,070 | 3.8x |
| 54 | Pittsburgh | 98 | 304,759 | $65,742 | $237,533 | 3.6x |
| 55 | Allentown | 98 | 125,976 | $55,494 | $309,698 | 5.6x |
| 56 | Hanover | 98 | 16,584 | $61,293 | $291,772 | 4.8x |
| 57 | Dunmore | 98 | 14,181 | $71,302 | $217,856 | 3.1x |
| 58 | Lower Burrell | 98 | 11,633 | $84,602 | $200,395 | 2.4x |
| 59 | Mechanicsburg | 98 | 9,720 | $84,421 | $401,857 | 4.8x |
| 60 | Wilson | 98 | 8,183 | $82,902 | $234,076 | 2.8x |
| 61 | Nazareth | 98 | 6,043 | $56,855 | $443,943 | 7.8x |
| 62 | Moosic | 98 | 5,973 | $80,187 | $238,010 | 3.0x |
| 63 | Crafton | 98 | 5,961 | $64,006 | $208,118 | 3.3x |
| 64 | Shippensburg | 98 | 5,620 | $51,503 | $197,415 | 3.8x |
| 65 | Shillington | 98 | 5,492 | $79,922 | $260,080 | 3.3x |
| 66 | Manheim | 98 | 5,027 | $81,273 | $273,737 | 3.4x |
| 67 | Whitehall | 97 | 14,811 | $89,404 | $262,405 | 2.9x |
| 68 | Catasauqua | 97 | 6,541 | $85,049 | $284,192 | 3.3x |
| 69 | Sharon Hill | 97 | 6,002 | $75,130 | $192,593 | 2.6x |
| 70 | Selinsgrove | 97 | 5,593 | $65,650 | $239,847 | 3.7x |
| 71 | Bangor | 97 | 5,163 | $70,076 | $324,589 | 4.6x |
| 72 | Baldwin | 96 | 21,057 | $80,983 | $231,521 | 2.9x |
| 73 | Ephrata | 96 | 13,772 | $69,735 | $249,296 | 3.6x |
| 74 | Collingdale | 96 | 8,897 | $51,886 | $201,850 | 3.9x |
| 75 | Bellevue | 96 | 8,128 | $68,827 | $236,964 | 3.4x |
| 76 | Dormont | 96 | 8,063 | $80,526 | $246,407 | 3.1x |
| 77 | Palmyra | 96 | 7,755 | $77,469 | $343,038 | 4.4x |
| 78 | Archbald | 96 | 7,404 | $71,936 | $242,130 | 3.4x |
| 79 | Hollidaysburg | 96 | 5,558 | $69,458 | $243,008 | 3.5x |
| 80 | Edinboro | 96 | 5,440 | $48,173 | $288,726 | 6.0x |
| 81 | Greensburg | 95 | 14,741 | $64,914 | $238,468 | 3.7x |
| 82 | Coatesville | 95 | 13,353 | $59,256 | $384,164 | 6.5x |
| 83 | Old Forge | 95 | 8,573 | $71,812 | $207,906 | 2.9x |
| 84 | Carnegie | 95 | 7,978 | $67,656 | $224,034 | 3.3x |
| 85 | Folcroft | 95 | 6,772 | $61,306 | $214,933 | 3.5x |
| 86 | Blakely | 95 | 6,662 | $55,855 | $220,300 | 3.9x |
| 87 | Forest Hills | 95 | 6,286 | $89,688 | $222,966 | 2.5x |
| 88 | South Williamsport | 95 | 6,211 | $64,583 | $191,786 | 3.0x |
| 89 | Stroudsburg | 95 | 5,894 | $66,674 | $346,452 | 5.2x |
| 90 | Bloomsburg | 94 | 13,024 | $51,536 | $257,066 | 5.0x |
| 91 | Yeadon | 94 | 12,181 | $49,759 | $228,206 | 4.6x |
| 92 | Castle Shannon | 94 | 8,209 | $64,071 | $211,413 | 3.3x |
| 93 | Taylor | 94 | 6,265 | $71,599 | $192,994 | 2.7x |
| 94 | Dickson City | 94 | 6,023 | $59,963 | $213,635 | 3.6x |
| 95 | Exeter | 94 | 5,541 | $57,639 | $225,839 | 3.9x |
| 96 | Olyphant | 94 | 5,381 | $66,423 | $228,297 | 3.4x |
| 97 | Lehighton | 94 | 5,268 | $64,651 | $277,946 | 4.3x |
| 98 | Easton | 93 | 29,739 | $69,348 | $371,500 | 5.4x |
| 99 | Kingston | 93 | 13,397 | $55,347 | $220,512 | 4.0x |
| 100 | Columbia | 93 | 10,278 | $54,437 | $290,829 | 5.3x |


