Most Native American places in California research summary. We used Saturday Night Science to research the California cities with the highest percentage of Native American residents for 2026. The data comes from the American Community Survey 2020-2024 vintage, which breaks down race by origin.
-
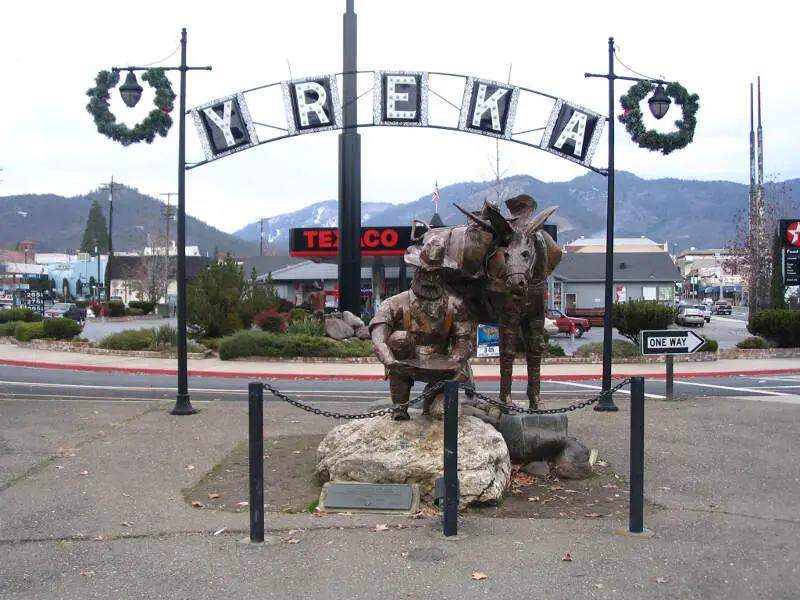
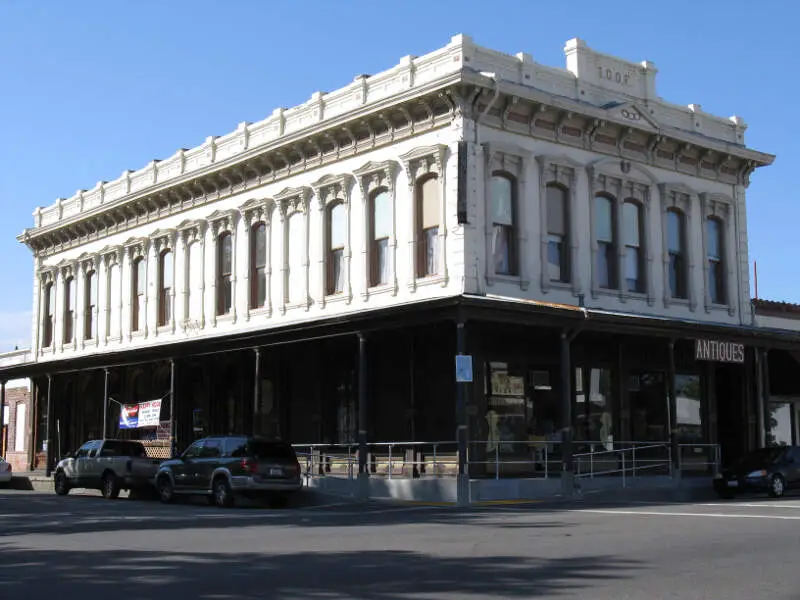
The city with the highest percentage of Native Americans is Yreka. 3.84% of people in Yreka are Native Americans.
-
The city with the lowest percentage of Native Americans is Los Gatos. 0.00% of people in Los Gatos are Native American.
-
The city with the most Native Americans is Los Angeles. 5,695 people in Los Angeles are Native American.
-
The city with the fewest Native Americans is Los Gatos. 0 people in Los Gatos are Native American.
-
The United States has 1,698,432 Native Americans and is 0.51% Native American.
Table Of Contents: Top Ten | Methodology | Summary | Table
The 10 Cities In California With The Largest Native American Population For 2026
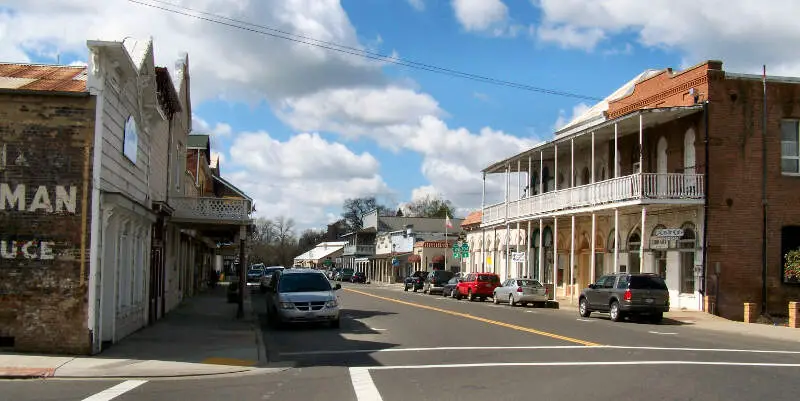
Which city in California had the largest Native American population? The place with the largest Native American population in California for 2026 is Yreka. 3.84 of Yreka identify as Native American.
To see where California ranked as a state on diversity, we have a ranking of the most diverse states in America.
And if you already knew these places were Native American, check out the best places to live in California or the most diverse places in California.
Read below to see how we crunched the numbers and how your town ranked.
Cities In California With The Largest Native American Population For 2026

/10
Population: 7,820
# Of Native American Residents: 300
% Native American: 3.84%
More on Yreka: Data | Crime | Cost Of Living | Movers

/10
Population: 11,255
# Of Native American Residents: 314
% Native American: 2.79%
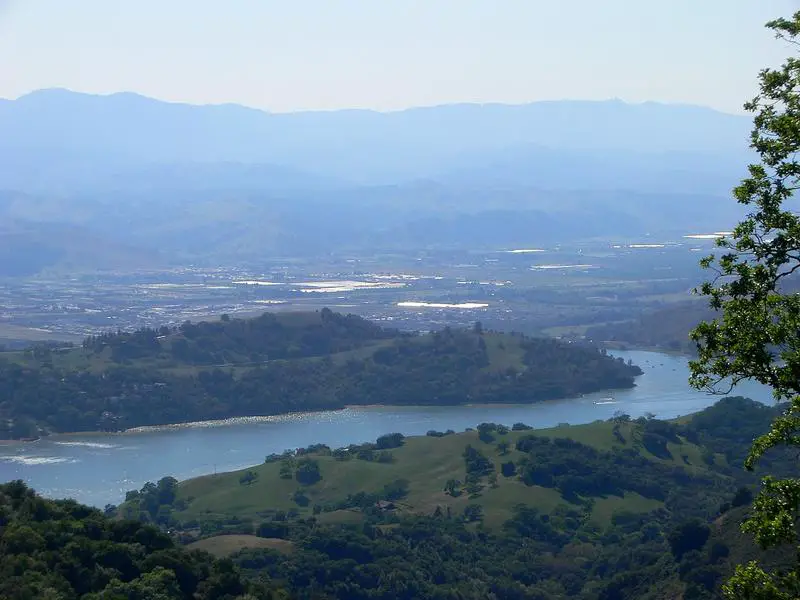
More on Anderson: Data | Crime | Cost Of Living | Movers
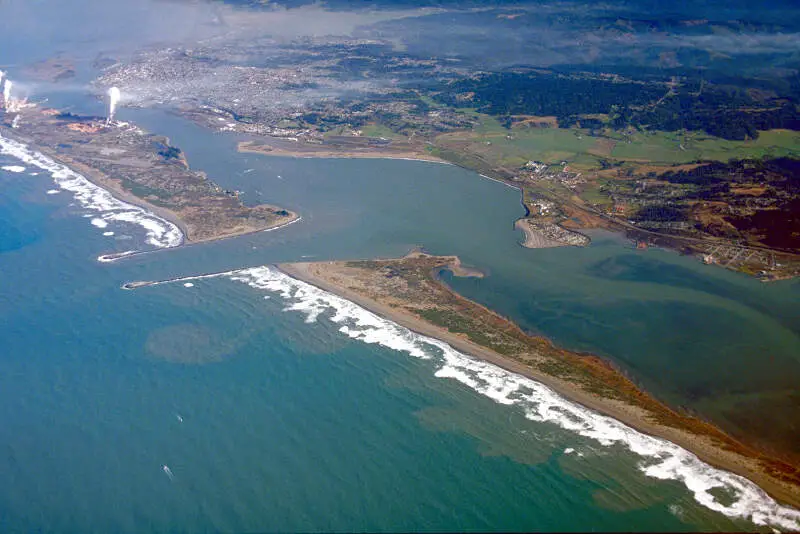
/10
Population: 6,046
# Of Native American Residents: 146
% Native American: 2.41%
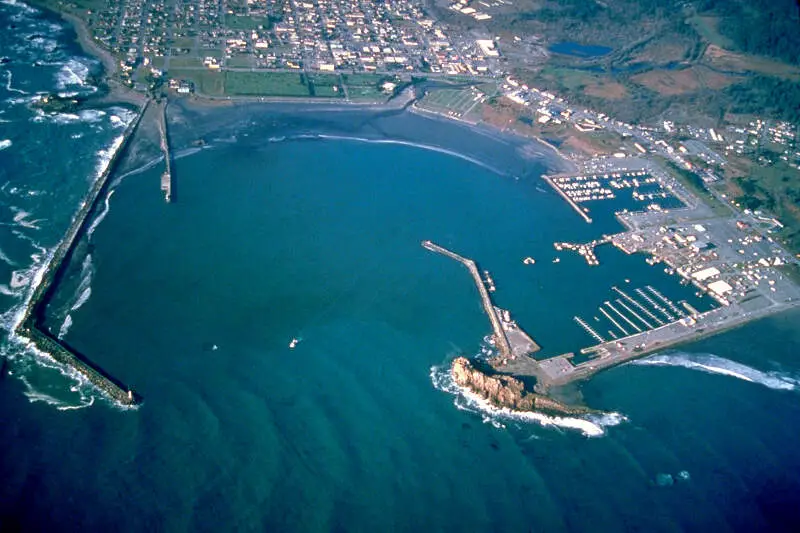
More on Crescent City: Data | Crime | Cost Of Living | Movers

/10
Population: 14,177
# Of Native American Residents: 339
% Native American: 2.39%
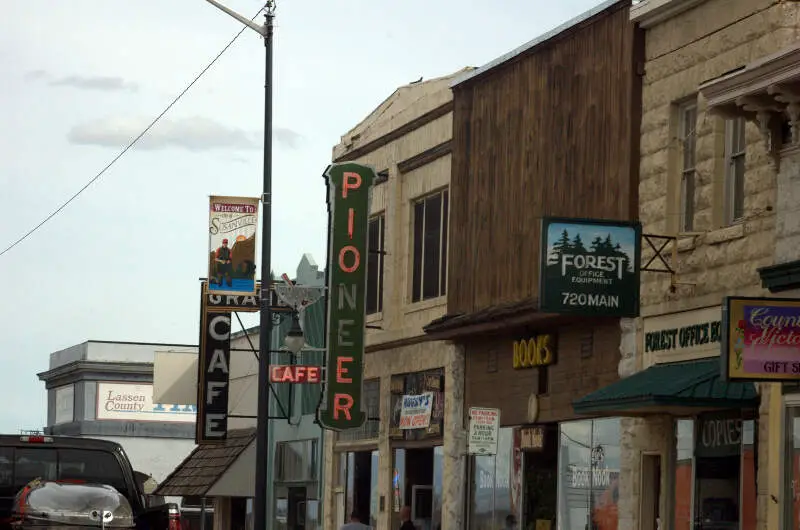
More on Susanville: Data | Crime | Cost Of Living | Movers

/10
Population: 14,549
# Of Native American Residents: 280
% Native American: 1.92%
More on Red Bluff: Data | Crime | Cost Of Living | Movers

/10
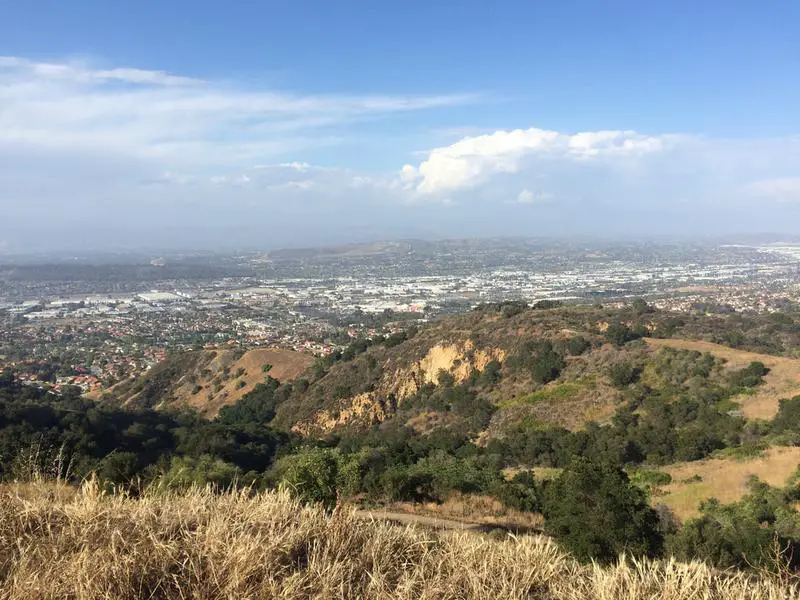
Population: 5,478
# Of Native American Residents: 94
% Native American: 1.72%
More on La Habra Heights: Data | Crime | Cost Of Living | Movers

/10
Population: 26,010
# Of Native American Residents: 446
% Native American: 1.71%
More on Eureka: Data | Crime | Cost Of Living | Movers

/10
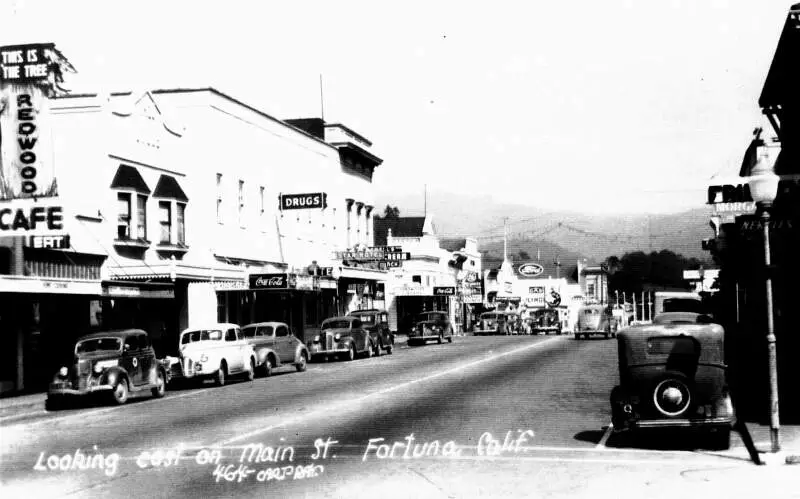
Population: 12,326
# Of Native American Residents: 197
% Native American: 1.6%
More on Fortuna: Data | Crime | Cost Of Living | Movers

/10
Population: 7,330
# Of Native American Residents: 115
% Native American: 1.57%
More on Gridley: Data | Crime | Cost Of Living | Movers

/10
Population: 9,156
# Of Native American Residents: 134
% Native American: 1.46%
More on Ione: Data | Crime | Cost Of Living | Movers
Methodology: How We Determined The Cities In California With The Largest Native American Population For 2026
We still believe in the accuracy of data — especially from the Census. So that’s where we went to get the race breakdown across California.
We used Saturday Night Science to analyze the Census’s most recently available data, the 2020-2024 American Community Survey data.
Specifically, we looked at table B03002: Hispanic OR LATINO ORIGIN BY RACE. Here are the category names as defined by the Census:
- Hispanic or Latino
- White alone*
- Black or African American alone*
- American Indian and Alaska Native alone*
- Asian alone*
- Native Hawaiian and Other Pacific Islander alone*
- Some other race alone*
- Two or more races*
Our particular column of interest here was the number of people identifying as American Indian and Alaska Native alone.
We limited our analysis to places with a population greater than 5,000 people. That left us with 421 cities.
We then calculated the percentage of residents that are American Indian and Alaska Native. The percentages ranked from 3.84 to 0.00.
Finally, we ranked each city based on the percentage of the American Indian and Alaska Native population, with a higher score being more American Indian and Alaska Native than a lower score. Yreka took the distinction of being the most American Indian and Alaska Native, while Los Gatos was the least Native American city.
We updated this article for 2026. This article is our eleventh time ranking the cities in California with the largest Native American population.
Summary: Native American Populations Across California
If you’re looking for a breakdown of Native American populations across California according to the most recent data, this is an accurate list.
The most Native American cities in California are Yreka, Anderson, Crescent City, Susanville, Red Bluff, La Habra Heights, Eureka, Fortuna, Gridley, and Ione.
If you’re curious enough, here are the least Native American places in California:
- Los Gatos
- Shafter
- Guadalupe
For more California reading, check out:
Most Native American Places In California
| Rank | City | Population | Native American Population | % Native American |
|---|---|---|---|---|
| 1 | Yreka | 7,820 | 300 | 3.84% |
| 2 | Anderson | 11,255 | 314 | 2.79% |
| 3 | Crescent City | 6,046 | 146 | 2.41% |
| 4 | Susanville | 14,177 | 339 | 2.39% |
| 5 | Red Bluff | 14,549 | 280 | 1.92% |
| 6 | La Habra Heights | 5,478 | 94 | 1.72% |
| 7 | Eureka | 26,010 | 446 | 1.71% |
| 8 | Fortuna | 12,326 | 197 | 1.6% |
| 9 | Gridley | 7,330 | 115 | 1.57% |
| 10 | Ione | 9,156 | 134 | 1.46% |
| 11 | Oroville | 19,752 | 281 | 1.42% |
| 12 | Ukiah | 16,304 | 227 | 1.39% |
| 13 | Windsor | 26,081 | 325 | 1.25% |
| 14 | La Puente | 37,142 | 451 | 1.21% |
| 15 | Redding | 93,409 | 1,133 | 1.21% |
| 16 | Marysville | 12,726 | 141 | 1.11% |
| 17 | Barstow | 25,100 | 275 | 1.1% |
| 18 | Fort Bragg | 7,032 | 75 | 1.07% |
| 19 | Yucca Valley | 21,770 | 222 | 1.02% |
| 20 | Corcoran | 22,491 | 204 | 0.91% |
| 21 | Hawaiian Gardens | 13,691 | 114 | 0.83% |
| 22 | California City | 14,414 | 120 | 0.83% |
| 23 | Arcata | 18,607 | 151 | 0.81% |
| 24 | Hemet | 91,326 | 707 | 0.77% |
| 25 | Paradise | 7,392 | 57 | 0.77% |
| 26 | Shasta Lake | 10,311 | 78 | 0.76% |
| 27 | Suisun City | 29,286 | 219 | 0.75% |
| 28 | Porterville | 63,157 | 471 | 0.75% |
| 29 | Coalinga | 17,203 | 123 | 0.71% |
| 30 | St. Helena | 5,318 | 38 | 0.71% |
| 31 | Yuba City | 69,471 | 489 | 0.7% |
| 32 | Calipatria | 6,548 | 46 | 0.7% |
| 33 | Banning | 31,093 | 215 | 0.69% |
| 34 | Twentynine Palms | 27,355 | 170 | 0.62% |
| 35 | Canyon Lake | 11,119 | 69 | 0.62% |
| 36 | Clearlake | 16,659 | 102 | 0.61% |
| 37 | Los Alamitos | 11,794 | 71 | 0.6% |
| 38 | Stanton | 39,402 | 227 | 0.58% |
| 39 | Clovis | 124,725 | 699 | 0.56% |
| 40 | Chico | 102,188 | 565 | 0.55% |
| 41 | La Verne | 30,600 | 168 | 0.55% |
| 42 | South Lake Tahoe | 21,269 | 116 | 0.55% |
| 43 | Diamond Bar | 53,355 | 290 | 0.54% |
| 44 | Rohnert Park | 44,575 | 239 | 0.54% |
| 45 | Mammoth Lakes | 7,214 | 38 | 0.53% |
| 46 | Arcadia | 55,170 | 290 | 0.53% |
| 47 | West Sacramento | 54,927 | 285 | 0.52% |
| 48 | Morro Bay | 10,692 | 54 | 0.51% |
| 49 | Blythe | 17,396 | 87 | 0.5% |
| 50 | Antioch | 116,477 | 579 | 0.5% |
| 51 | Chowchilla | 19,020 | 94 | 0.49% |
| 52 | Murrieta | 112,064 | 545 | 0.49% |
| 53 | Avenal | 13,608 | 66 | 0.49% |
| 54 | Woodland | 61,854 | 299 | 0.48% |
| 55 | Lompoc | 43,646 | 208 | 0.48% |
| 56 | Modesto | 219,215 | 994 | 0.45% |
| 57 | Beaumont | 56,266 | 255 | 0.45% |
| 58 | Rosemead | 50,013 | 225 | 0.45% |
| 59 | Pomona | 147,943 | 665 | 0.45% |
| 60 | Coronado | 19,015 | 85 | 0.45% |
| 61 | Orland | 8,357 | 37 | 0.44% |
| 62 | Newark | 46,903 | 203 | 0.43% |
| 63 | Adelanto | 37,964 | 164 | 0.43% |
| 64 | El Monte | 106,109 | 448 | 0.42% |
| 65 | Fresno | 545,970 | 2,265 | 0.41% |
| 66 | Brawley | 27,283 | 110 | 0.4% |
| 67 | Hanford | 59,754 | 239 | 0.4% |
| 68 | South El Monte | 19,287 | 77 | 0.4% |
| 69 | Laguna Woods | 17,289 | 69 | 0.4% |
| 70 | San Juan Capistrano | 35,095 | 139 | 0.4% |
| 71 | Auburn | 13,768 | 54 | 0.39% |
| 72 | Holtville | 5,617 | 22 | 0.39% |
| 73 | Bakersfield | 411,986 | 1,555 | 0.38% |
| 74 | Tiburon | 9,012 | 34 | 0.38% |
| 75 | Lawndale | 30,781 | 115 | 0.37% |
| 76 | Palmdale | 164,634 | 601 | 0.37% |
| 77 | Stockton | 322,326 | 1,162 | 0.36% |
| 78 | Palm Springs | 45,070 | 160 | 0.36% |
| 79 | Lathrop | 35,052 | 121 | 0.35% |
| 80 | Santa Barbara | 87,779 | 302 | 0.34% |
| 81 | Riverbank | 25,166 | 84 | 0.33% |
| 82 | Desert Hot Springs | 33,200 | 110 | 0.33% |
| 83 | Citrus Heights | 86,995 | 285 | 0.33% |
| 84 | El Paso De Robles (Paso Robles) | 31,446 | 101 | 0.32% |
| 85 | Dublin | 70,803 | 222 | 0.31% |
| 86 | Calimesa | 10,902 | 34 | 0.31% |
| 87 | Sierra Madre | 10,940 | 34 | 0.31% |
| 88 | Wasco | 26,558 | 82 | 0.31% |
| 89 | Rancho Mirage | 17,563 | 54 | 0.31% |
| 90 | Pico Rivera | 60,272 | 185 | 0.31% |
| 91 | La Quinta | 38,707 | 117 | 0.3% |
| 92 | Camarillo | 70,186 | 211 | 0.3% |
| 93 | Poway | 48,713 | 146 | 0.3% |
| 94 | San Gabriel | 38,392 | 115 | 0.3% |
| 95 | Petaluma | 59,247 | 177 | 0.3% |
| 96 | Indio | 91,950 | 273 | 0.3% |
| 97 | Santa Rosa | 177,090 | 524 | 0.3% |
| 98 | Merced | 91,953 | 271 | 0.29% |
| 99 | Sanger | 26,699 | 77 | 0.29% |
| 100 | Lemoore | 27,102 | 78 | 0.29% |


