Most Native American places in New York research summary. We used Saturday Night Science to research the New York cities with the highest percentage of Native American residents for 2026. The data comes from the American Community Survey 2020-2024 vintage, which breaks down race by origin.
The city with the highest percentage of Native Americans is Salamanca. 16.87% of people in Salamanca are Native Americans.
The city with the lowest percentage of Native Americans is Malverne. 0.00% of people in Malverne are Native American.
The city with the most Native Americans is New York. 16,347 people in New York are Native American.
The city with the fewest Native Americans is Malverne. 0 people in Malverne are Native American.
The United States has 1,698,432 Native Americans and is 0.51% Native American.
Which city in New York had the largest Native American population? The place with the largest Native American population in New York for 2026 is Salamanca. 16.87% of Salamanca identify as Native American.
16.9% Native American · 986 Native American residents
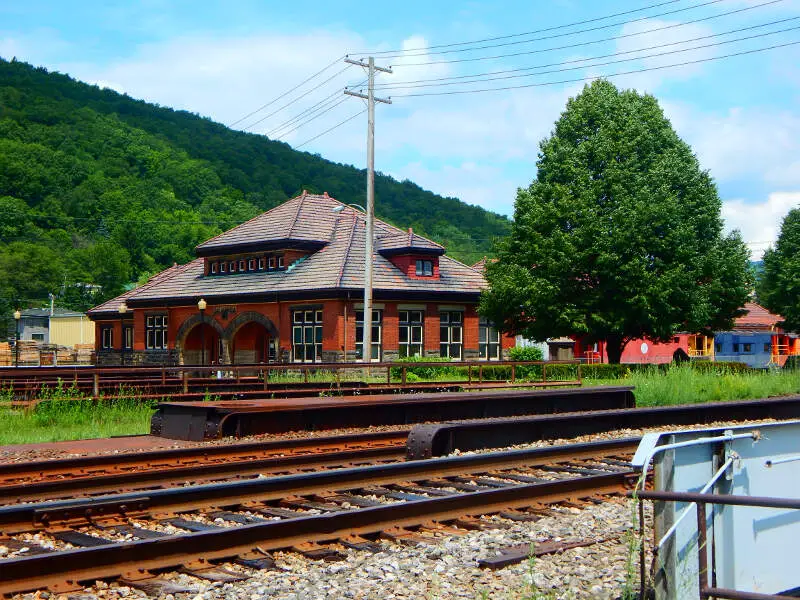
Salamanca is a city in Cattaraugus County, New York, United States, inside the Allegany Indian Reservation, one of two governed by the Seneca Nation of New York. The population was 5,815 at the 2010 census. It was named after Jos de Salamanca, a Spanish nobleman and cabinet minister of the mid-19th century.
Data | Crime | Cost of living | Movers
0.9% Native American · 51 Native American residents
Data | Crime | Cost of living | Movers
0.7% Native American · 351 Native American residents
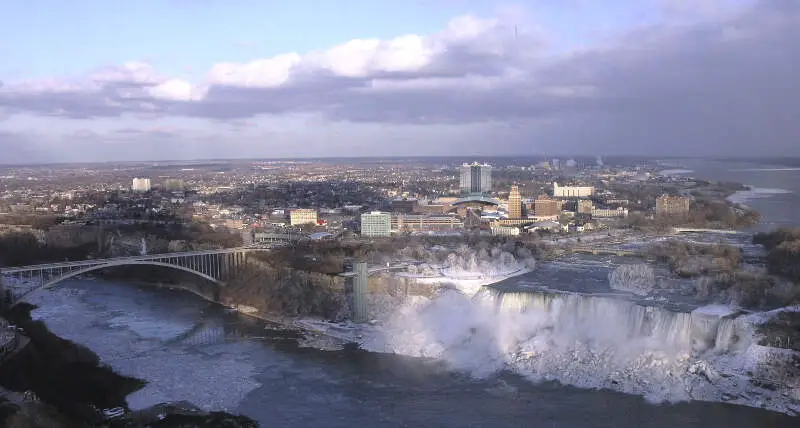
Niagara Falls is a city in Niagara County, New York, United States. As of the 2010 census, the city had a total population of 50,193, down from the 55,593 recorded in the 2000 census. It is adjacent to the Niagara River, across from the city of Niagara Falls, Ontario, and named after the famed Niagara Falls which they share. The city is within the Buffalo-Niagara Falls Metropolitan Statistical Area as well as the Western New York region.
Data | Crime | Cost of living | Movers
0.7% Native American · 39 Native American residents
Medina is a village in the Towns of Shelby and Ridgeway in Orleans County, New York, United States. The population was 6,065 at the 2010 census, making it the county’s most populous municipality. The village was named by its surveyor, Ebenezer Mix. It is part of the Rochester Metropolitan Statistical Area.
Data | Crime | Cost of living | Movers
0.7% Native American · 57 Native American residents
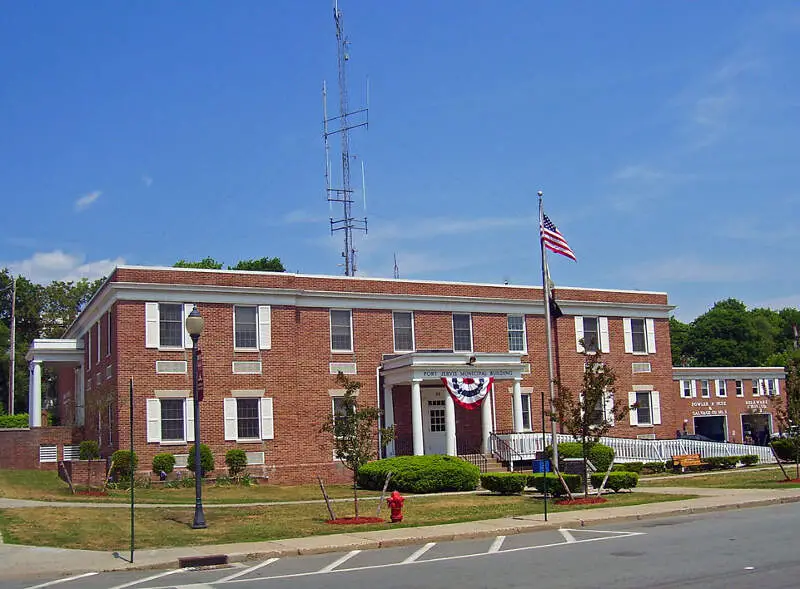
Port Jervis is a city located at the confluence of the Neversink and the Delaware rivers in western Orange County, New York, north of the Delaware Water Gap. Its population was 8,828 at the 2010 census. The communities of Deerpark, Huguenot, Sparrowbush, and Greenville are adjacent to Port Jervis. Matamoras, Pennsylvania is across the river and connected by bridge. Montague Township, New Jersey borders here.
Data | Crime | Cost of living | Movers
0.6% Native American · 117 Native American residents
Plattsburgh is a city in and the seat of Clinton County, New York, United States. The population was 19,989 at the 2010 census. The population of the unincorporated areas within the Town of Plattsburgh was 11,870 as of the 2010 census, making the population for the immediate Plattsburgh region 31,859.
Data | Crime | Cost of living | Movers
0.6% Native American · 59 Native American residents
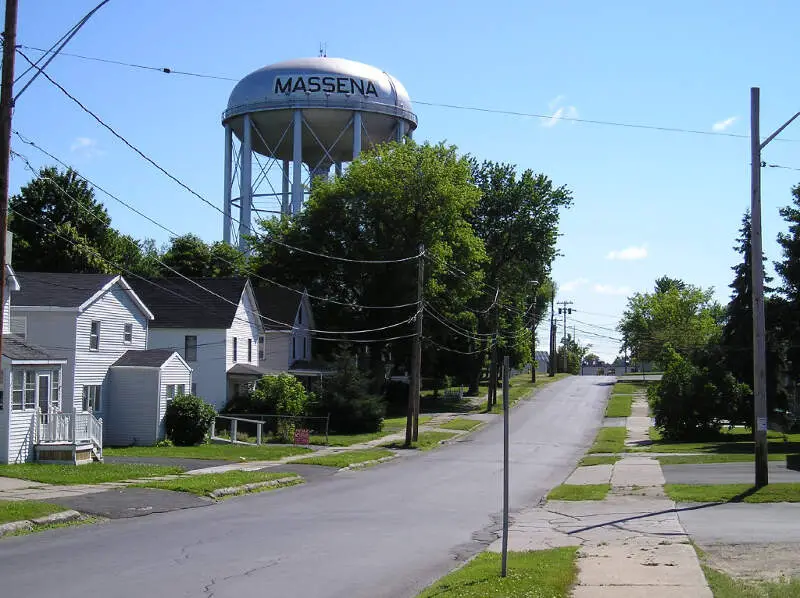
Massena is a town in St. Lawrence County, New York, United States. Massena is located along the northern border of the county, just south of the St. Lawrence River and the Canada-US border. The population was 12,883 at the 2010 census. The town of Massena contains a village also named Massena. The town and its village are named after Andr Massna, a general and Marshal of France during the Napoleonic Wars.
Data | Crime | Cost of living | Movers
0.5% Native American · 47 Native American residents
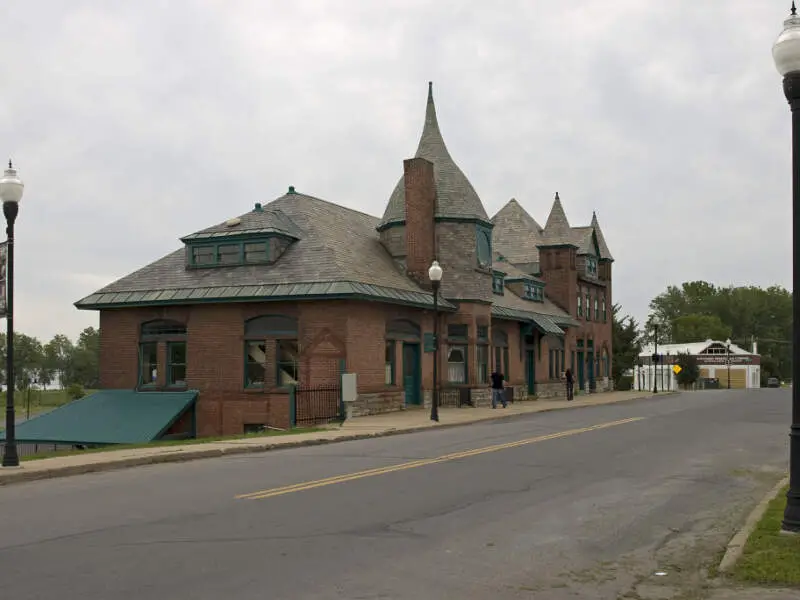
Ogdensburg is a city in St. Lawrence County, New York, United States. The population was 11,128 at the 2010 census. In the late 18th century, European-American settlers named the community after American land owner and developer Samuel Ogden.
Data | Crime | Cost of living | Movers
0.5% Native American · 48 Native American residents
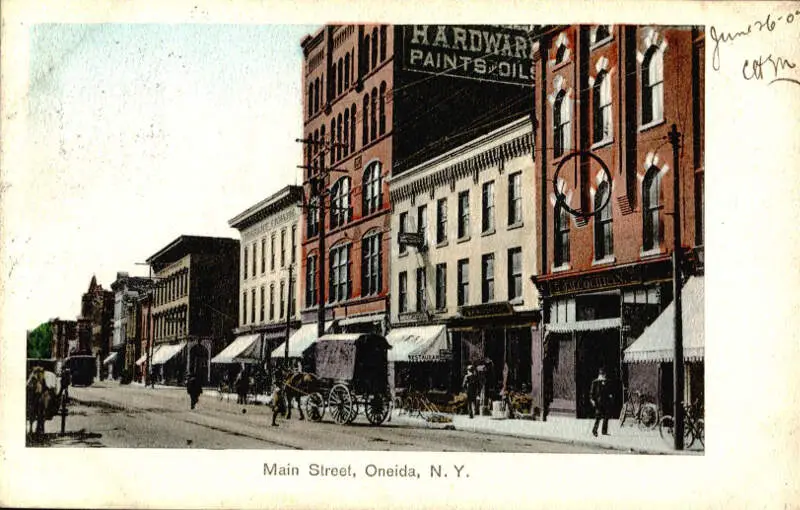
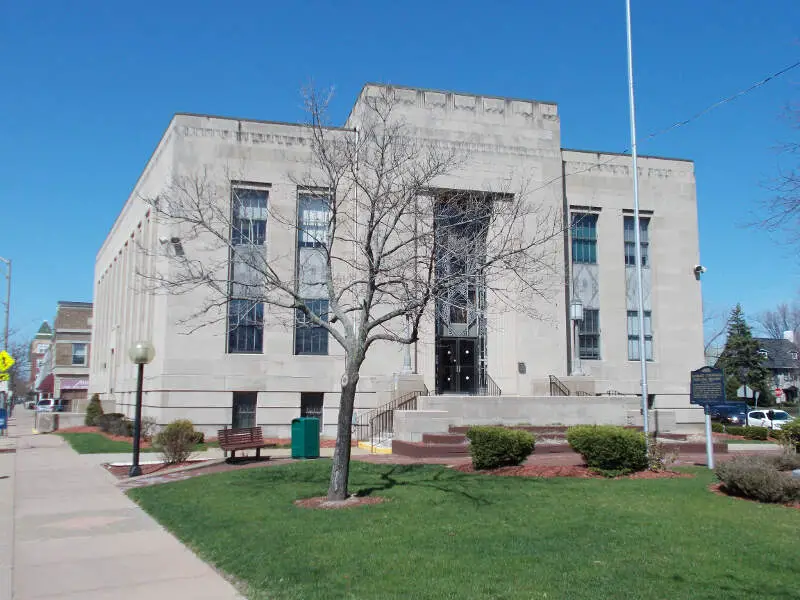
Oneida is a city in Madison County located west of Oneida Castle and east of Canastota, New York, United States. The population was 11,390 at the 2010 census. The city, like both Oneida County and the nearby silver and china maker, was named for the Oneida tribe, which had a large territory here around Oneida Lake during the colonial period.
Data | Crime | Cost of living | Movers
0.5% Native American · 69 Native American residents
Kenmore is a village in Erie County, New York, United States. The population was 15,423 at the 2010 census. It is part of the Buffalo-Niagara Falls metropolitan area.
Data | Crime | Cost of living | Movers
The receipts
Compare the top ten
Pick a metric. The bars rescale. The red line is New York’s statewide median.
On the map
Where New York’s Native American population is concentrated
Saturday Night Science
Methodology: How We Determined The Cities In New York With The Largest Native American Population For 2026
We still believe in the accuracy of data — especially from the Census. So that’s where we went to get the race breakdown across New York.
We used Saturday Night Science to analyze the Census’s most recently available data, the 2020-2024 American Community Survey data.
Specifically, we looked at table B03002: Hispanic OR LATINO ORIGIN BY RACE. Here are the category names as defined by the Census:
- Hispanic or Latino
- White alone
- Black or African American alone
- American Indian and Alaska Native alone
- Asian alone
- Native Hawaiian and Other Pacific Islander alone
- Some other race alone
- Two or more races
Our particular column of interest here was the number of people identifying as American Indian and Alaska Native alone.
We limited our analysis to places with a population greater than 5,000 people. That left us with 162 cities.
We then calculated the percentage of residents that are American Indian and Alaska Native. The percentages ranked from 16.87 to 0.00.
Finally, we ranked each city based on the percentage of the American Indian and Alaska Native population, with a higher score being more American Indian and Alaska Native than a lower score. Salamanca took the distinction of being the most American Indian and Alaska Native, while Malverne was the least Native American city.
We updated this article for 2026. This article is our eleventh time ranking the cities in New York with the largest Native American population.
The full plate
Most Native American Places In New York
Click any column to sort. Search by city name.
| Rank | City | Population | Native American Population | % Native American |
|---|---|---|---|---|
| 1 | Salamanca | 5,846 | 986 | 16.9% |
| 2 | Albion | 5,506 | 51 | 0.9% |
| 3 | Niagara Falls | 47,987 | 351 | 0.7% |
| 4 | Medina | 5,770 | 39 | 0.7% |
| 5 | Port Jervis | 8,652 | 57 | 0.7% |
| 6 | Plattsburgh | 19,830 | 117 | 0.6% |
| 7 | Massena | 10,238 | 59 | 0.6% |
| 8 | Ogdensburg | 9,455 | 47 | 0.5% |
| 9 | Oneida | 10,171 | 48 | 0.5% |
| 10 | Kenmore | 15,044 | 69 | 0.5% |
| 11 | Lancaster | 10,113 | 46 | 0.5% |
| 12 | Solvay | 6,544 | 26 | 0.4% |
| 13 | Mamaroneck | 19,826 | 76 | 0.4% |
| 14 | Syracuse | 146,384 | 541 | 0.4% |
| 15 | Larchmont | 6,567 | 21 | 0.3% |
| 16 | Warwick | 6,585 | 20 | 0.3% |
| 17 | Norwich | 6,782 | 20 | 0.3% |
| 18 | Buffalo | 276,854 | 790 | 0.3% |
| 19 | Elmira | 26,257 | 74 | 0.3% |
| 20 | Schenectady | 68,847 | 182 | 0.3% |
| 21 | Ithaca | 32,814 | 85 | 0.3% |
| 22 | Lockport | 20,610 | 51 | 0.2% |
| 23 | Potsdam | 8,427 | 20 | 0.2% |
| 24 | Hilton | 5,968 | 14 | 0.2% |
| 25 | Suffern | 11,441 | 24 | 0.2% |
| 26 | Bath | 5,560 | 11 | 0.2% |
| 27 | Auburn | 26,285 | 52 | 0.2% |
| 28 | New York | 8,483,844 | 16,347 | 0.2% |
| 29 | Jamestown | 28,188 | 54 | 0.2% |
| 30 | Binghamton | 47,151 | 86 | 0.2% |
| 31 | New Hempstead | 5,472 | 9 | 0.2% |
| 32 | Rye | 16,428 | 27 | 0.2% |
| 33 | Rochester | 208,772 | 337 | 0.2% |
| 34 | Lynbrook | 20,325 | 32 | 0.2% |
| 35 | Canton | 7,167 | 11 | 0.2% |
| 36 | New Rochelle | 82,769 | 127 | 0.2% |
| 37 | Lackawanna | 19,753 | 30 | 0.2% |
| 38 | Saratoga Springs | 28,631 | 43 | 0.2% |
| 39 | Yonkers | 209,978 | 315 | 0.2% |
| 40 | Wesley Hills | 6,196 | 9 | 0.1% |
| 41 | Oneonta | 15,045 | 21 | 0.1% |
| 42 | Rome | 31,795 | 44 | 0.1% |
| 43 | Utica | 64,217 | 81 | 0.1% |
| 44 | Amityville | 9,588 | 12 | 0.1% |
| 45 | Tonawanda | 15,030 | 18 | 0.1% |
| 46 | Mechanicville | 5,124 | 6 | 0.1% |
| 47 | Freeport | 44,088 | 46 | 0.1% |
| 48 | Troy | 51,033 | 47 | 0.1% |
| 49 | Westbury | 15,808 | 14 | 0.1% |
| 50 | Massapequa Park | 16,963 | 15 | 0.1% |
| 51 | Port Jefferson | 8,091 | 7 | 0.1% |
| 52 | New Paltz | 8,314 | 7 | 0.1% |
| 53 | Mount Vernon | 72,427 | 60 | 0.1% |
| 54 | Briarcliff Manor | 7,519 | 6 | 0.1% |
| 55 | North Tonawanda | 30,198 | 21 | 0.1% |
| 56 | Hudson Falls | 7,395 | 5 | 0.1% |
| 57 | Beacon | 14,834 | 10 | 0.1% |
| 58 | Newark | 8,991 | 6 | 0.1% |
| 59 | Peekskill | 25,625 | 17 | 0.1% |
| 60 | Lindenhurst | 27,142 | 18 | 0.1% |
| 61 | Fulton | 11,272 | 7 | 0.1% |
| 62 | Cohoes | 18,159 | 11 | 0.1% |
| 63 | Hempstead | 58,801 | 33 | 0.1% |
| 64 | Rensselaer | 9,287 | 5 | 0.1% |
| 65 | Oswego | 17,033 | 9 | 0.1% |
| 66 | East Aurora | 5,993 | 3 | 0.1% |
| 67 | Albany | 100,492 | 49 | 0.0% |
| 68 | Floral Park | 16,169 | 7 | 0.0% |
| 69 | Depew | 15,000 | 6 | 0.0% |
| 70 | Airmont | 10,205 | 4 | 0.0% |
| 71 | Kingston | 23,911 | 9 | 0.0% |
| 72 | Glen Cove | 28,112 | 10 | 0.0% |
| 73 | Amsterdam | 18,166 | 6 | 0.0% |
| 74 | Corning | 10,643 | 3 | 0.0% |
| 75 | Scotia | 7,264 | 2 | 0.0% |
| 76 | Batavia | 15,097 | 4 | 0.0% |
| 77 | Kiryas Joel | 38,916 | 10 | 0.0% |
| 78 | Glens Falls | 14,609 | 3 | 0.0% |
| 79 | Scarsdale | 18,010 | 3 | 0.0% |
| 80 | Watertown | 24,375 | 4 | 0.0% |
| 81 | Poughkeepsie | 31,958 | 5 | 0.0% |
| 82 | Spring Valley | 33,192 | 5 | 0.0% |
| 83 | Fredonia | 9,467 | 1 | 0.0% |
| 123 | Monroe | 9,515 | 0 | 0.0% |
| 123 | Lake Grove | 11,061 | 0 | 0.0% |
| 123 | Johnstown | 8,111 | 0 | 0.0% |
| 123 | Johnson City | 14,940 | 0 | 0.0% |
| 123 | Lawrence | 6,778 | 0 | 0.0% |
| 123 | Irvington | 6,531 | 0 | 0.0% |
| 123 | Ilion | 7,593 | 0 | 0.0% |
| 123 | Long Beach | 34,756 | 0 | 0.0% |
| 123 | Hudson | 5,865 | 0 | 0.0% |
| 123 | Monticello | 7,279 | 0 | 0.0% |
| 123 | Malone | 5,429 | 0 | 0.0% |
| 123 | Hornell | 8,152 | 0 | 0.0% |
| 123 | Manorhaven | 6,958 | 0 | 0.0% |
| 123 | Herkimer | 7,566 | 0 | 0.0% |
| 123 | Haverstraw | 12,325 | 0 | 0.0% |
| 123 | Hastings-on-Hudson | 8,434 | 0 | 0.0% |
| 123 | Mount Kisco | 10,737 | 0 | 0.0% |
Source: U.S. Census ACS 2020-2024, table B03002. 162 New York cities with more than 5,000 residents.
Summary
Summary: Native American Populations Across New York
If you’re looking for a breakdown of Native American populations across New York according to the most recent data, this is an accurate list.
The most Native American cities in New York are Salamanca, Albion, Niagara Falls, Medina, Port Jervis, Plattsburgh, Massena, Ogdensburg, Oneida, and Kenmore.


