Most Asian cities in Arizona research summary. We analyzed Arizona’s most recent Census data to determine the most Asian cities in Arizona based on the percentage of Asian residents.
Not sold on Arizona? Take the two-minute Find Your Place quiz and see which state actually fits you.
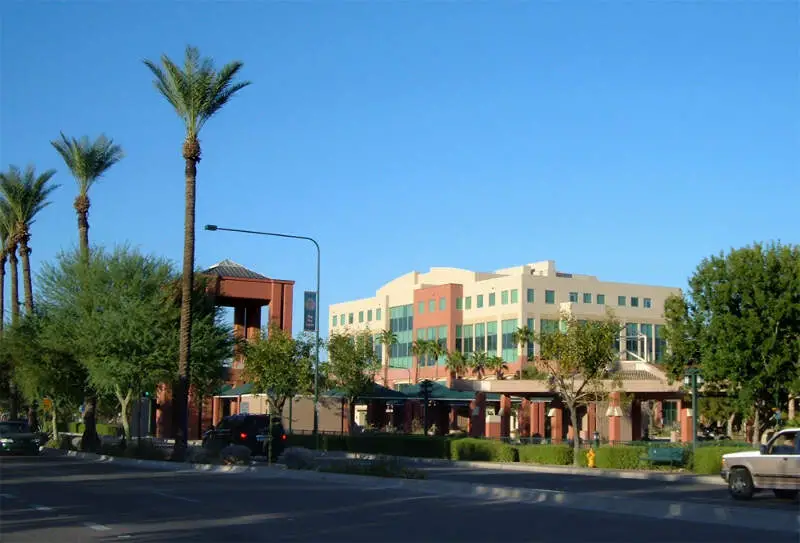
11.7% Asian · #1 most Asian in Arizona
Chandler is a city in Maricopa County, Arizona, United States, and a prominent suburb of the Phoenix, Arizona, Metropolitan Statistical Area. It is bordered to the north and west by Tempe, to the north by Mesa, to the west by Phoenix, to the south by the Gila River Indian Community, and to the east by Gilbert. As of July 2015, the population was 260,828 according to the United States Census Bureau, According to the city’s official website, Chandler’s Transportation & Development Department estimated the population, as of May 2016, to be 247,328. It also has satellite locations for many technology companies, including Intel and Orbital ATK.
Data | Crime | Cost of living | Movers | Compare
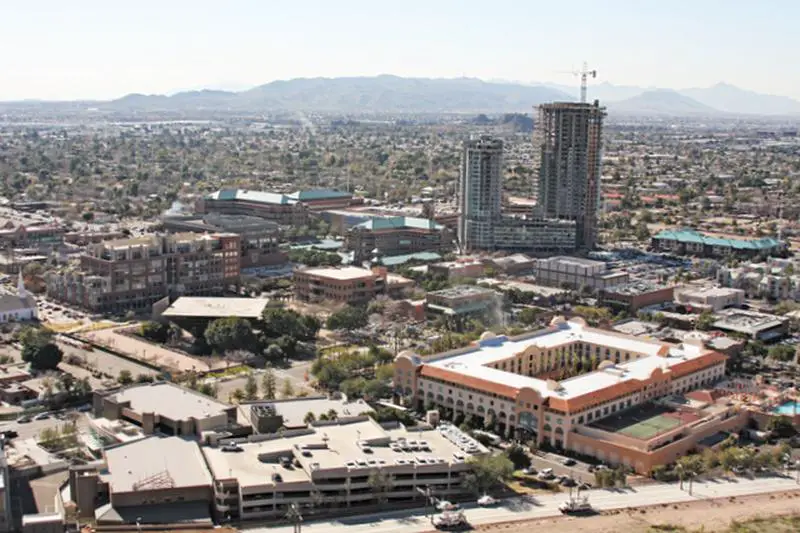
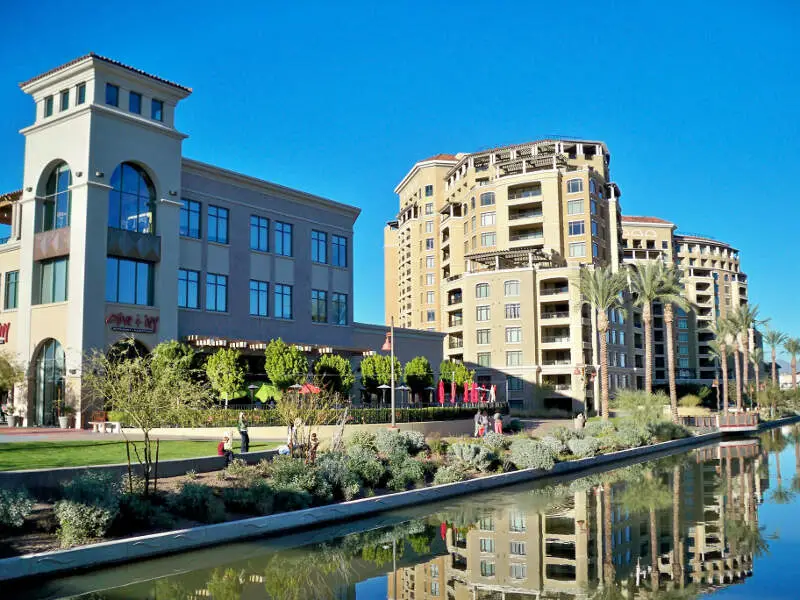
9.7% Asian · #2 most Asian in Arizona
Tempe, also known as Hayden’s Ferry during the territorial times of Arizona, is a city in Maricopa County, Arizona, United States, with the Census Bureau reporting a 2010 population of 161,719. The city is named after the Vale of Tempe in Greece. Tempe is located in the East Valley section of metropolitan Phoenix; it is bordered by Phoenix and Guadalupe on the west, Scottsdale on the north, Chandler on the south, and Mesa on the east. Tempe is also the location of the main campus of Arizona State University.
Data | Crime | Cost of living | Movers | Compare
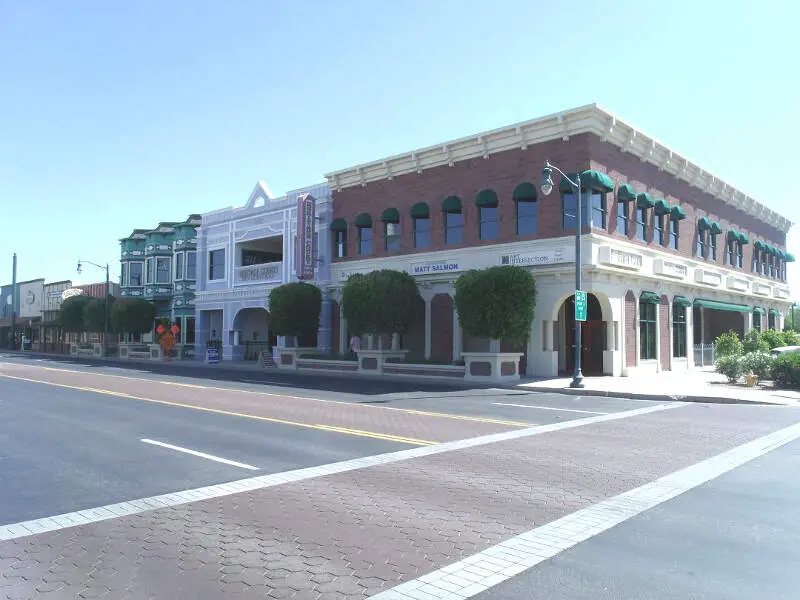
6.7% Asian · #3 most Asian in Arizona
Gilbert is a town in Maricopa County, Arizona, United States, located southeast of Phoenix, within the Phoenix metropolitan area. Once known as the “Hay Shipping Capital of the World”, Gilbert is currently the most populous incorporated town in the United States. It is the sixth-largest municipality in Arizona, and the fifth-largest in the Metropolitan Phoenix Area.
Data | Crime | Cost of living | Movers | Compare
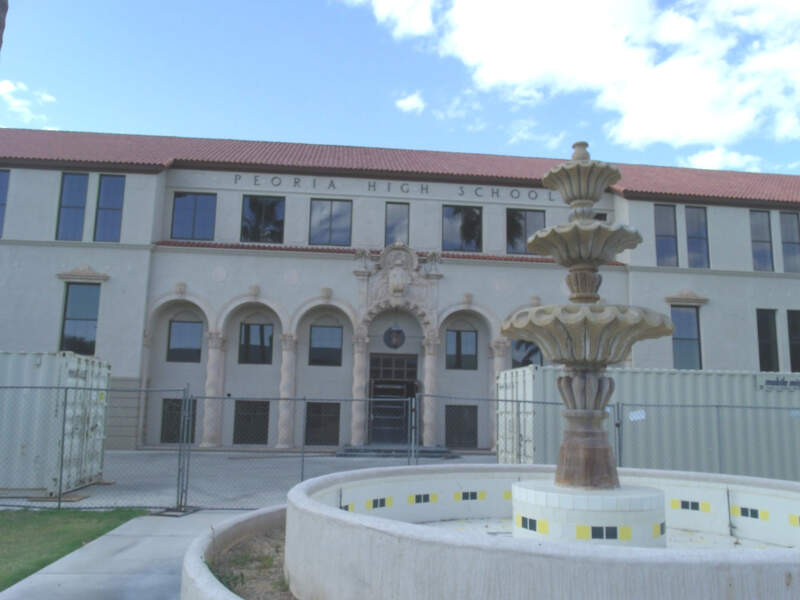
5.3% Asian · #4 most Asian in Arizona
Peoria is a city in Maricopa and Yavapai counties in the State of Arizona. Most of the city is located in Maricopa County, while a tiny portion in the north is in Yavapai County. It is a major suburb of Phoenix. According to 2010 Census Bureau releases, the population of the city is 154,065. Peoria is currently the sixth largest city in Arizona for land area, and the ninth largest for population. It was named after Peoria, Illinois. The word “peoria” is a corruption of the Illini word for “prairie fire.” It is the spring training home of the San Diego Padres and Seattle Mariners who share the Peoria Sports Complex. In July 2008, Money magazine listed Peoria in its Top 100 Places to Live.
Data | Crime | Cost of living | Movers
4.9% Asian · #5 most Asian in Arizona
Scottsdale is a city in the eastern part of Maricopa County, Arizona, adjacent to the Greater Phoenix Area. Named Scottsdale in 1894 after founder Winfield Scott and incorporated in 1951 with a population of 2,000, the 2015 population of the city is estimated to be 236,839 according to the U.S. Census Bureau. The New York Times described downtown Scottsdale as “a desert version of Miami’s South Beach” and as having “plenty of late night partying and a buzzing hotel scene.” Its slogan is “The West’s Most Western Town.”
Data | Crime | Cost of living | Movers | Compare
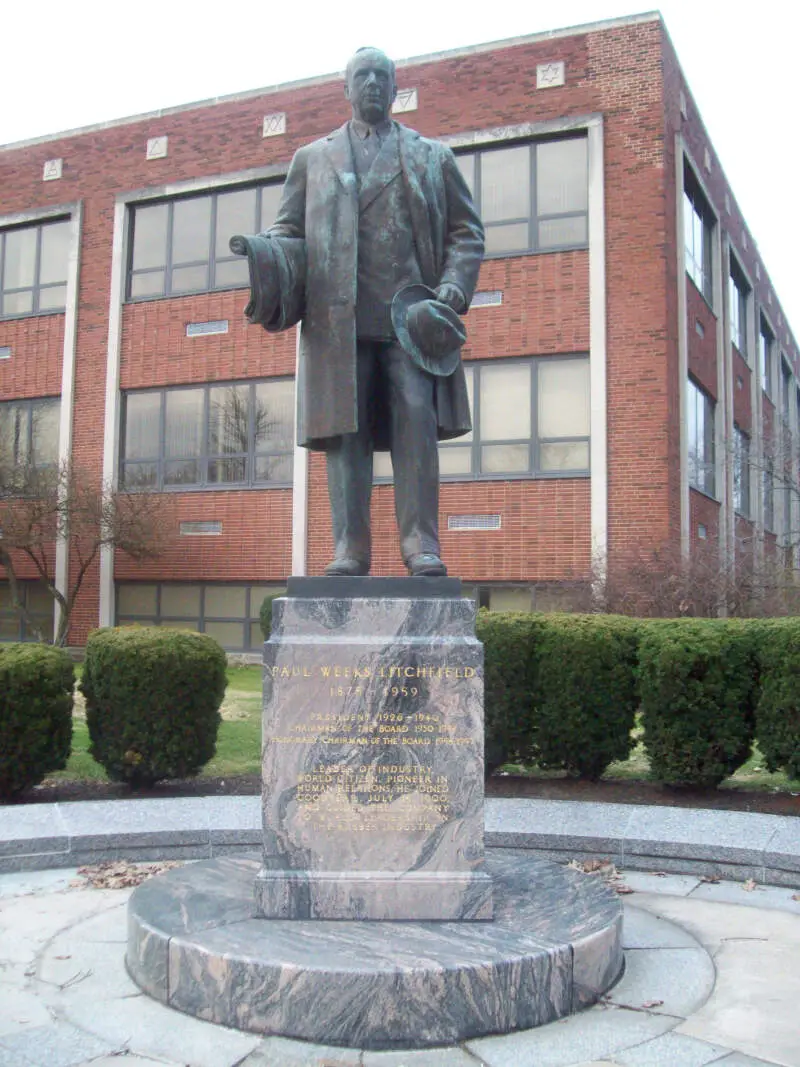
4.9% Asian · #6 most Asian in Arizona
Litchfield Park is a city in Maricopa County, Arizona, United States. It is twenty miles northwest of Phoenix. According to the 2010 census, the population of the city is 5,476.
Data | Crime | Cost of living | Movers
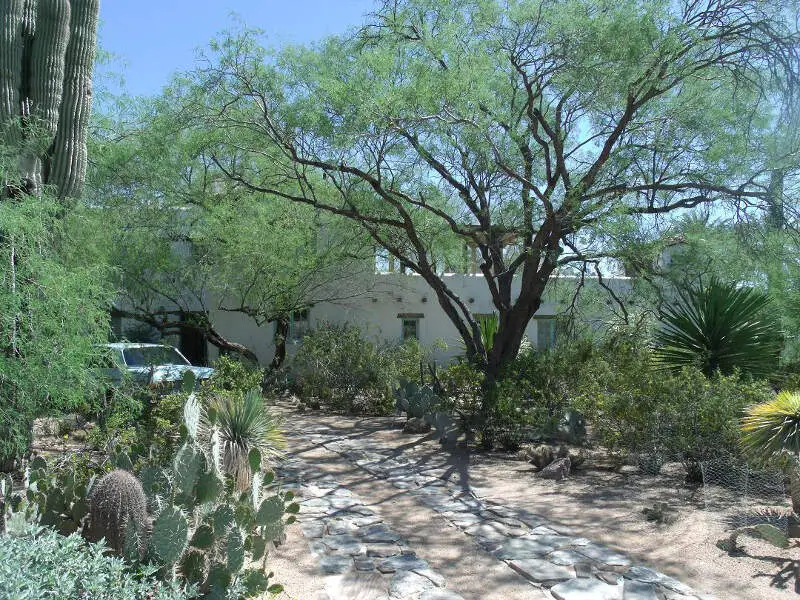
4.8% Asian · #7 most Asian in Arizona
Paradise Valley is a small, affluent town in Maricopa County, Arizona. The town is known for its luxury golf courses, shopping, and restaurant scene.
It should not be confused with Paradise Valley Village, an official municipal designation, in northeast Phoenix. For instance, Paradise Valley Community College, Paradise Valley High School, Paradise Valley Hospital, Paradise Valley Mall, and Paradise Valley Golf Course are all located several miles to the north of the town, in Phoenix. T
Data | Crime | Cost of living | Movers
4.2% Asian · #8 most Asian in Arizona
Glendale is a city in Maricopa County, Arizona, United States, located about nine miles northwest from Downtown Phoenix. According to the 2010 census, the population of the city is 226,721.
Data | Crime | Cost of living | Movers | Compare
4.1% Asian · #9 most Asian in Arizona
Data | Crime | Cost of living | Movers
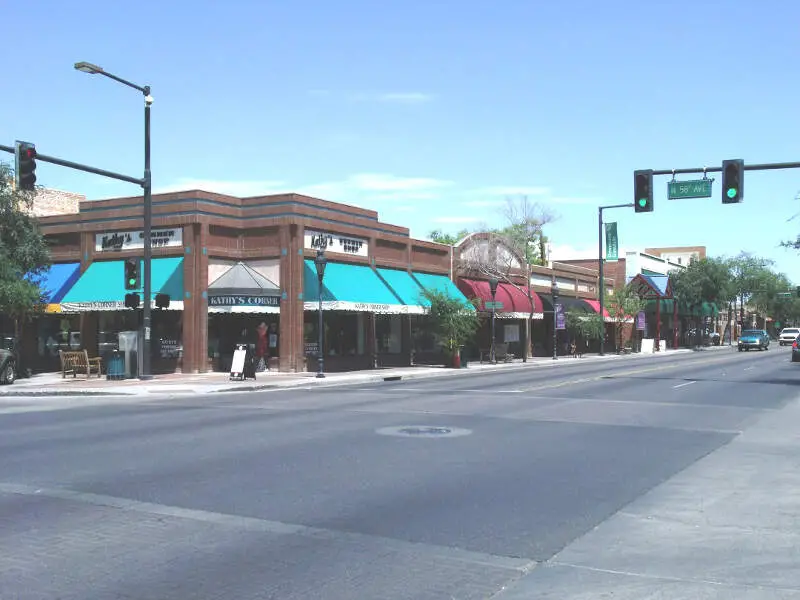
4.0% Asian · #10 most Asian in Arizona
Globe is a city in Gila County, Arizona, United States. As of the 2010 census, the population of the city was 7,532. The city is the county seat of Gila County. Globe was founded c. 1875 as a mining camp. Mining, tourism, government and retirees are most important in the present-day Globe economy.
Data | Crime | Cost of living | Movers
The receipts
Compare the top ten
Pick a metric. The bars rescale. The red line is Arizona’s statewide median.
On the map
Where Arizona’s Asian communities live
Saturday Night Science
Methodology: How We Determined The Cities In Arizona With The Largest Asian Population For 2026
We used Saturday Night Science to compare Census data on race across every place in Arizona.
The Census’s most recently available data comes from the 2020-2024 American Community Survey.
Specifically, we looked at table B03002: Hispanic OR LATINO ORIGIN BY RACE. Here are the category names as defined by the Census:
- Hispanic or Latino
- White alone*
- Black or African American alone*
- American Indian and Alaska Native alone*
- Asian alone*
- Native Hawaiian and Other Pacific Islander alone*
- Some other race alone*
- Two or more races*
Our particular column of interest here was the number of people who identified as Asian alone.
We limited our analysis to cities with a population greater than 5,000 people. That left us with 54 cities.
We then calculated the percentage of residents that are Asian. The percentages ranked from 11.7% to 0.0%.
Finally, we ranked each city based on the percentage of Asian population, with a higher percentage being more Asian. Chandler took the distinction of being the most Asian, while Tolleson was the least Asian city.
We updated this article for 2026. This report reflects our eleventh time ranking the cities in Arizona with the largest Asian population.
The full plate
Cities In Arizona By Asian Population
Click any column to sort. Search by city name.
| Rank | City | Population | Asian Population | % Asian |
|---|---|---|---|---|
| 1 | Chandler | 280,136 | 32,774 | 11.7% |
| 2 | Tempe | 188,065 | 18,166 | 9.7% |
| 3 | Gilbert | 280,262 | 18,661 | 6.7% |
| 4 | Peoria | 196,906 | 10,401 | 5.3% |
| 5 | Scottsdale | 243,821 | 11,946 | 4.9% |
| 6 | Litchfield Park | 6,916 | 337 | 4.9% |
| 7 | Paradise Valley | 12,611 | 604 | 4.8% |
| 8 | Glendale | 252,833 | 10,707 | 4.2% |
| 9 | Avondale | 92,477 | 3,795 | 4.1% |
| 10 | Globe | 7,195 | 291 | 4.0% |
| 11 | Oro Valley | 48,162 | 1,938 | 4.0% |
| 12 | Phoenix | 1,642,323 | 65,942 | 4.0% |
| 13 | Marana | 56,938 | 2,107 | 3.7% |
| 14 | Sierra Vista | 45,155 | 1,591 | 3.5% |
| 15 | Goodyear | 107,645 | 3,519 | 3.3% |
| 16 | Tucson | 547,073 | 17,022 | 3.1% |
| 17 | Maricopa | 67,163 | 2,073 | 3.1% |
| 18 | Queen Creek | 71,867 | 1,984 | 2.8% |
| 19 | Youn | 7,015 | 192 | 2.7% |
| 20 | Page | 7,345 | 191 | 2.6% |
| 21 | Casa Grande | 60,905 | 1,521 | 2.5% |
| 22 | Mesa | 511,764 | 12,492 | 2.4% |
| 23 | Surprise | 154,948 | 3,780 | 2.4% |
| 24 | Flagstaff | 76,445 | 1,771 | 2.3% |
| 25 | Fountain Hills | 23,789 | 510 | 2.1% |
| 26 | Prescott | 47,400 | 991 | 2.1% |
| 27 | Sedona | 9,777 | 193 | 2.0% |
| 28 | Apache Junction | 41,058 | 709 | 1.7% |
| 29 | Yuma | 100,139 | 1,708 | 1.7% |
| 30 | Kingman | 34,375 | 569 | 1.7% |
| 31 | Bullhead City | 42,496 | 657 | 1.5% |
| 32 | Prescott Valley | 49,179 | 609 | 1.2% |
| 33 | Sahuarita | 35,862 | 414 | 1.2% |
| 34 | Show Low | 12,102 | 136 | 1.1% |
| 35 | Guadalupe | 5,272 | 58 | 1.1% |
| 36 | El Mirage | 36,088 | 342 | 0.9% |
| 37 | Eloy | 17,433 | 146 | 0.8% |
| 38 | Lake Havasu City | 58,359 | 382 | 0.7% |
| 39 | Payson | 16,622 | 93 | 0.6% |
| 40 | Winslow | 8,773 | 48 | 0.5% |
| 41 | Florence | 25,570 | 135 | 0.5% |
| 42 | Cottonwood | 12,580 | 66 | 0.5% |
| 43 | Safford | 10,239 | 53 | 0.5% |
| 44 | Douglas | 15,981 | 78 | 0.5% |
| 45 | Wickenburg | 8,059 | 36 | 0.4% |
| 46 | Coolidge | 16,636 | 73 | 0.4% |
| 47 | Benson | 5,417 | 19 | 0.4% |
| 48 | Chino Valley | 13,602 | 46 | 0.3% |
| 49 | Nogales | 19,841 | 66 | 0.3% |
| 50 | Camp Verde | 12,521 | 9 | 0.1% |
| 51 | San Luis | 37,337 | 23 | 0.1% |
| 53 | Snowflake | 6,444 | 0 | 0.0% |
| 53 | Somerton | 14,574 | 0 | 0.0% |
| 53 | Tolleson | 7,668 | 0 | 0.0% |
Source: U.S. Census ACS 2020-2024. 54 cities with more than 5,000 residents.
Summary
Summary: Asian Populations Across Arizona
If you’re looking for a breakdown of Asian populations across Arizona according to the most recent data, this is an accurate list.
The most Asian cities in Arizona are Chandler, Tempe, Gilbert, Peoria, Scottsdale, Litchfield Park, Paradise Valley, Glendale, Avondale, and Globe. Wondering how Chandler stacks up against a bigger name? See Chandler, AZ vs. Ferguson, MO side by side.
Questions and answers
Most Asian Cities In Arizona FAQs
What is the most Asian city in Arizona?
Chandler is the most Asian city in Arizona for 2026, at 11.7% of residents. Tempe and Gilbert are next.
What cities in Arizona have the largest Asian population?
The Arizona cities with the largest Asian population shares are Chandler, Tempe, Gilbert, Peoria, Scottsdale, Litchfield Park, Paradise Valley, Glendale, Avondale, and Globe. We ranked all 54 places with more than 5,000 residents.
What percent of Chandler is Asian?
Asian residents make up 11.7% of Chandler, the highest share of the 54 Arizona places we measured. The numbers come from the Census Bureau’s American Community Survey.
What is the least Asian city in Arizona?
Tolleson is the least Asian city in Arizona, at 0.0%. It sits at the opposite end of the same ranking.
Where does this data come from?
Every share is calculated from the Census Bureau’s American Community Survey (2020-2024), based on residents identifying as Asian alone. We rank each Arizona place with more than 5,000 residents.


